Data visualization display method and system
A data display and display system technology, applied in the data field, can solve the problems of inability to meet the user's personalized data display requirements, inability to analyze data in depth, etc., and achieve the effects of deep mining and calculation, improved scalability, and improved operational efficiency
- Summary
- Abstract
- Description
- Claims
- Application Information
AI Technical Summary
Problems solved by technology
Method used
Image
Examples
Embodiment 1
[0043] Such as figure 1 As shown, this embodiment discloses a data visualization display system, including:
[0044] The raw data storage module 5 is used to store the cleaned raw data of the system, and the data update module 3 extracts the target data from the raw data storage module 5;
[0045] The original data storage module 5 here adopts hadoop cluster, and uses hdfs / hive to store the original data of products, such as product information data such as MAC and IP; user registration data such as user ID, gender, age, etc.; number of startups, browsing time, and frequency of use and other user behavior data;
[0046] The data display module 1 is used to load web pages, that is, web pages, display rendering data, and provide users with functions such as interaction, query, and download;
[0047] The server module 7 provides background services for the system, uses nginx to provide reverse proxy services, and deploys python+Django applications;
[0048] Database module 2, ...
Embodiment 2
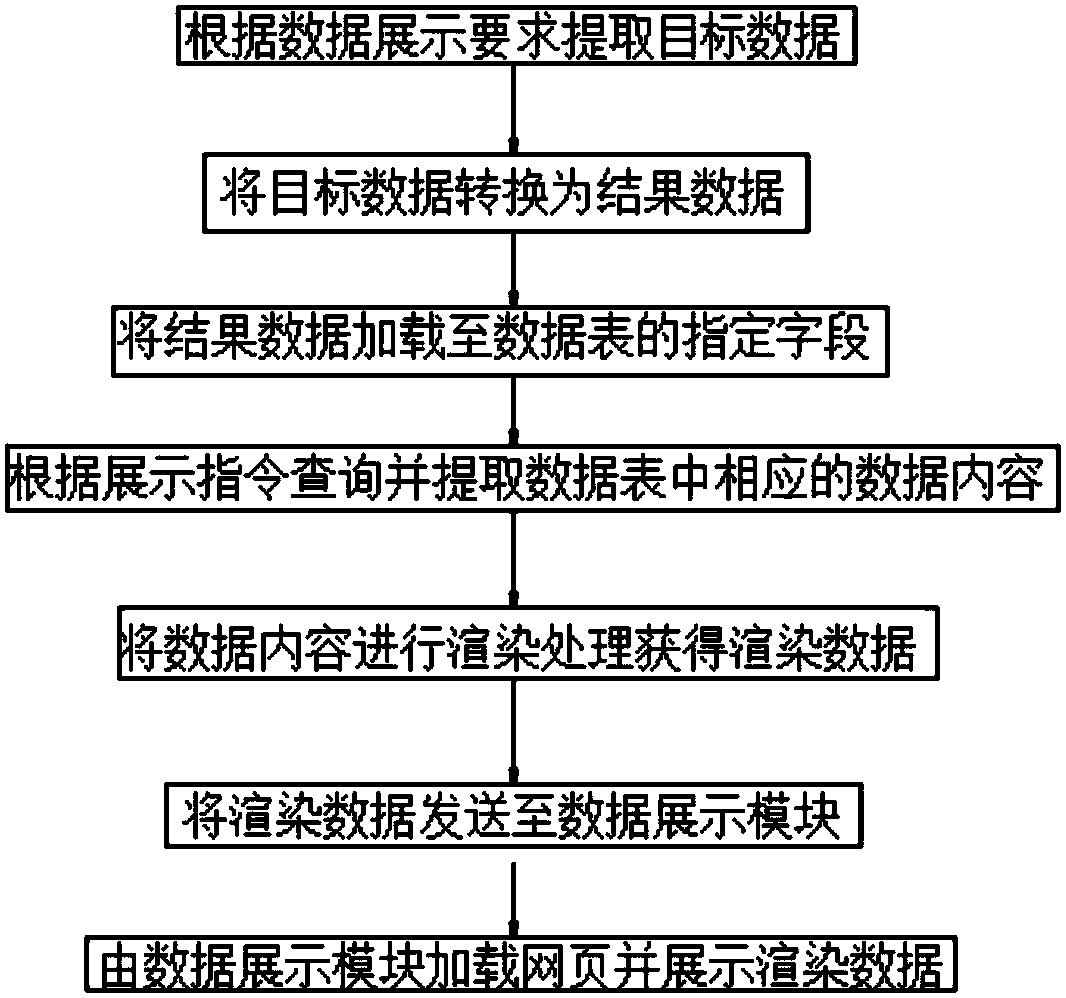
[0058] Such as figure 2 As shown, this embodiment discloses a data visualization display method, including:
[0059] A: Extract the target data according to the data display requirements and convert the target data into result data, and then load the result data into the specified fields in the data table;
[0060] In this step, extract the target data from the original data storage module 5; the original data through data cleaning is stored in the original data storage module 5;
[0061] Specifically, data display requirements refer to the content that users want to see, such as daily activity rate, weekly activity rate, monthly activity rate, user composition, user distribution, and the ratio of returning users to all users on the day, etc. The ratio of users needs to be extracted according to the data display requirements: the total number of users of the day, the list of active users of the day, the list of lost users and other data;
[0062] Further, in method A, the t...
PUM
 Abstract
Description
Claims
Application Information
 - R&D
- Intellectual Property
- Life Sciences
- Materials
- Tech Scout
- Unparalleled Data Quality
- Higher Quality Content
- 60% Fewer Hallucinations
Browse by: Latest US Patents, China's latest patents, Technical Efficacy Thesaurus, Application Domain, Technology Topic, Popular Technical Reports.
© 2025 PatSnap. All rights reserved.Legal|Privacy policy|Modern Slavery Act Transparency Statement|Sitemap|About US| Contact US: help@patsnap.com


