Data visualization method and device

A data and data table technology, applied in the field of visualization, can solve problems such as unintuitive visualization models, and achieve the effect of an instant overall overview

Inactive Publication Date: 2019-11-05
CHINA MOBILE SUZHOU SOFTWARE TECH CO LTD +1
View PDF7 Cites 0 Cited by
  • Summary
  • Abstract
  • Description
  • Claims
  • Application Information

AI Technical Summary

Problems solved by technology

[0004] Embodiments of the present invention provide a data visualization method and device to solve the problem that the visualization model is not intuitive in the prior art

Method used


Image

  • Data visualization method and device
  • Data visualization method and device
  • Data visualization method and device

Examples


Embodiment Construction

[0029] In order to make the purpose, technical solutions and advantages of the present invention clearer, the present invention will be further described in detail below in conjunction with the accompanying drawings. Obviously, the described embodiments are only some of the embodiments of the present invention, rather than all of them. Based on the embodiments of the present invention, all other embodiments obtained by persons of ordinary skill in the art without making creative efforts belong to the protection scope of the present invention.

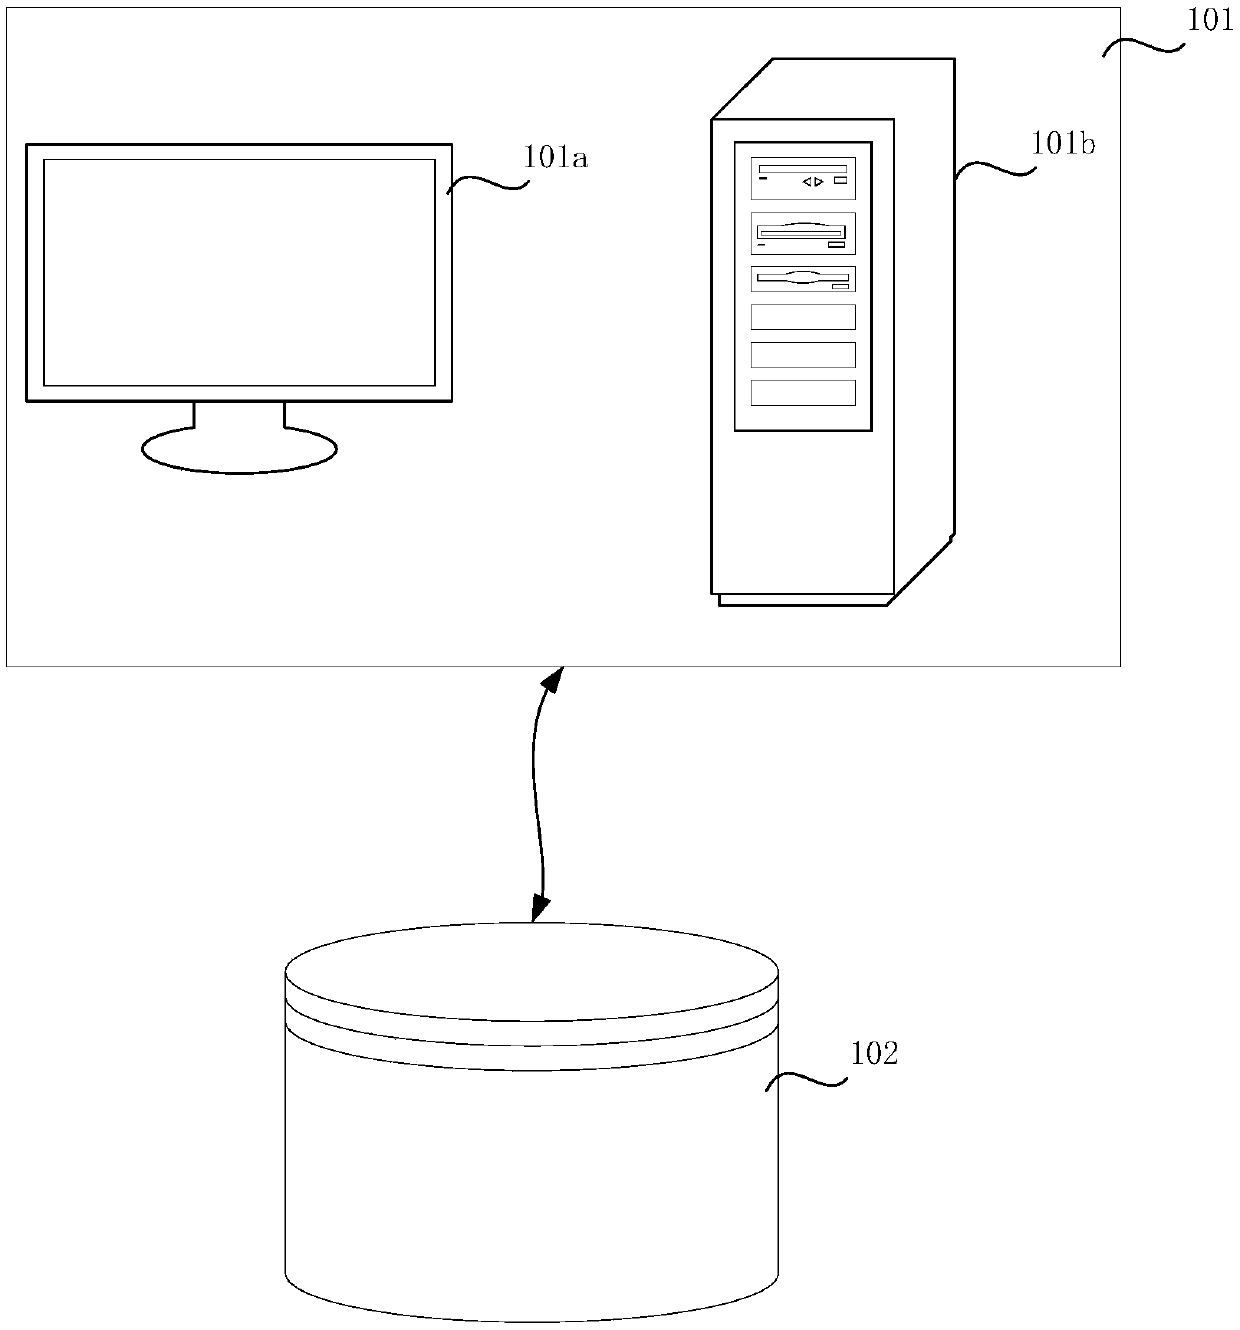
[0030] figure 1 A schematic structural diagram of a system applying an embodiment of the present invention is shown. Such as figure 1 As shown, the system architecture may include a visualization platform 101 and a database 102 . The visualization platform 101 includes a front end 101a and a back end 101b. The front-end 101a is used to configure the visualization model, which can be a display of the visualization platform; the back-e...


PUM


Abstract

The embodiment of the invention relates to the field of visualization, in particular to a data visualization method and device, and aims to solve the problem that a visualization model is not visual in the prior art. The method comprises the steps of obtaining a query condition, wherein the query condition comprises a table name of each data table needing to be visualized; presenting the table name of each data table in a first visualization mode; obtaining association conditions among the data tables; according to the association conditions, connecting the table names of the data tables in asecond visualization mode, and presenting the association conditions among the data tables in a third visualization mode; obtaining an attribute field of each data table and presenting the attribute field at the corresponding table name in a fourth visualization mode; and forming visual models. Due to the fact that the table names in the visual model, the connection relations between the table names, the association conditions between the tables and the attribute fields in the tables are presented in a visual mode, the formed visual model is more visual.

Description

technical field [0001] Embodiments of the present invention relate to the field of visualization, and in particular, to a method and device for data visualization. Background technique [0002] With the rapid development of visualization technology, visualization technology is more and more favored by users for its clear and intuitive data display, which is convenient for users to observe and analyze data in depth. In the prior art, the visualization technology is usually divided into three stages, the first stage is to obtain the data to be visualized; the second stage is to make a visualization model, and the third stage is to make a visualization report. [0003] In the prior art, when making a visualization model, it is usually realized through the next prompt operation on the configuration panel of the visualization tool, specifically: select the data source, select each data table in the data source; Association relations, association conditions of each data table, at...

Claims


Application Information

Patent Timeline
IPC IPC(8): G06F16/22G06F16/242G06F16/26
Inventor 吴迎俊
Owner CHINA MOBILE SUZHOU SOFTWARE TECH CO LTD
Why Eureka
Try Eureka