Visualization method and system for calculation results of efdc water quality model

A technology of calculation results and model calculations, applied in the field of information visualization, can solve problems such as low display efficiency, poor data security, and difficulty in achieving organic integration, and achieve the effect of convenient and efficient technical support

Active Publication Date: 2022-02-22
长江空间信息技术工程有限公司(武汉)
View PDF14 Cites 0 Cited by
  • Summary
  • Abstract
  • Description
  • Claims
  • Application Information

AI Technical Summary

Problems solved by technology

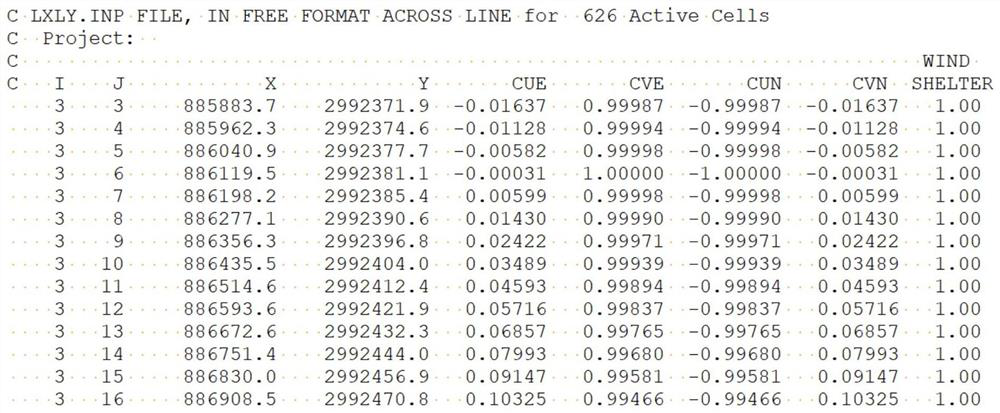
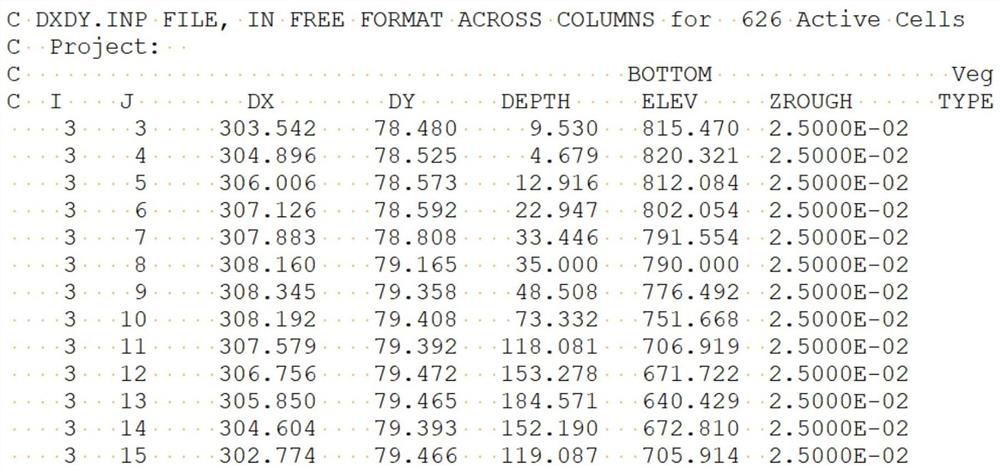
[0005] Usually, the output calculation results of the EFDC model are text files. From the perspective of software development, using text files for query and display is inefficient and poor in data security. From the perspective of software integration, the data structure of the EFDC model is different from that of the GIS system. It is difficult to realize the organic integration of the two

Method used


Image

  • Visualization method and system for calculation results of efdc water quality model
  • Visualization method and system for calculation results of efdc water quality model
  • Visualization method and system for calculation results of efdc water quality model

Examples


Embodiment Construction

[0046]The technical solutions in the embodiments of the present invention will be clearly and completely described below in conjunction with the accompanying drawings in the embodiments of the present invention. Obviously, the described embodiments are only some of the embodiments of the present invention, not all of them. Based on the embodiments of the present invention, all other embodiments obtained by persons of ordinary skill in the art without making creative efforts belong to the protection scope of the present invention.

[0047] In the description of the present invention, it should be noted that, unless otherwise specified and limited, terms should be understood in a broad sense. Those of ordinary skill in the art can understand the specific meanings of the above terms in the present invention in specific situations. In addition, the terms "first", "second", "S1", "S2", etc. are used for descriptive purposes only, and should not be understood as indicating or implyi...


PUM


Abstract

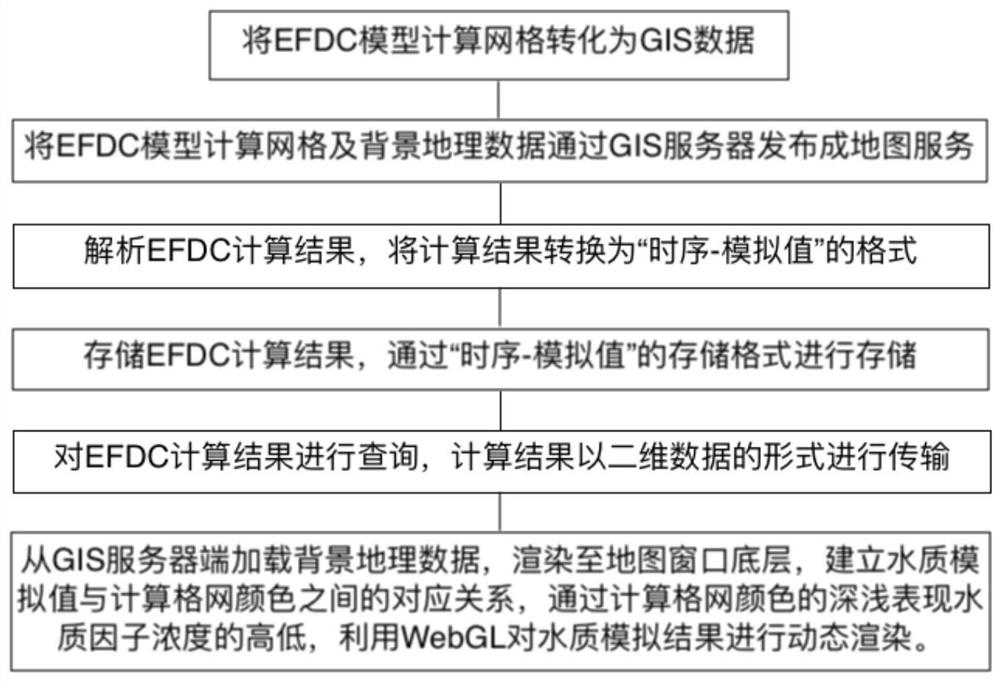
The invention provides a visualization method and system for the calculation result of the EFDC water quality model. The method includes: transforming the calculation grid of the EFDC model into GIS data; publishing the calculation grid of the EFDC model and the background geographic data as a map service through the GIS server; The simulated values ​​of all grids at a certain moment are stored in the database; the EFDC calculation results are queried, and the calculation results are transmitted in the form of two-dimensional data; the background geographic data is loaded from the GIS server, rendered to the bottom layer of the map window, and the water quality simulated value is established The corresponding relationship with the calculation grid color, the level of water quality factor concentration is expressed by calculating the depth of the grid color, and the water quality simulation results are dynamically rendered by using WebGL. Through this method, the efficient storage, query, transmission and WebGIS-based visual display of EFDC calculation results are realized.

Description

technical field [0001] The present disclosure relates to the field of information visualization, and proposes a visualization method and system for calculation results of EFDC water quality models. Background technique [0002] The EFDC (The Environmental Fluid Dynamics Code) model is funded by the U.S. Environmental Protection Agency and developed by Hamrick, the Virginia Institute of Oceanography. It is a model that integrates hydrodynamic modules, sediment modules, pollutant transport modules and water quality modules. It can be used for Includes 1D, 2D and 3D numerical simulations of lakes, reservoirs, bays, wetland estuaries and nearshore seas. After nearly 20 years of development and improvement, the model has been widely used in universities, government agencies and environmental consulting companies, and has been successfully used in the research of more than 100 water body regions in the United States and other European countries. It is used in water quality simula...

Claims


Application Information

Patent Timeline
Patent Type & Authority Patents(China)
IPC IPC(8): G06F16/29
CPCG06F16/29
Inventor 杨坤张力李晓飞宫留留范青松黄炎晟
Owner 长江空间信息技术工程有限公司(武汉)
Why Eureka
Try Eureka