Construction, forecasting method and device for traffic volume forecasting model in expressway service area
A technology of expressways and forecasting models, applied in forecasting, computing models, biological models, etc., can solve the problems of low prediction accuracy of models, achieve significant engineering practical application value, expand research dimensions, and improve prediction accuracy
- Summary
- Abstract
- Description
- Claims
- Application Information
AI Technical Summary
Problems solved by technology
Method used
Image
Examples
Embodiment 1
[0090] In this embodiment, a method for constructing a traffic volume prediction model in an expressway service area is provided, and the method is performed according to the following steps:
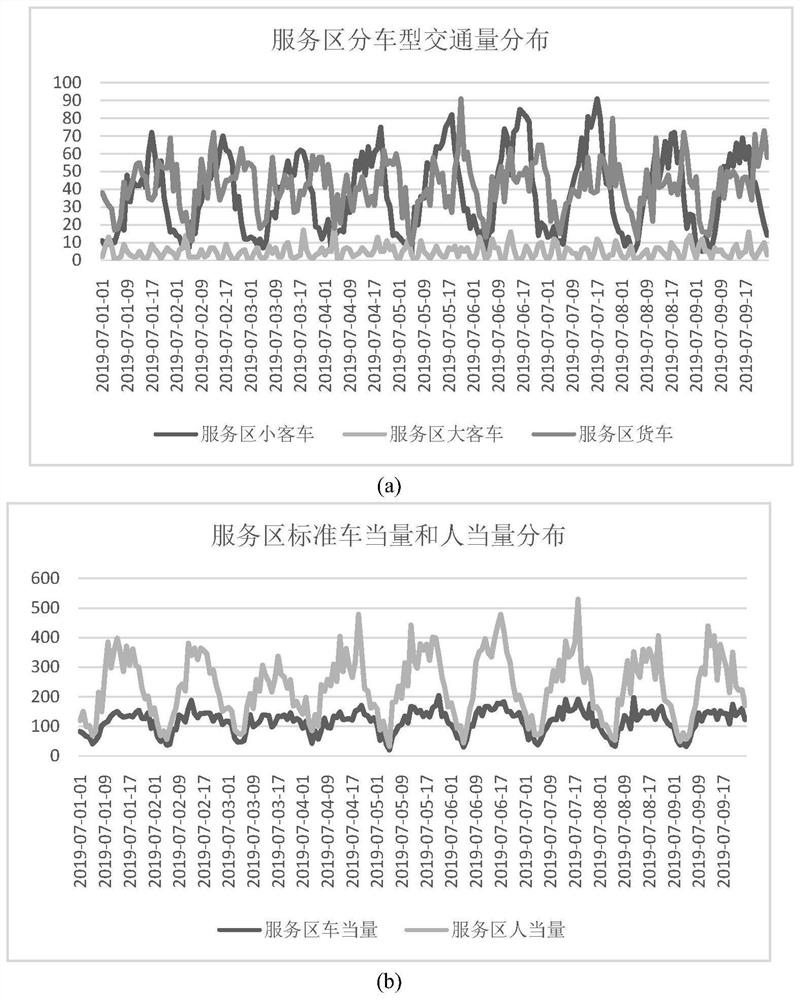
[0091] Step 1, obtain multiple groups of traffic volume data in the service area, the traffic volume data in the service area include the hourly traffic volume of passenger cars in the service area, the hourly traffic volume of large passenger cars in the service area, and the hourly traffic volume of trucks in the service area;
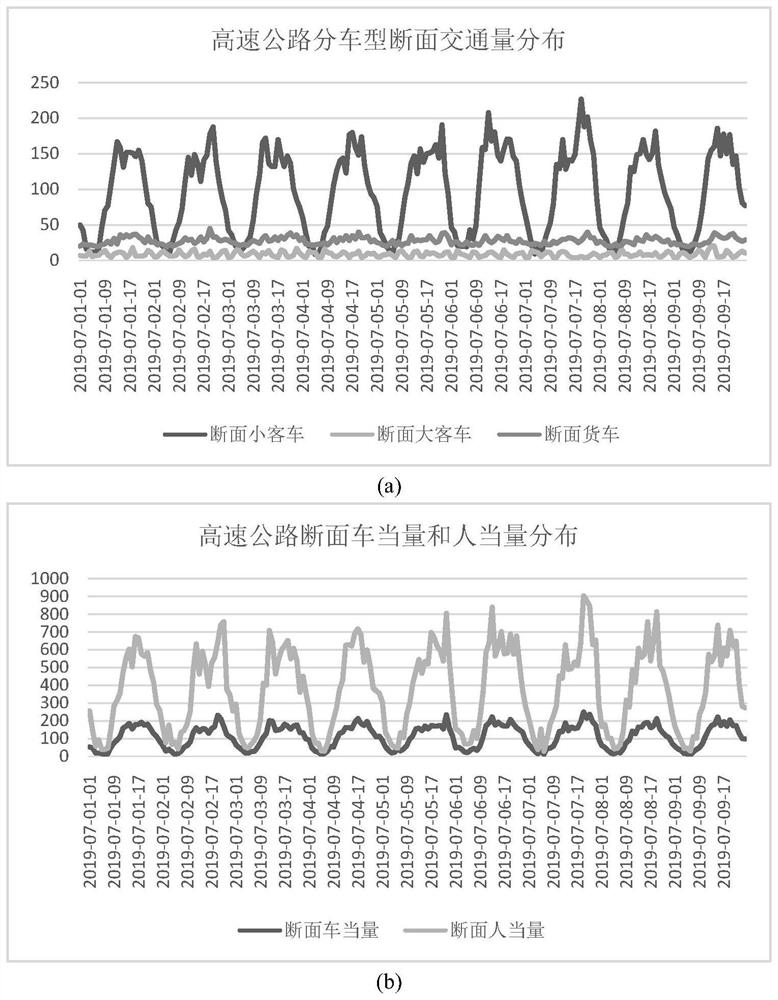
[0092] Obtain the expressway section traffic volume data corresponding to each set of service area traffic volume data, and obtain multiple sets of expressway section traffic volume data. The hourly traffic flow of coaches in the section and the hourly traffic flow of trucks in the section of the expressway;
[0093] In this embodiment, the original traffic volume data of the service area and the corresponding expressway section are obtained from the service a...
example
[0122] The calculation example is as follows:
[0123] When the flow of small passenger cars is 17, the flow of large passenger cars is 9, and the flow of trucks is 9 in a certain hour, the vehicle equivalent and the person equivalent are calculated as:
[0124] Vehicle equivalent=17×1.0+9×1.5+9×3.0=57.5
[0125] Human equivalent = 17×3.3+9×46.0+9×2.1=489
[0126] Step 3. Use the service area vehicle equivalent and service area person equivalent corresponding to the rth group of service area traffic data and the rth group of service area traffic data as the rth label data, r=1,2,...,R, R is a positive integer;
[0127] Repeat this step until R label data are obtained, and a label set is obtained;
[0128] Step 4. Take the expressway section vehicle equivalent and expressway section person equivalent corresponding to the jth group of expressway section traffic data and the ith group of expressway section traffic data as the jth sample data, j=1, 2, ... ..., J, J are positiv...
Embodiment 2
[0173] A method for predicting traffic volume in an expressway service area, the method is performed according to the following steps:
[0174] Step A: Collect the traffic volume data of the expressway section corresponding to the service area to be predicted, and obtain the data to be predicted;
[0175] Step B: Input the to-be-predicted data into the prediction model constructed by the method for constructing the traffic volume prediction model in the expressway service area in the first embodiment, and obtain the traffic volume in the expressway service area to be predicted.
[0176] In this embodiment, as Image 6 shown, Image 6 It is the comparison of the accuracy of the forecast results of traffic volume in the service area by different models. It can be seen that Image 6 Consistent with the results in Table 2, the improved particle swarm algorithm combined with XGBoost's traffic volume prediction method in the expressway service area proposed by the present inventio...
PUM
 Abstract
Description
Claims
Application Information
 - R&D
- Intellectual Property
- Life Sciences
- Materials
- Tech Scout
- Unparalleled Data Quality
- Higher Quality Content
- 60% Fewer Hallucinations
Browse by: Latest US Patents, China's latest patents, Technical Efficacy Thesaurus, Application Domain, Technology Topic, Popular Technical Reports.
© 2025 PatSnap. All rights reserved.Legal|Privacy policy|Modern Slavery Act Transparency Statement|Sitemap|About US| Contact US: help@patsnap.com


