Jsmd-based analysis display method

A technology for displaying graphs and data. Applied in the field of data display, it can solve problems such as inability to dig and analyze in-depth reasons, insufficient systematic and comprehensive analysis of displayed, and poor compatibility with IE browsers.

Pending Publication Date: 2022-07-26
北京资采信息技术有限公司
View PDF0 Cites 0 Cited by
  • Summary
  • Abstract
  • Description
  • Claims
  • Application Information

AI Technical Summary

Problems solved by technology

[0003] 1. Baidu open source ECHARTS display component, Echarts is free, open source, cool screen, attractive, and its own advantages, but relatively more bugs, the corresponding API is not as rich as hcharts, and the compatibility with browsers is not good, Especially the compatibility with IE browser is not good;
[0004] 2. Google's open source HCHARTS display component, Hcharts has detailed documents, reasonable content, good compatibility, low learning cost, rich chart components, relatively complete interface API, and good browser compatibility, relatively few bugs, but it is foreign software, and charges;
[0006] However, the existing display method still has certain defects. 1. The existing technology can only display the charts of macro key indicators, and cannot dig and analyze the deep-seated reasons. Even through the drill-down of the charts, the displayed analysis is not enough Systematic and comprehensive; 2. The current mainstream analysis systems use exploratory interactive analysis to locate problems in business support, and it is difficult for users to locate the main reasons for the business operation process in one step; 3. Simple chart data display and chart Linkage drill-down cannot solve the core problems of business analysis

Method used


Image

  • Jsmd-based analysis display method
  • Jsmd-based analysis display method
  • Jsmd-based analysis display method

Examples


Embodiment Construction

[0040] Below, in conjunction with the accompanying drawings and specific embodiments, the invention is further described:

[0041] According to an embodiment of the present invention, a jsmind-based analysis and presentation method is provided.

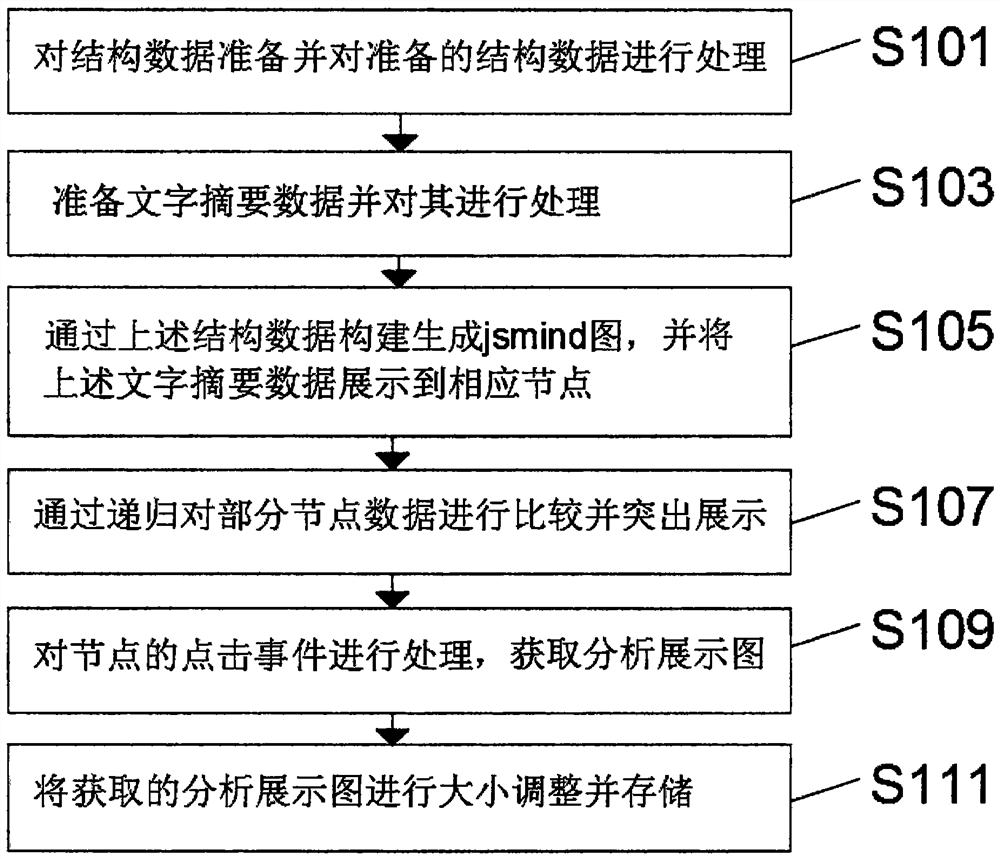
[0042] like figure 1 As shown, the jsmind-based analysis and presentation method according to the embodiment of the present invention includes the following steps:

[0043] Step S101, preparing the structural data and processing the prepared structural data;

[0044] Step S103, prepare text summary data and process it;

[0045] Step S105, constructing and generating a jsmind graph through the above-mentioned structural data, and displaying the above-mentioned text abstract data to the corresponding nodes;

[0046] Step S107, compare and highlight some node data by recursion;

[0047] Step S109, processing the click event of the node to obtain an analysis display graph;

[0048] Step S111, resizing and storing the acquired analysi...


PUM


Abstract

The invention discloses a display method based on jsmd analysis. The method comprises the following steps: preparing structural data and processing the prepared structural data; preparing text abstract data and processing the text abstract data; constructing and generating a jsmd graph through the structural data, and displaying the text abstract data to corresponding nodes; comparing and highlighting partial node data through recursion; processing click events of the nodes to obtain an analysis display graph; and adjusting the size of the obtained analysis display graph and storing the analysis display graph. The method has the beneficial effects that compared with traditional analysis chart data display, the jsmd provides overall framed analysis display, compared with a traditional subdivided report, the jsmd node has an independent analysis page, node data can be brought into exploration type interaction analysis for deep analysis, the Jsmd data node can be flexibly customized and configured, and the data analysis efficiency is improved. And mapping nodes and data can be flexibly configured through a background.

Description

technical field [0001] The invention relates to the technical field of data display, in particular to a jsmind-based analysis and display method. Background technique [0002] In today's era of big data, it is particularly important to digitize the business of an enterprise. As a leader of an enterprise, we must always pay attention to the key indicators of the digitization of the enterprise's business, which is of vital significance to management decision-making and corporate strategy. , Most of the data analysis is based on the display results of charts and tables to make decisions, and the analysis and display of key business indicators are carried out on the PC side in the form of maps. Configurable analysis and display based on jsmind is one of the best analysis and display methods. The more conventional display methods are as follows: [0003] 1. Baidu open source ECHARTS display component, Echarts is free, open source, cool screen, has certain attractiveness, and its...

Claims


Application Information

Patent Timeline
Patent Type & Authority Applications(China)
IPC IPC(8): G06F40/14G06T11/20
CPCG06F40/14G06T11/206
Inventor 苏小东孙冰孙奇于欢
Owner 北京资采信息技术有限公司
Why Eureka
Try Eureka