Computer-implemented node spreader

a spreader and computer technology, applied in computing, instruments, drawing from basic elements, etc., can solve the problems of edge edges, nodes, and space available, and achieve the effect of reducing the amount of space available, and reducing the number of nodes

Inactive Publication Date: 2002-11-07
SAS INSTITUTE
View PDF9 Cites 15 Cited by
  • Summary
  • Abstract
  • Description
  • Claims
  • Application Information

AI Technical Summary

Problems solved by technology

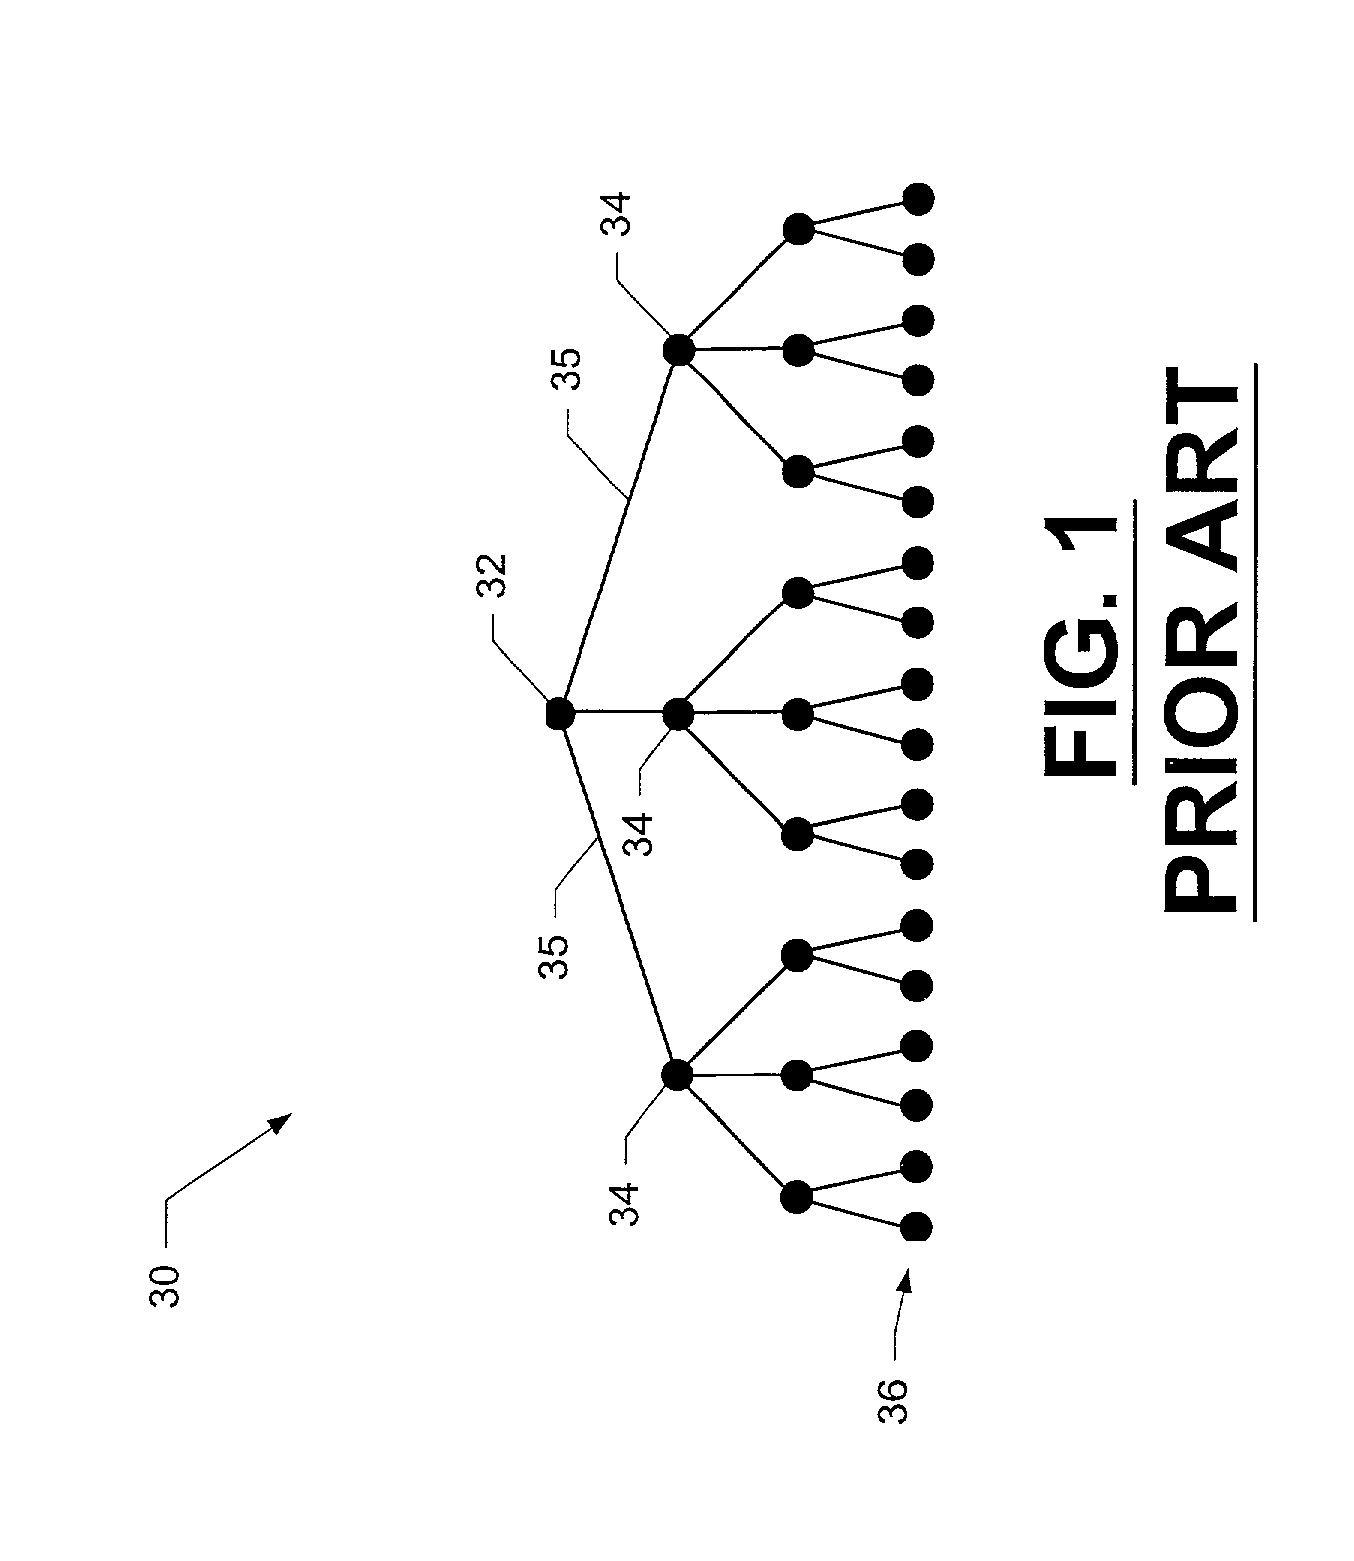
In the field of computer graphical user interfaces (GUIs), there is competition between the amount of space available for representing data and the usability of the interface to be produced.
A difficulty with the 2D tree approach is the size of the graph.
While it is possible to represent the 2D tree with hundreds of nodes so that all nodes are visible, the size of the edges and nodes make this 2D tree effectively useless for many applicatio

Method used


Image

  • Computer-implemented node spreader
  • Computer-implemented node spreader
  • Computer-implemented node spreader

Examples


Embodiment Construction

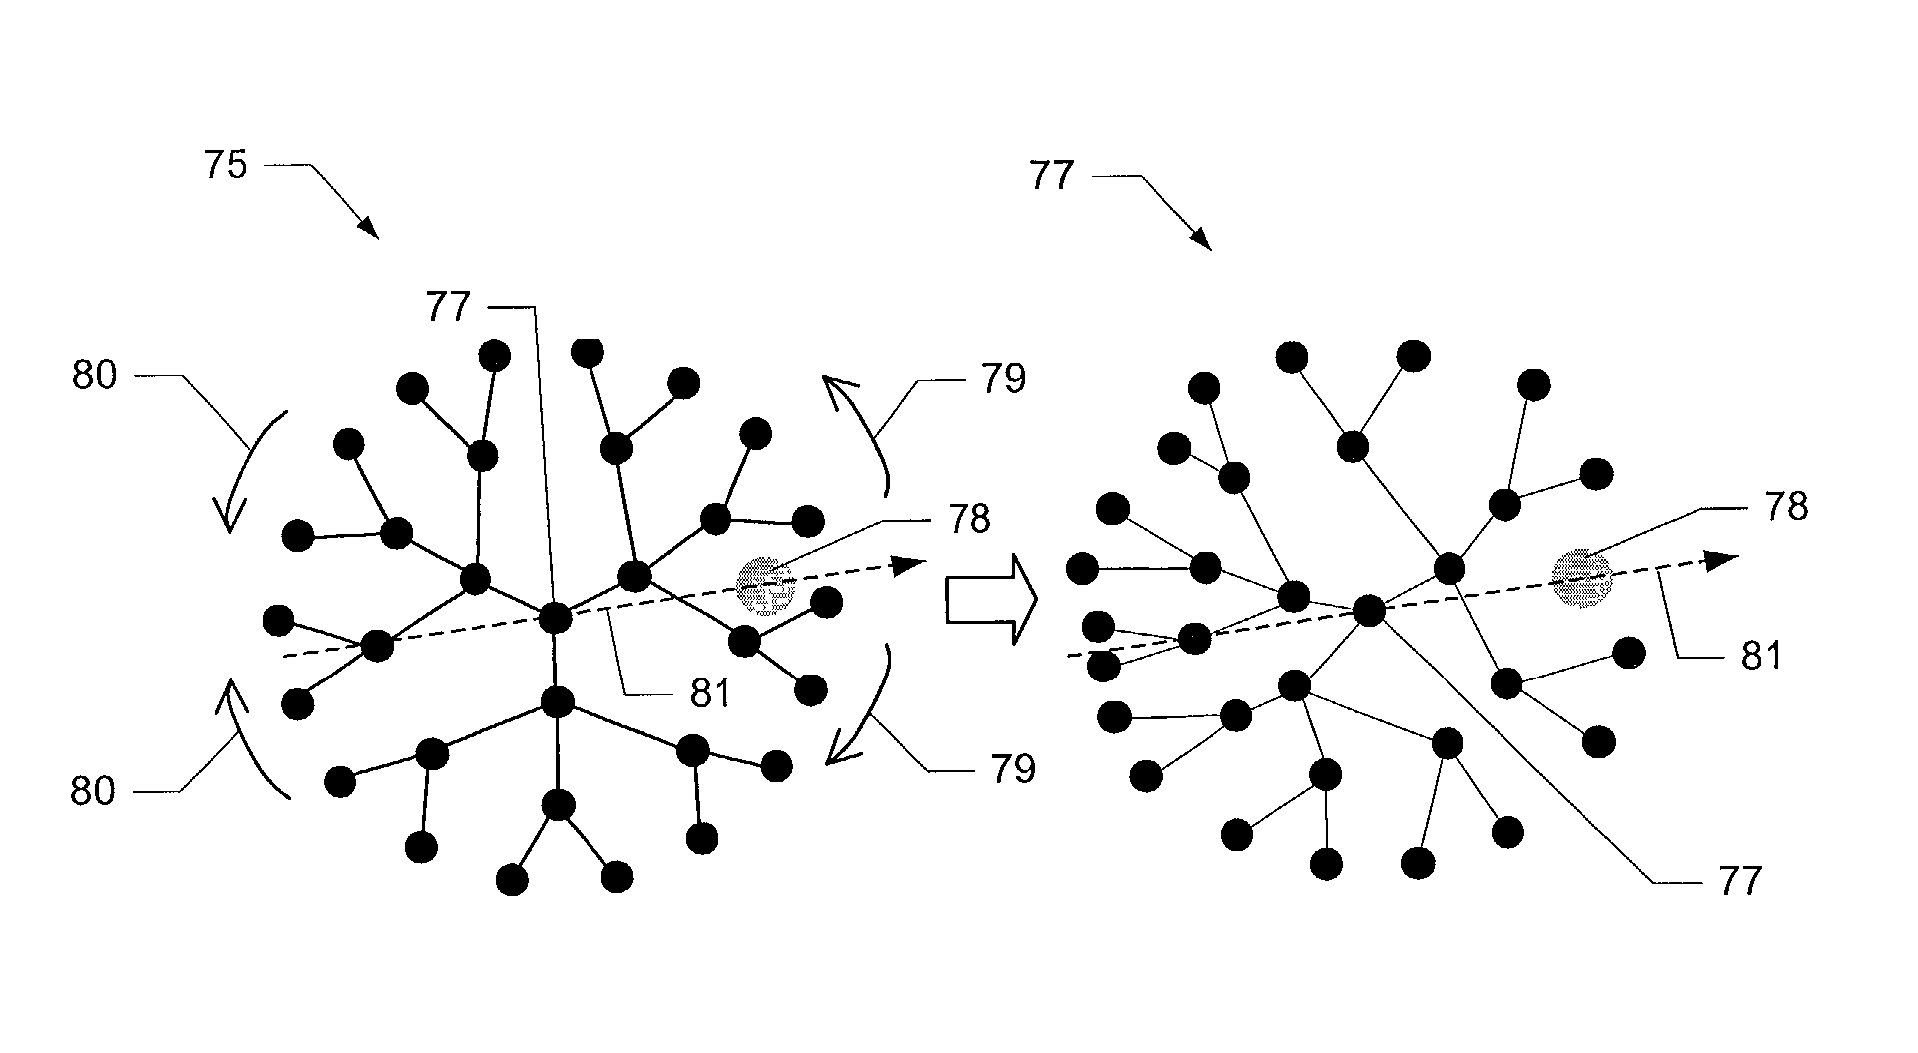
[0050] Consider three nodes (A 182, B 184, and C 186) and a focus point F 180 as shown in FIG. 9. Assume the following values: A={0.985, 0.174}; B={0.0, 1.0}; C={-0.530, 0.530}; F={0.5, 0.0}; fac=10 (which is a user-supplied value for maximum angular distortion).

[0051] The calculation of the distortion strength factor, dt, may be done before looping through the nodes in the following manner. With the x and y values for the focus position known (that is, fx=0.5 and fy=0.0), the distortion strength is:

dt=fac*sqrt(fx*fx+fy*fy)

dt=10*sqrt(0.5*0.5+0*0)

dt=10*0.5

dt=5

[0052] The focus angle may be calculated as:

focustheta=atan(fy,fx)

focustheta=atan(0.0, 0.5)

focustheta=0.degree.

[0053] Now, consider node A. Here tx=0.985 and ty=0.174. The original theta angle of node A is:

theta=atan(ty,tx)

theta=atan(0.174, 0.985)

theta=5.degree.

[0054] The relative theta angle value is calculated as:

reltheta=(theta-focustheta) / 180

reltheta=(5-0) / 180

reltheta=(5 / 180)

reltheta=0.028

[0055] Now the distortion function i...


PUM


Abstract

A computer-implemented method and system for displaying nodes on a display device. First positions are used for locating a first node and a second node on the display device. The first node and second node are separated from each other and are at least substantially equidistant from a predetermined center position. Second positions are determined for the first node and second node such that angular shift of the first node from its first position to its second position is different in magnitude than angular shift of the second node from its first position to its second position. These angular shifts for the first node and second node are with respect to the center position. The first node and second node are displayed on the display device based upon the determined second positions for the first node and second node.

Description

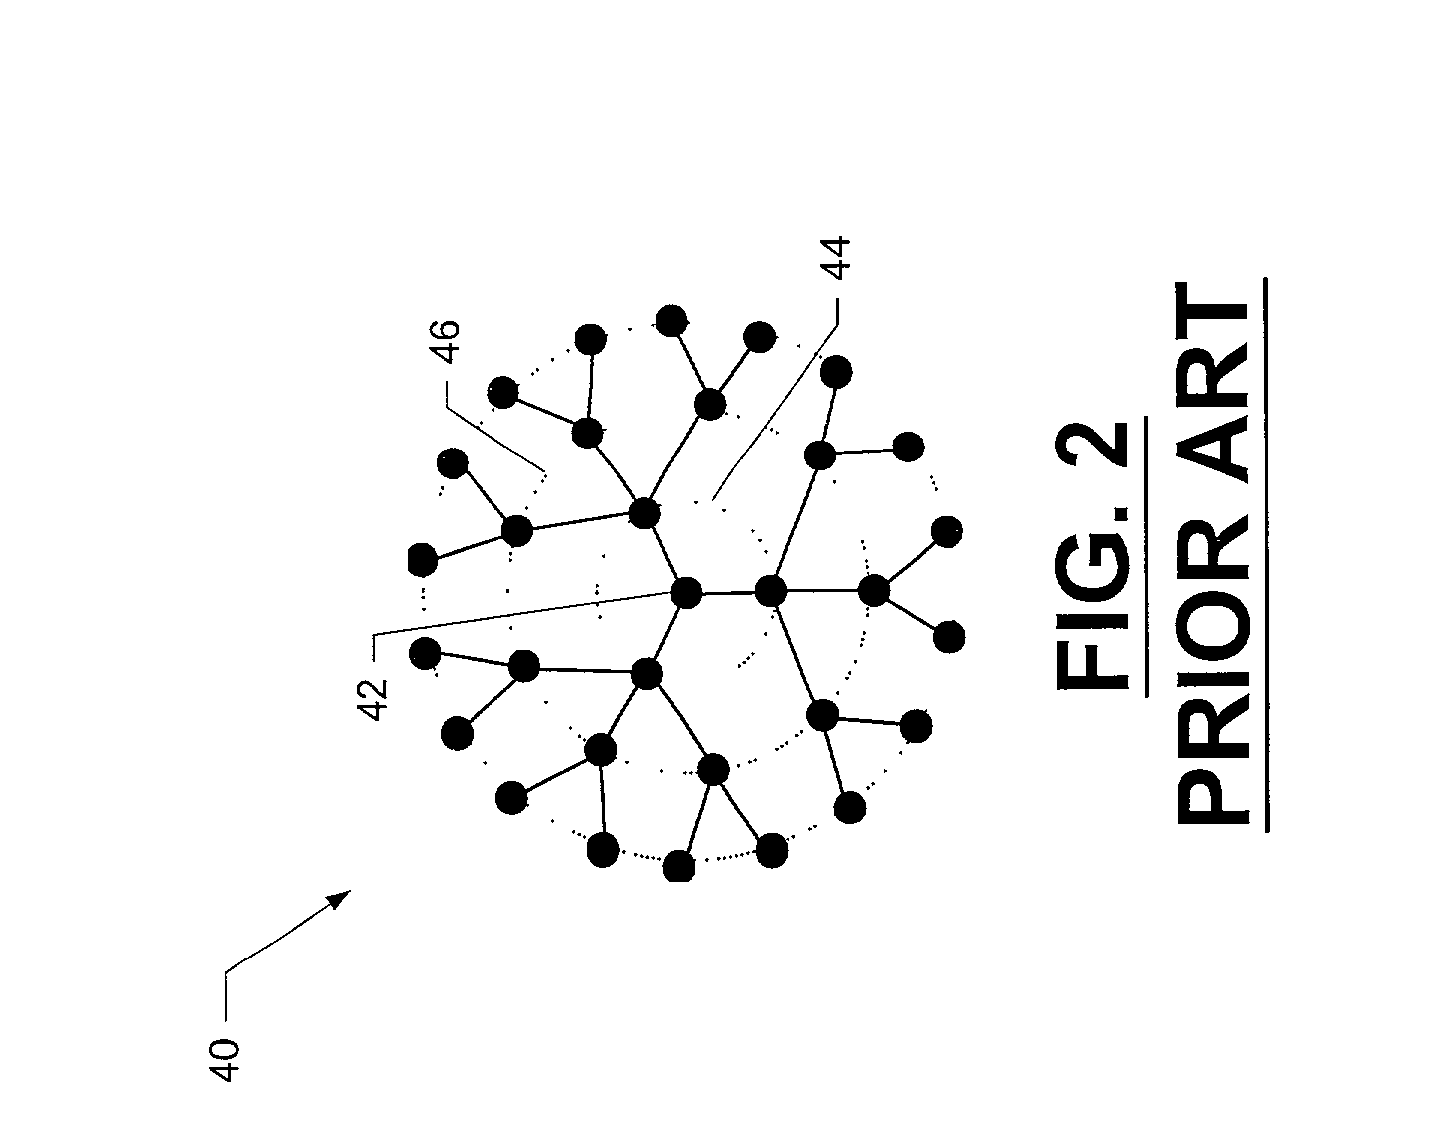
[0001] 1. Technical Field[0002] The present invention is related to the field of computer graphical user interfaces, and more particularly to computer graphical user interfaces for visualizing and manipulating nodes.[0003] 2. Description of Related Art[0004] In the field of computer graphical user interfaces (GUIs), there is competition between the amount of space available for representing data and the usability of the interface to be produced. In representing hierarchical data, this competition is extremely important because the user of this data gains important information not only from the data itself, but also from the relationships between the data.[0005] FIG. 1 depicts at 30 a traditional representation of hierarchical data called a 2D tree. This structure consists of a plurality of tree nodes connected by a plurality of edges. For example, parent node 32 connects to one or more child nodes 34 via edges 35. The tree ultimately terminates at leaf nodes 36. A difficulty with th...

Claims


Application Information

Patent Timeline
IPC IPC(8): G06T11/20
CPCG06T11/206
Inventor LOOMIS, JEREMY JOHNYAKOWENKO, JYOTI
Owner SAS INSTITUTE
Why Eureka
Try Eureka