System and method for generating custom hierarchies in an analytical data structure
a data structure and hierarchical structure technology, applied in multi-dimensional databases, data acquisition and logging, instruments, etc., can solve the problems of inability to change the organizational structure of the various data hierarchies in the cube by an analyst, the inability to sort and view the data contained in the cube, and the limited options for querying and querying
- Summary
- Abstract
- Description
- Claims
- Application Information
AI Technical Summary
Problems solved by technology
Method used
Image
Examples
example 1
FIG. 2
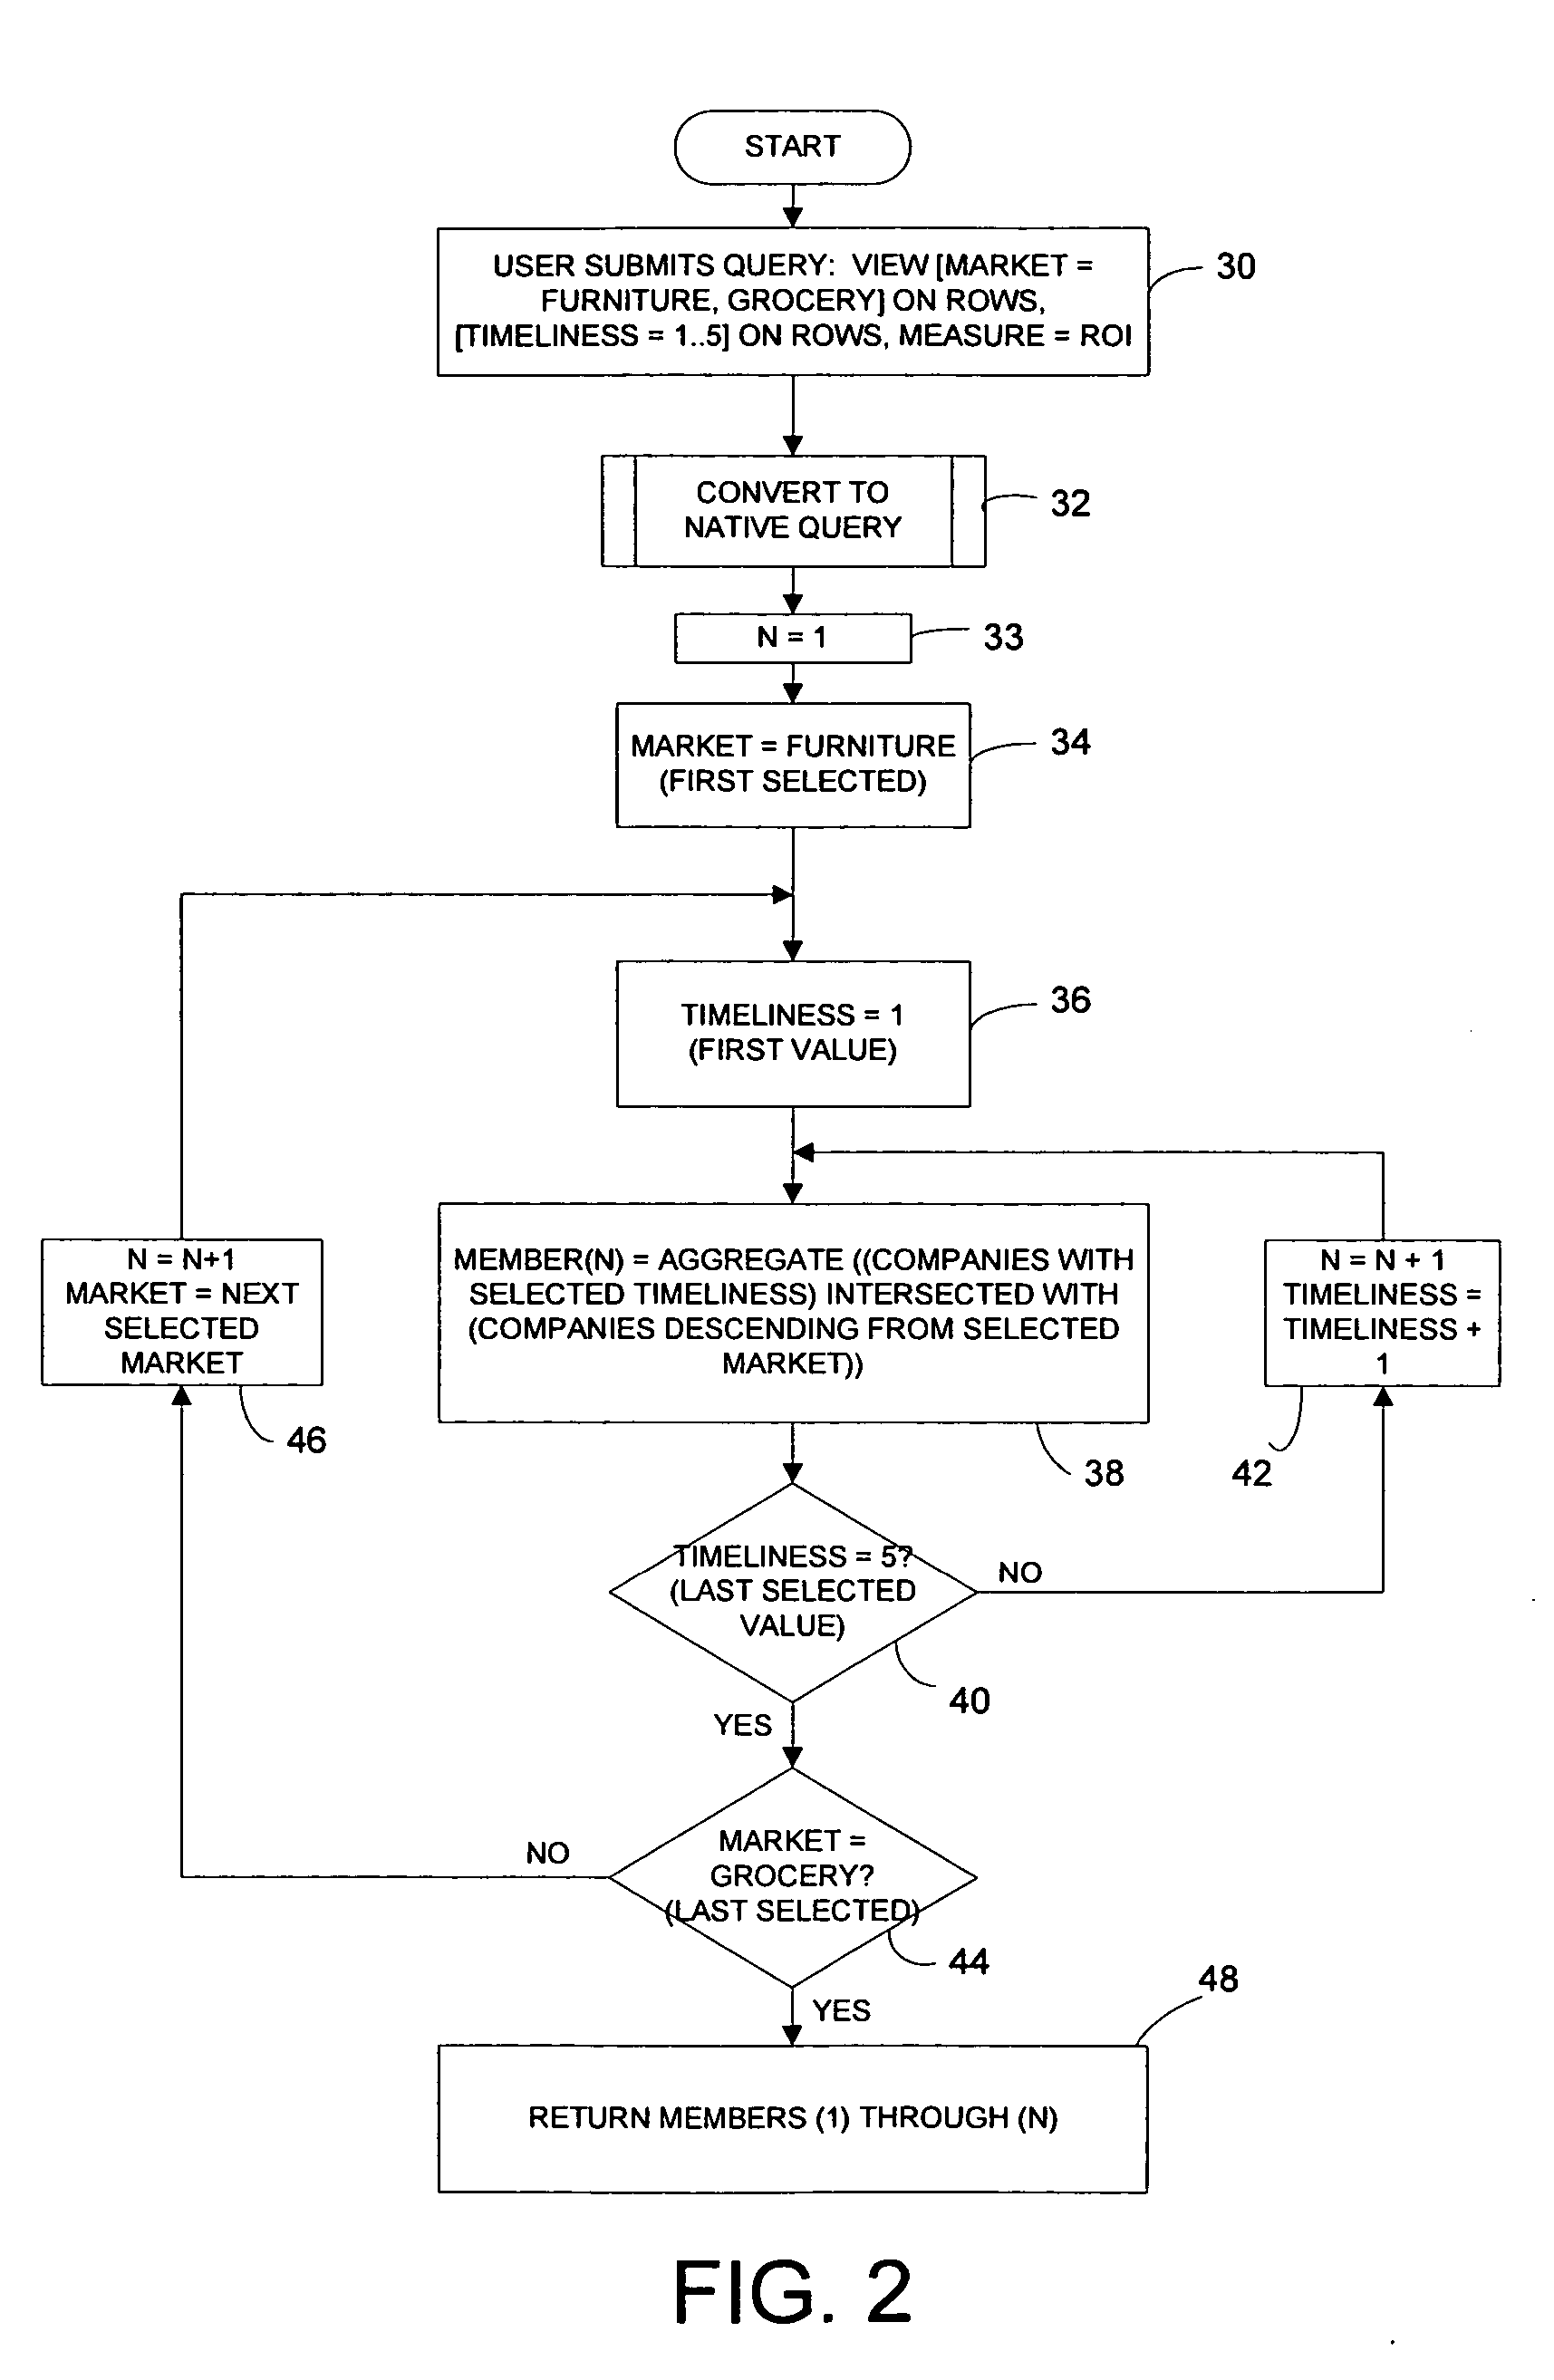
[0016] In this example, illustrated in the flow diagram of FIG. 2, the user submits a query to view the timeliness data associated with selected markets (Furniture and Grocery). Specifically, the query specifies that timeliness data be viewed on the rows (a foreground axis) of an output view, grouped by market also viewed on the rows (the same foreground axis).
[0017] As indicated at step 30 of FIG. 2, the custom query submitted by the user can be expressed as follows: View [Market=Furniture, Grocery] on rows, [Timeliness=1.5] on rows. The members of the native company hierarchy that are selected are Furniture and Grocery, and these members are groups of leaf-level members (companies) rather than leaf-level members themselves. The custom hierarchy is Timeliness, which is an attribute rather than a hierarchy in the originally defined native cube. The custom hierarchy software converts this query to a native query, with calculated members being placed on the rows axis in the nat...
example 2
FIG. 3
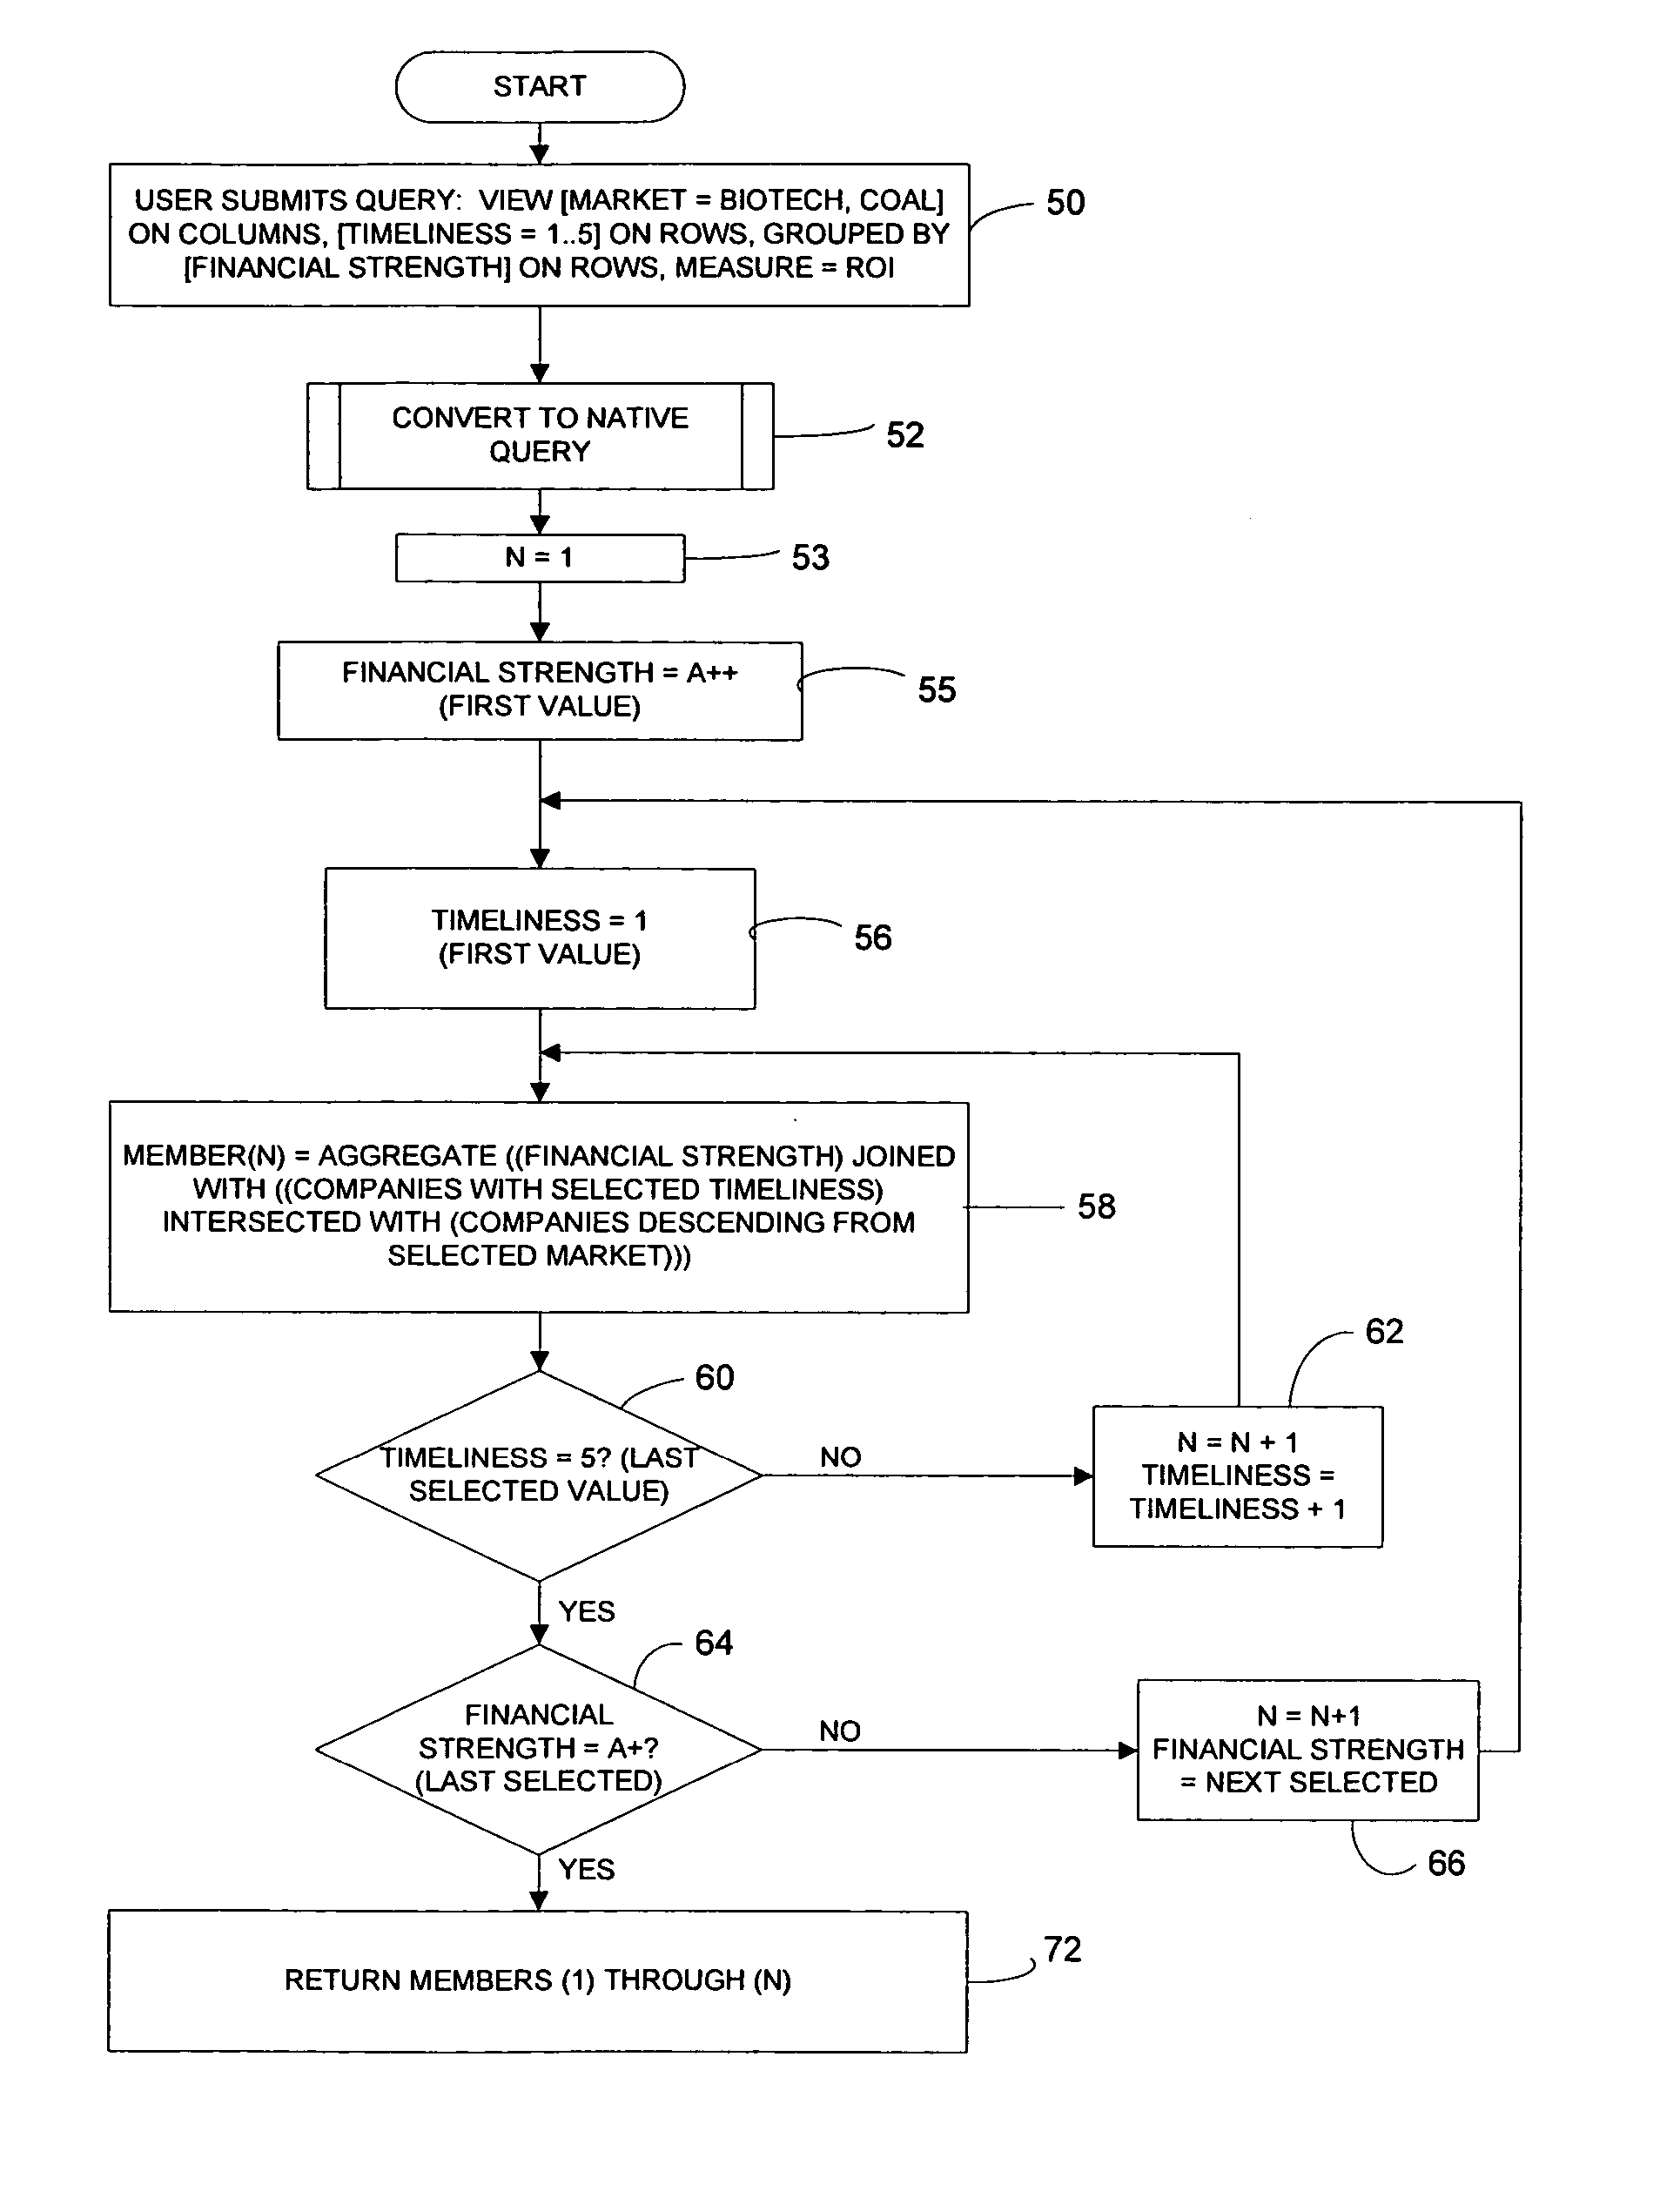
[0020] In this example, illustrated in the flow diagram of FIG. 3, the user submits a query to view the timeliness data associated with selected markets (Biotech and Coal) grouped by financial strength (A+, A++). Specifically, the query specifies that the timeliness data be viewed on the rows (a foreground axis) of an output view, grouped by market on the columns (a different foreground axis) and further grouped by financial strength on the rows (the same foreground axis).
[0021] As indicated at step 50 of FIG. 3, the custom query submitted by the user can be expressed as follows: View [Market=Biotech, Coal] on columns, [Timeliness=1.5] on rows, grouped by [Financial Strength=A++, A+] on rows. The custom hierarchy software converts this query to a native query. In this scenario, a calculated member is created for each row. The formula for each member will include logic for both the financial strength selection and the timeliness selection. These members are defined to be in th...
example 3
FIG. 4
[0024] In this example, illustrated by the flow diagram of FIG. 4, the user submits a query to view the timeliness data associated with selected markets (Biotech and Coal). Specifically, the query specifies that timeliness data be viewed on the rows (a foreground axis) of an output view, sorted by market viewed on the columns (a different foreground axis). The custom hierarchy (timeliness) is therefore on an axis by itself.
[0025] As indicated at step 80 of FIG. 4, the custom query submitted by the user can be expressed as follows: View [Market=Biotech, Coal] on columns, [Timeliness=1.5] on rows. The custom hierarchy software converts this query to a native query, resulting in the user viewing the cube as having the following format (although the native cube definition itself remains unchanged):
TABLE 6Hierarchy / DimensionLevelsAttributes / MeasuresCompany HierarchyAllTimeliness (1 . . . 5)>Market (Furniture,Grocery, Biotech,Coal, . . . )>>CompanyFinancial StrengthAll>Strength (...
PUM
 Abstract
Description
Claims
Application Information
 - R&D
- Intellectual Property
- Life Sciences
- Materials
- Tech Scout
- Unparalleled Data Quality
- Higher Quality Content
- 60% Fewer Hallucinations
Browse by: Latest US Patents, China's latest patents, Technical Efficacy Thesaurus, Application Domain, Technology Topic, Popular Technical Reports.
© 2025 PatSnap. All rights reserved.Legal|Privacy policy|Modern Slavery Act Transparency Statement|Sitemap|About US| Contact US: help@patsnap.com


