Market visualisation tool

a visualisation tool and market technology, applied in the computer field, can solve the problems of not having the capacity for many different visual display devices, not having access to multiple screen views, and large data rang

Inactive Publication Date: 2005-06-30
JOHNSON OLIVER ASHBY
View PDF0 Cites 53 Cited by
  • Summary
  • Abstract
  • Description
  • Claims
  • Application Information

AI Technical Summary

Benefits of technology

[0012] Specific embodiments according to the present invention aim to provide a means by which a human user can visualize levels of activity across a wide range of markets and therefore to enable any significant movements of capital flow from one market to another or between a plurality of markets to be quickly identified.
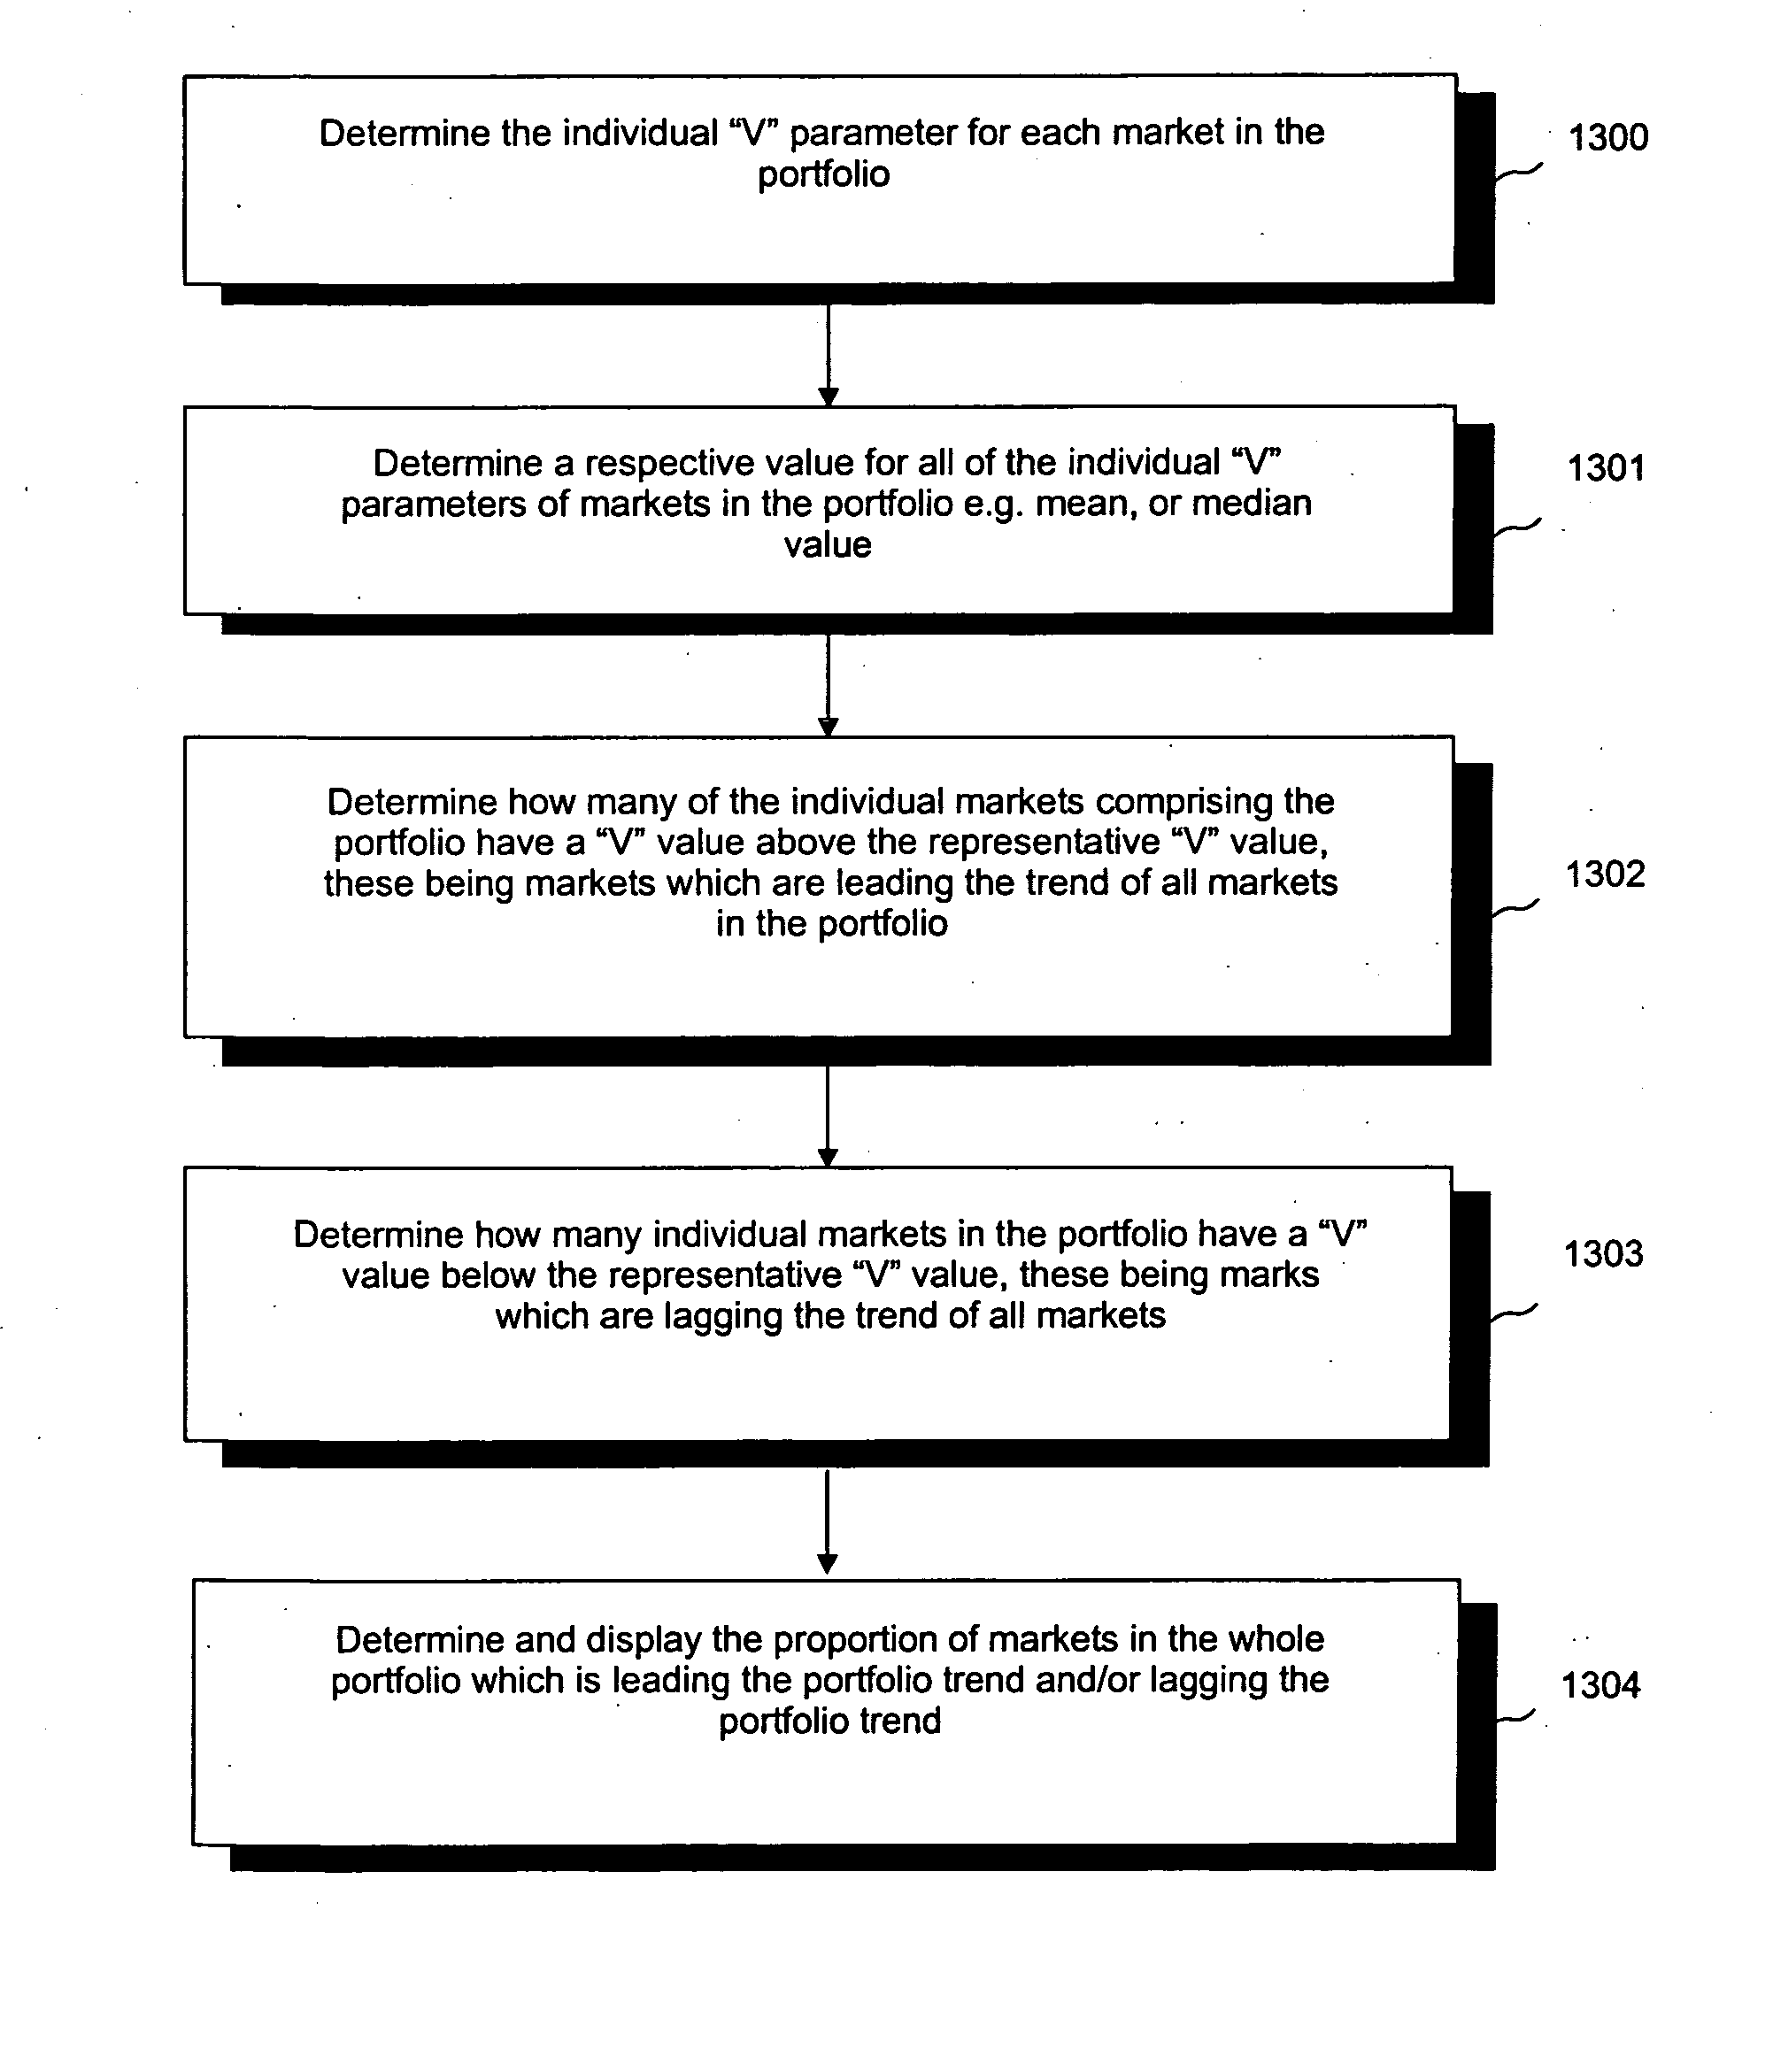
[0013] Specific embodiments herein also aim to provide a human user with a means for comparing a plurality of diverse markets on the basis of a unifying parameter which can be applied individually to each market, and thereby, by making a comparison of individual values for the unifying parameter, a direct relative comparison between a plurality of individual markets can be made.

Problems solved by technology

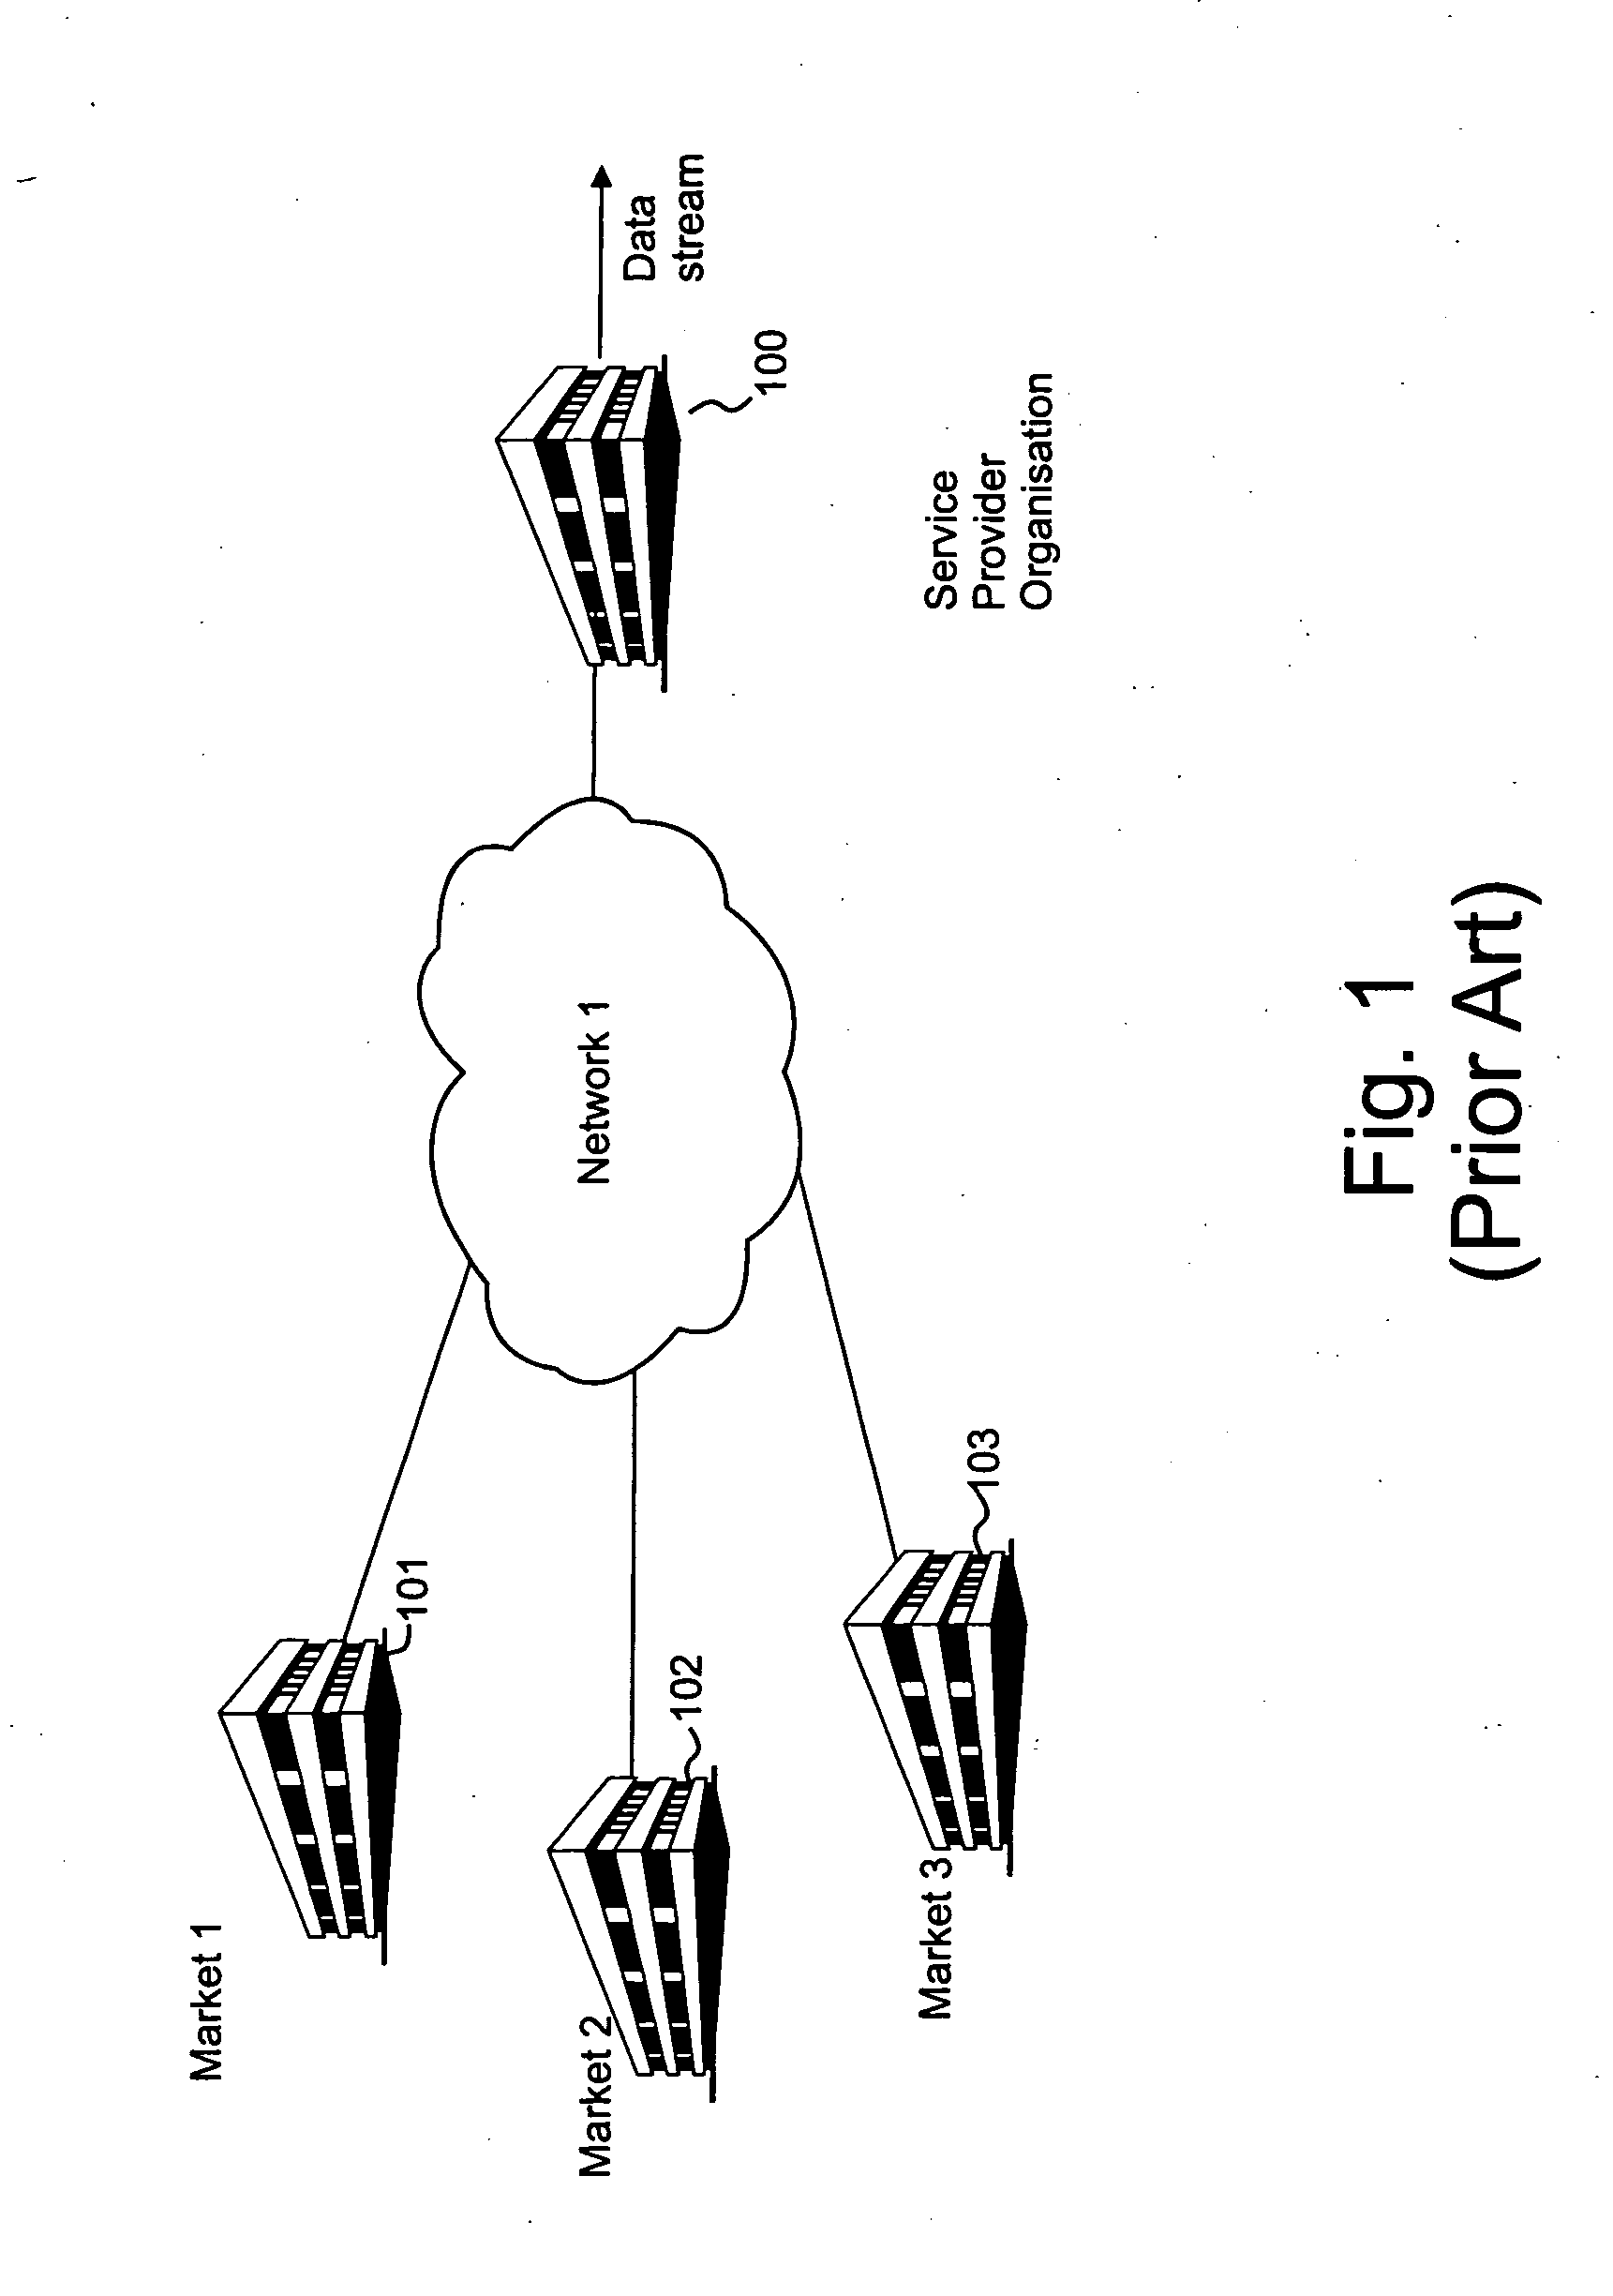
However, the range of data available is vast, and there are many markets throughout the world.
Human traders and analysts are always looking for unusual movements in markets, which may represent profitable trading opportunities, however, it is not immediately obvious from the wide range of data available in conventional screen displays which markets are moving in an unusual pattern of behavior, or where there exists a significant amount of activity compared to the normal level of activity.
Due to the small size of individual trading screens, presenting a large amount of information over a diverse range of individual markets presents a technical problem of condensing the data and information concerning those markets into an abstract summary form which can be presented on a single screen.
Such devices present only a single screen, and do not have the capacity for many different visual display devices as found on a conventional professional trading desk at a financial institution.
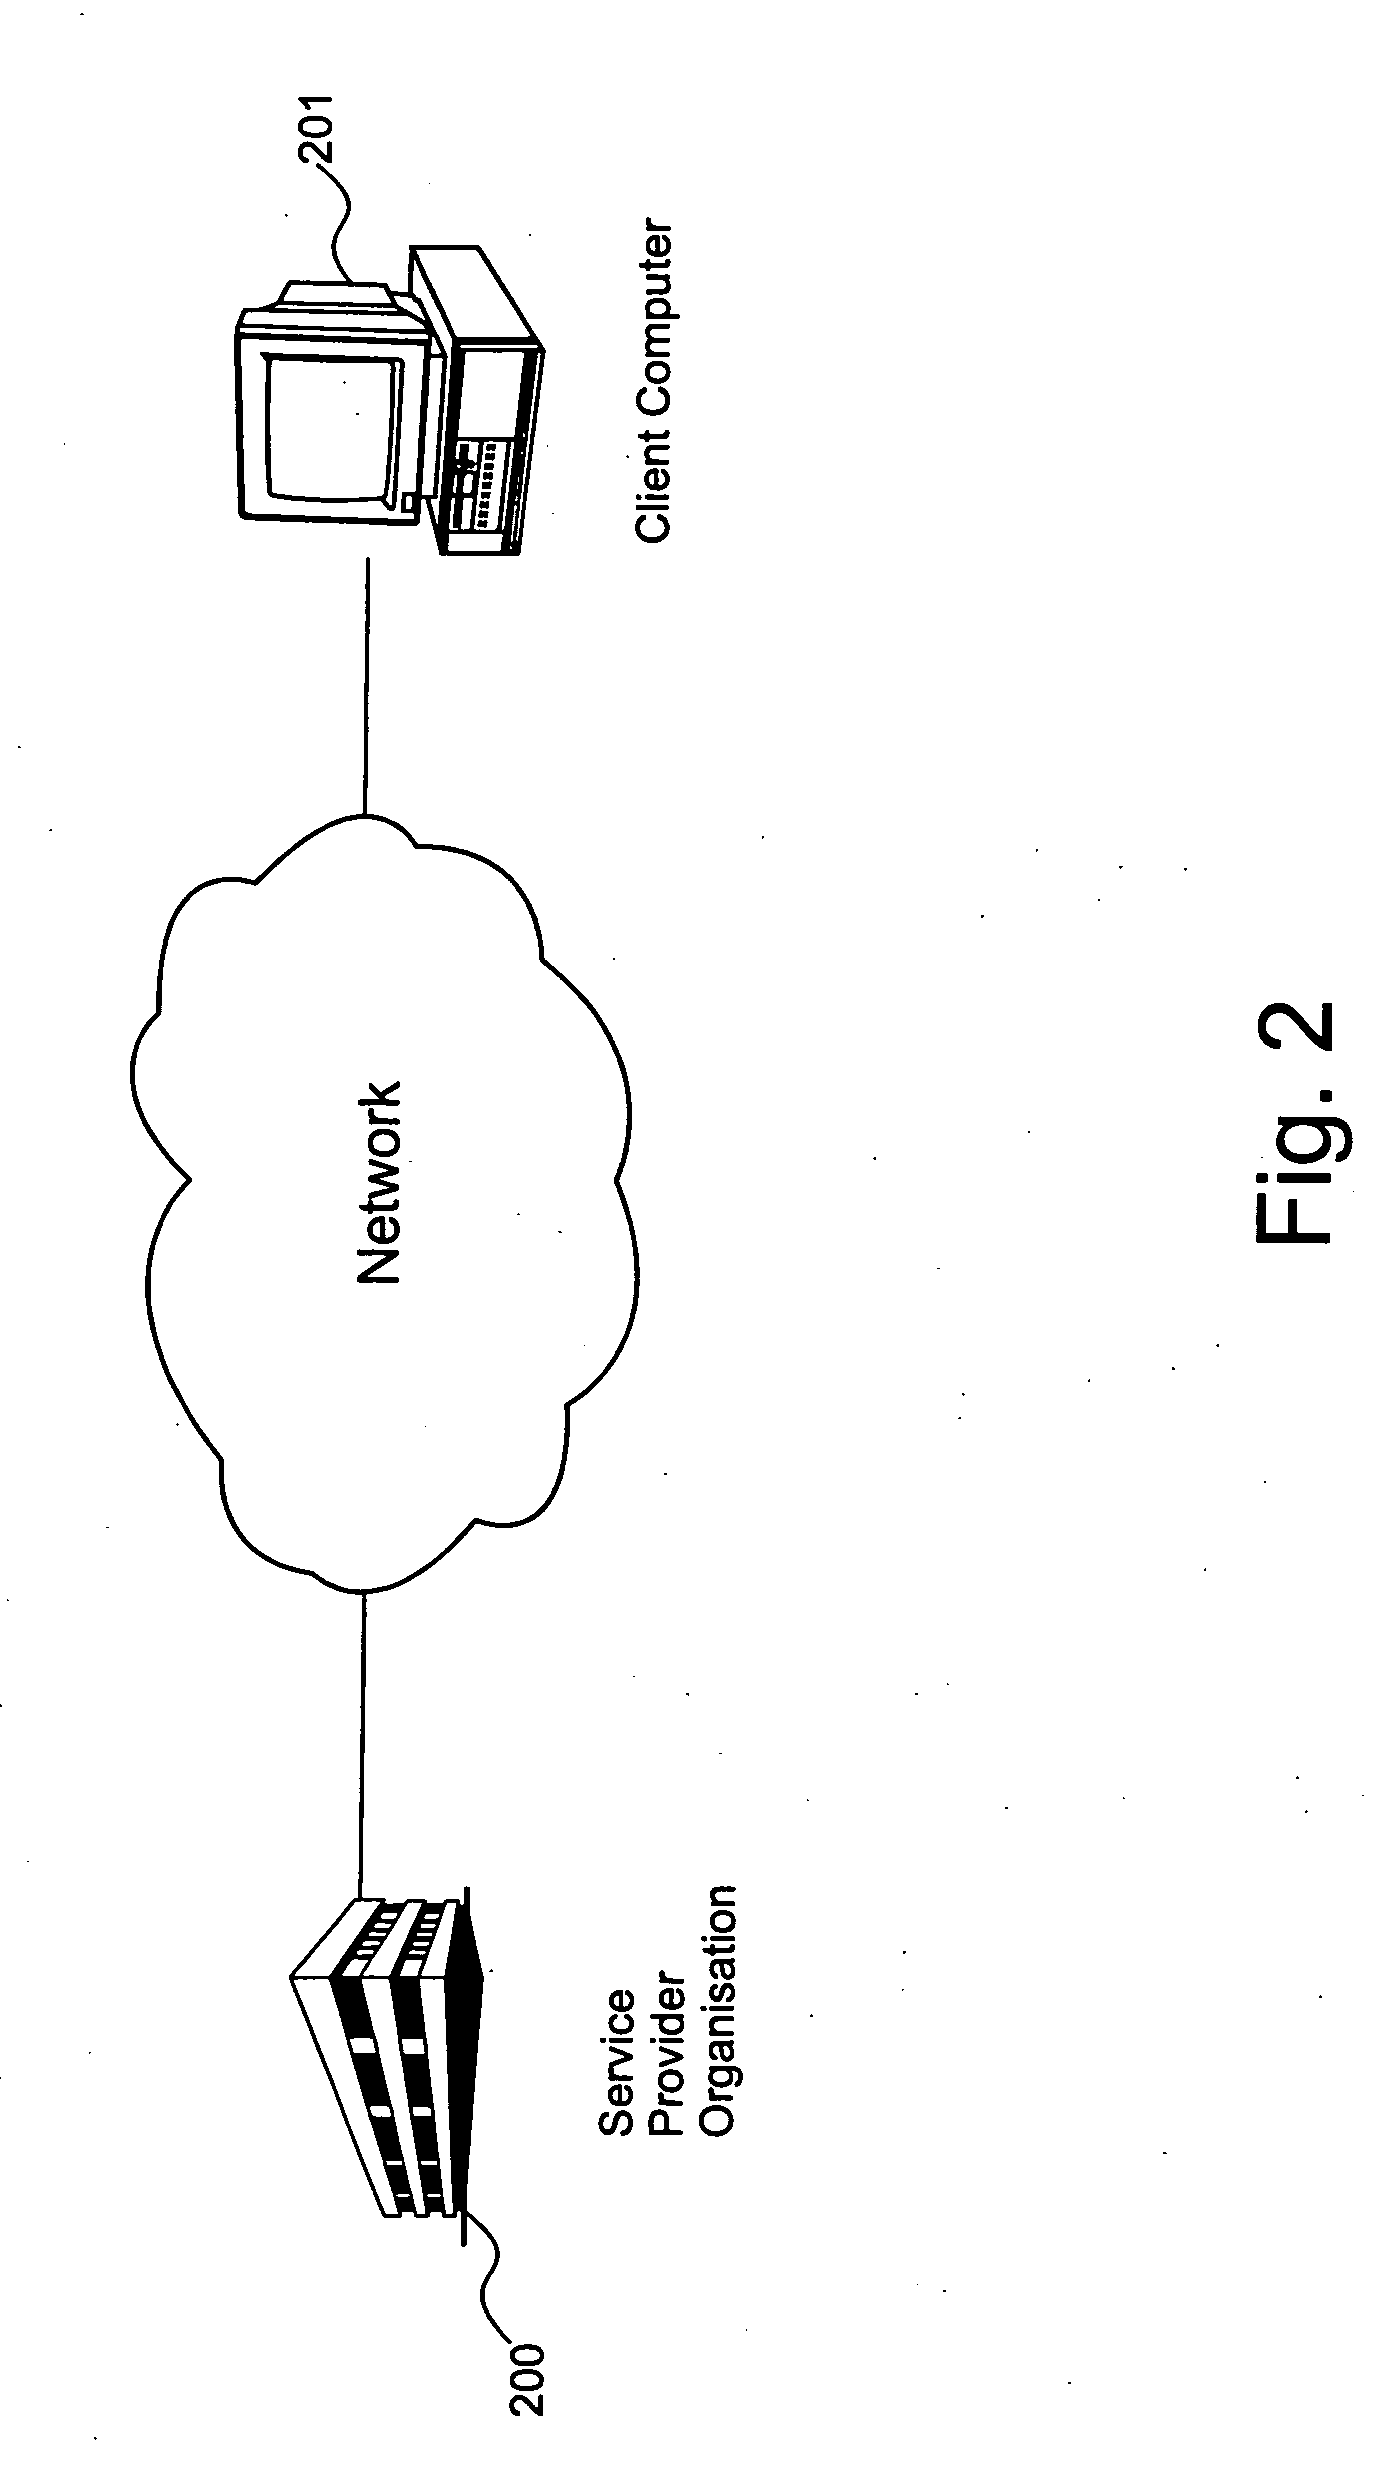
Such traders and analysists working remotely over the internet do not have access to multiple screen views.

Method used


Image

  • Market visualisation tool
  • Market visualisation tool
  • Market visualisation tool

Examples


Embodiment Construction

[0083] There will now be described by way of example a specific mode contemplated by the inventors. In the following description numerous specific details are set forth in order to provide a thorough understanding. It will be apparent however, to one skilled in the art, that the present invention may be practiced without limitation to these specific details. In other instances, well known methods and structures have not been described in detail so as not to unnecessarily obscure the description.

[0084] In this specification, the term “personal computer” will be taken to include all personal computing devices and devices of a personal nature, including portable devices having screen displays and is not restricted to computers having the PC standard architecture. For example, in this specification the term “personal computer” includes Apple Macintosh computers, laptop computers, palm type computers, and notebook type computers, as well as mobile phone type devices and personal digital...


PUM


Abstract

There is disclosed a visual display comprising: a plurality of value indicators, indicating values for a plurality of market measures, said plurality of value indicators extending over a plurality of markets; at least one user settable limit value, representing a limit value of a said market indicator; wherein said display is operable for highlighting any individual said market indicators which exhibit a predetermined level of activity.

Description

FIELD OF THE INVENTION [0001] The present invention relates to the field of computer science, and particularly although not exclusively, to an improved method, apparatus, service and system for visualization of market data and information. BACKGROUND TO THE INVENTION [0002] Prior art computerised trading tools for use in financial institutes such as banks, merchant banks, and future exchanges involve screen based solutions for displaying a set of individual bid / offer prices within a particular market. Examples of such systems are common. [0003] For example, the known Bloomberg trading screens present columns of bid / offer prices for trades in a particular market, for example the Euro / US dollar market, such systems are described in International patent application WO 03 / 08753. [0004] In another example, the known CQG screen based system displays a range of parameters and charts concerning a wide range of individual markets such as the DAX index, or the FTSE 100 index. In the known CQG...

Claims


Application Information

Patent Timeline
Patent Type & Authority Applications(United States)
IPC IPC(8): G06Q40/00
CPCG06Q40/02G06Q40/00
Inventor JOHNSON, OLIVER ASHBY
Owner JOHNSON OLIVER ASHBY
Why Eureka
Try Eureka