Human machine interface for an energy analytics system

Inactive Publication Date: 2007-07-17
POWER MEASUREMENT LTD
View PDF9 Cites 164 Cited by
  • Summary
  • Abstract
  • Description
  • Claims
  • Application Information

AI Technical Summary

Benefits of technology

[0011]The EEM software system particularly relates to the application and process of displaying EEM data and allowing a user to interact with the EEM data to better understand and manage their energy system. The application exposes patterns, correlations and causalities in raw data. The user can enter queries and view the results, simplifying the user's access to energy analytic data. The EEM software system is operable to run on any platform that has a physical user interface, such as a desktop display, a browser, a hand-held device, a wireless device, Windows Management Console, an Intelligent Energy Device (“IED”) and so forth.
[0012]The disclosed embodiments provide an intuitive user interface that provides context sensitive and relevant guidance to novice and expert users. Existing general analysis tools require the user to be an expert in understanding the meaning of the relevant data. Without an intimate and accurate understanding of the characteristics of their energy data and how it is related, the user often ends up with a report that means nothing or causes them to come to the wrong conclusion. The graphical user interfaces of the disclosed embodiments are intended to assist the user in making a specific type of analysis. Navigational guides lead the novice user through the system in a logical and simplified way, while predefined limits provide some protection for the novice user from taking unintended actions.
[0013]The probability of the user reaching the wrong conclusion is dramatically reduced or eliminated through the use of the graphical user interfaces generat

Problems solved by technology

Without an intimate and accurate understanding of the characteristics of their energy data and how it is rel

Method used


Image

  • Human machine interface for an energy analytics system
  • Human machine interface for an energy analytics system
  • Human machine interface for an energy analytics system

Examples


Example

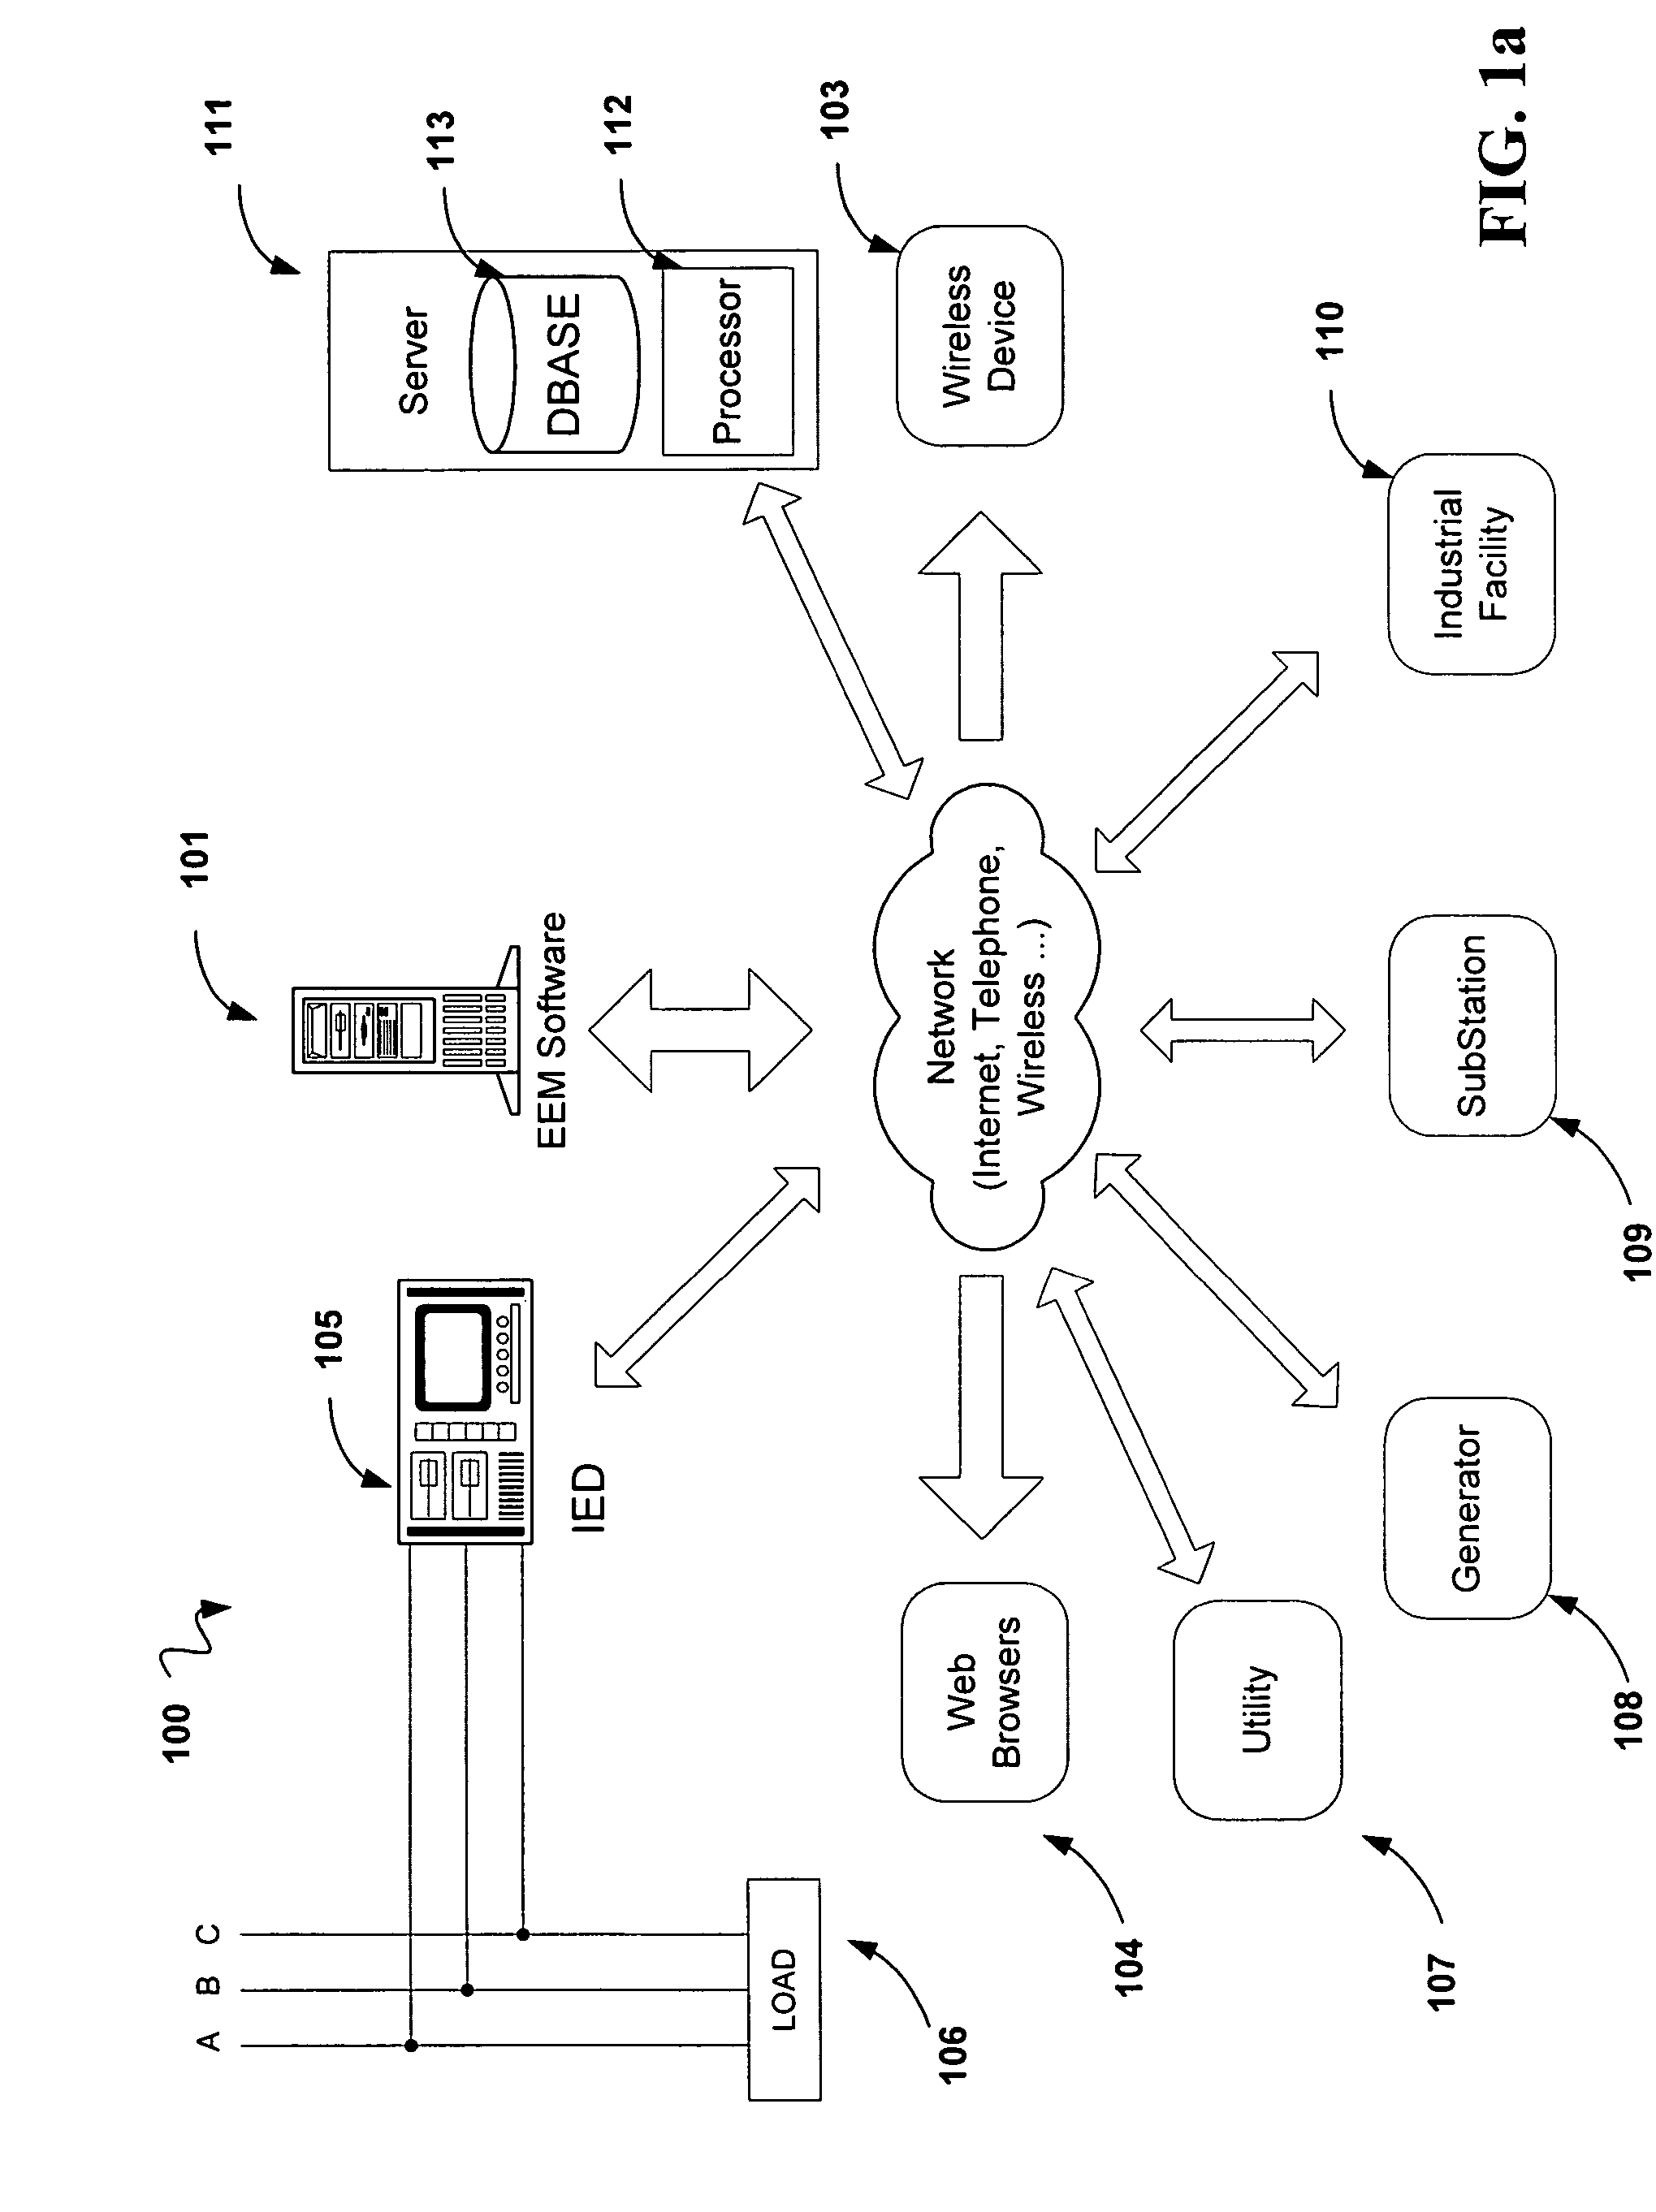
[0042]Referring to FIG. 1a, the disclosed embodiments relate to an Enterprise Energy Management (“EEM”) software system 100 that may collect data from various types of EEM data sources and create useful information based on that data. The EEM software system 100 may also allow a user to perform what-if analysis, make changes in their system, and verify results based on the changes. As illustrated, the EEM software system 100 may include an EEM software server 101 that may be coupled with a network 102. As used herein, the network 102 should be broadly construed to include any one or more of a number of types of networks that may be created between devices using an Internet connection, a LAN / WAN connection, a telephone connection, a wireless connection, and so forth.

[0043]Herein, the phrase “coupled with” is defined to mean directly connected to or indirectly connected through one or more intermediate components. Such intermediate components may include both hardware and software bas...


PUM


Abstract

An Enterprise Energy Management (“EEM”) software system is disclosed that displays EEM data and allows a user to interact with the data to better understand and manage their electrical system. The EEM software system collects real-time, near real-time and historical input data from various data sources, creates useful information from that data by filtering and isolating relevant data and performing analytics on the data, displays that data to the user in an easy to understand format, and allows the user to interact with the displayed data. The EEM software allows the user to perform what-if analysis, make changes in their system and verify results of those changes. The graphical user interfaces provide context sensitive and relevant guidance to novice and expert users.

Description

RELATED APPLICATIONS[0001]The present application claims priority from U.S. Provisional Patent Application No. 60 / 445,788, entitled HUMAN-MACHINE INTERFACE FOR AN ENERGY ANALYTICS SYSTEM, filed Feb. 7, 2003, and U.S. Provisional Patent Application No. 60 / 445,881, entitled ENERGY ANALYTICS FOR AN ENERGY DISTRIBUTION SYSTEM, filed Feb. 7, 2003, which is related to U.S. patent application Ser. No. 10 / 340,374, entitled PUSH COMMUNICATIONS ARCHITECTURE FOR INTELLIGENT ELECTRONIC DEVICES, filed Jan. 9, 2003, which is a continuation-in-part under 37 CFR § 1.53(b) of U.S. patent application Ser. No. 09 / 896,570, filed Jun. 29, 2001, now U.S. Pat. No. 6,944,555, issued Sep. 13, 2005, which is a continuation-in-part under 37 CFR § 1.53(b) of U.S. patent application Ser. No. 09 / 814,436, filed Mar. 22, 2001, now U.S. Pat. No. 6,751,562, issued Jun. 15, 2004, which is a continuation-in-part under 37 CFR § 1.53(b) of U.S. patent application Ser. No. 09 / 723,564, filed Nov. 28, 2000, now U.S. Pat. N...

Claims


Application Information

Patent Timeline
IPC IPC(8): G06F3/01G01D4/00G06Q30/00
CPCG01D4/004G06Q10/10G06Q30/04G06Q50/06Y02B90/242Y04S20/322Y02B90/20Y04S20/30
Inventor FORTH, J. BRADFORDCOWAN, PETER C.RANSOM, DOUGLAS STEPHENSTEVENSON, THOMAS S.YEO, JEFFREY W.
Owner POWER MEASUREMENT LTD
Why Eureka
Try Eureka