Slowness-frequency projection display and animation

a slow-frequency projection and animation technology, applied in the field of earth formation investigation, can solve the problems of poor quality estimated dts curve writs, no mechanism available to adequately quality control the accuracy of such techniques, and no way to know from displayed information

Inactive Publication Date: 2005-09-01
SCHLUMBERGER TECH CORP
View PDF7 Cites 26 Cited by
  • Summary
  • Abstract
  • Description
  • Claims
  • Application Information

AI Technical Summary

Benefits of technology

[0010] According to at least one embodiment, the information displayed in the SFA log display may be presented in a manner which enables an observer of the SFA log display to visually compare relative frequency dispersive characteristics of the dispersion curve information over selected portions of the first depth interval. Additionally, in at least one implementation, the information displayed in the SFA log display may be presented in a manner which enables an observer of the SFA log display to visually assess homogeneous and inhomogeneous characteristics of the dispersion curve information over selected portions of the first depth interval. In another implementation, the information displayed in the SFA log display may also be presented in a manner which enables an observer of the SFA log display to visually assess isotropic and anisotropic characteristics of the dispersion curve information over selected portions of the first depth interval. In other implementations, estimated wave slowness information associated with the selected portions of the first depth interval may be generated using the slowness-versus-frequency dispersion curve information. An overlay of the estimated wave slowness information may then be displayed onto the SFA log display. According to at least one embodiment, the display of the overlay information onto the SFA log display is presented in a manner which enables an observer of the SFA log display to visually assess the relative accuracy of the estimated wave slowness information over selected portions of the first depth interval. In a further embodiment, the SFA log display may also include a navigable pointer mechanism configured or designed to allow a user to navigate within the SFA log display in order to access depth specific sonic logging information associated with selected depths. In at least one implementation, the SFA log display may be configured or designed to display selected characteristics of the depth specific sonic logging information concurrently with the SFA log information.

Problems solved by technology

However, as described in greater detail below, there are currently no mechanisms available by which to adequately quality control the accuracy of such techniques.
A significant problem with quality control display of FIG. 3E, however, is that there is no way knowing from the displayed information if the estimated dts 336 actually corresponds to the low frequency limit of the dipole flexural dispersion curve at each depth.
Since the estimated dts curve 336 may be generated using a variety of mathematical algorithms and / or computer data processing techniques, errors in the calculation of the estimated dts may result in a poor quality estimated dts curve writs does not correspond to the low frequency limit of the dipole flexural.

Method used


Image

  • Slowness-frequency projection display and animation
  • Slowness-frequency projection display and animation
  • Slowness-frequency projection display and animation

Examples


Embodiment Construction

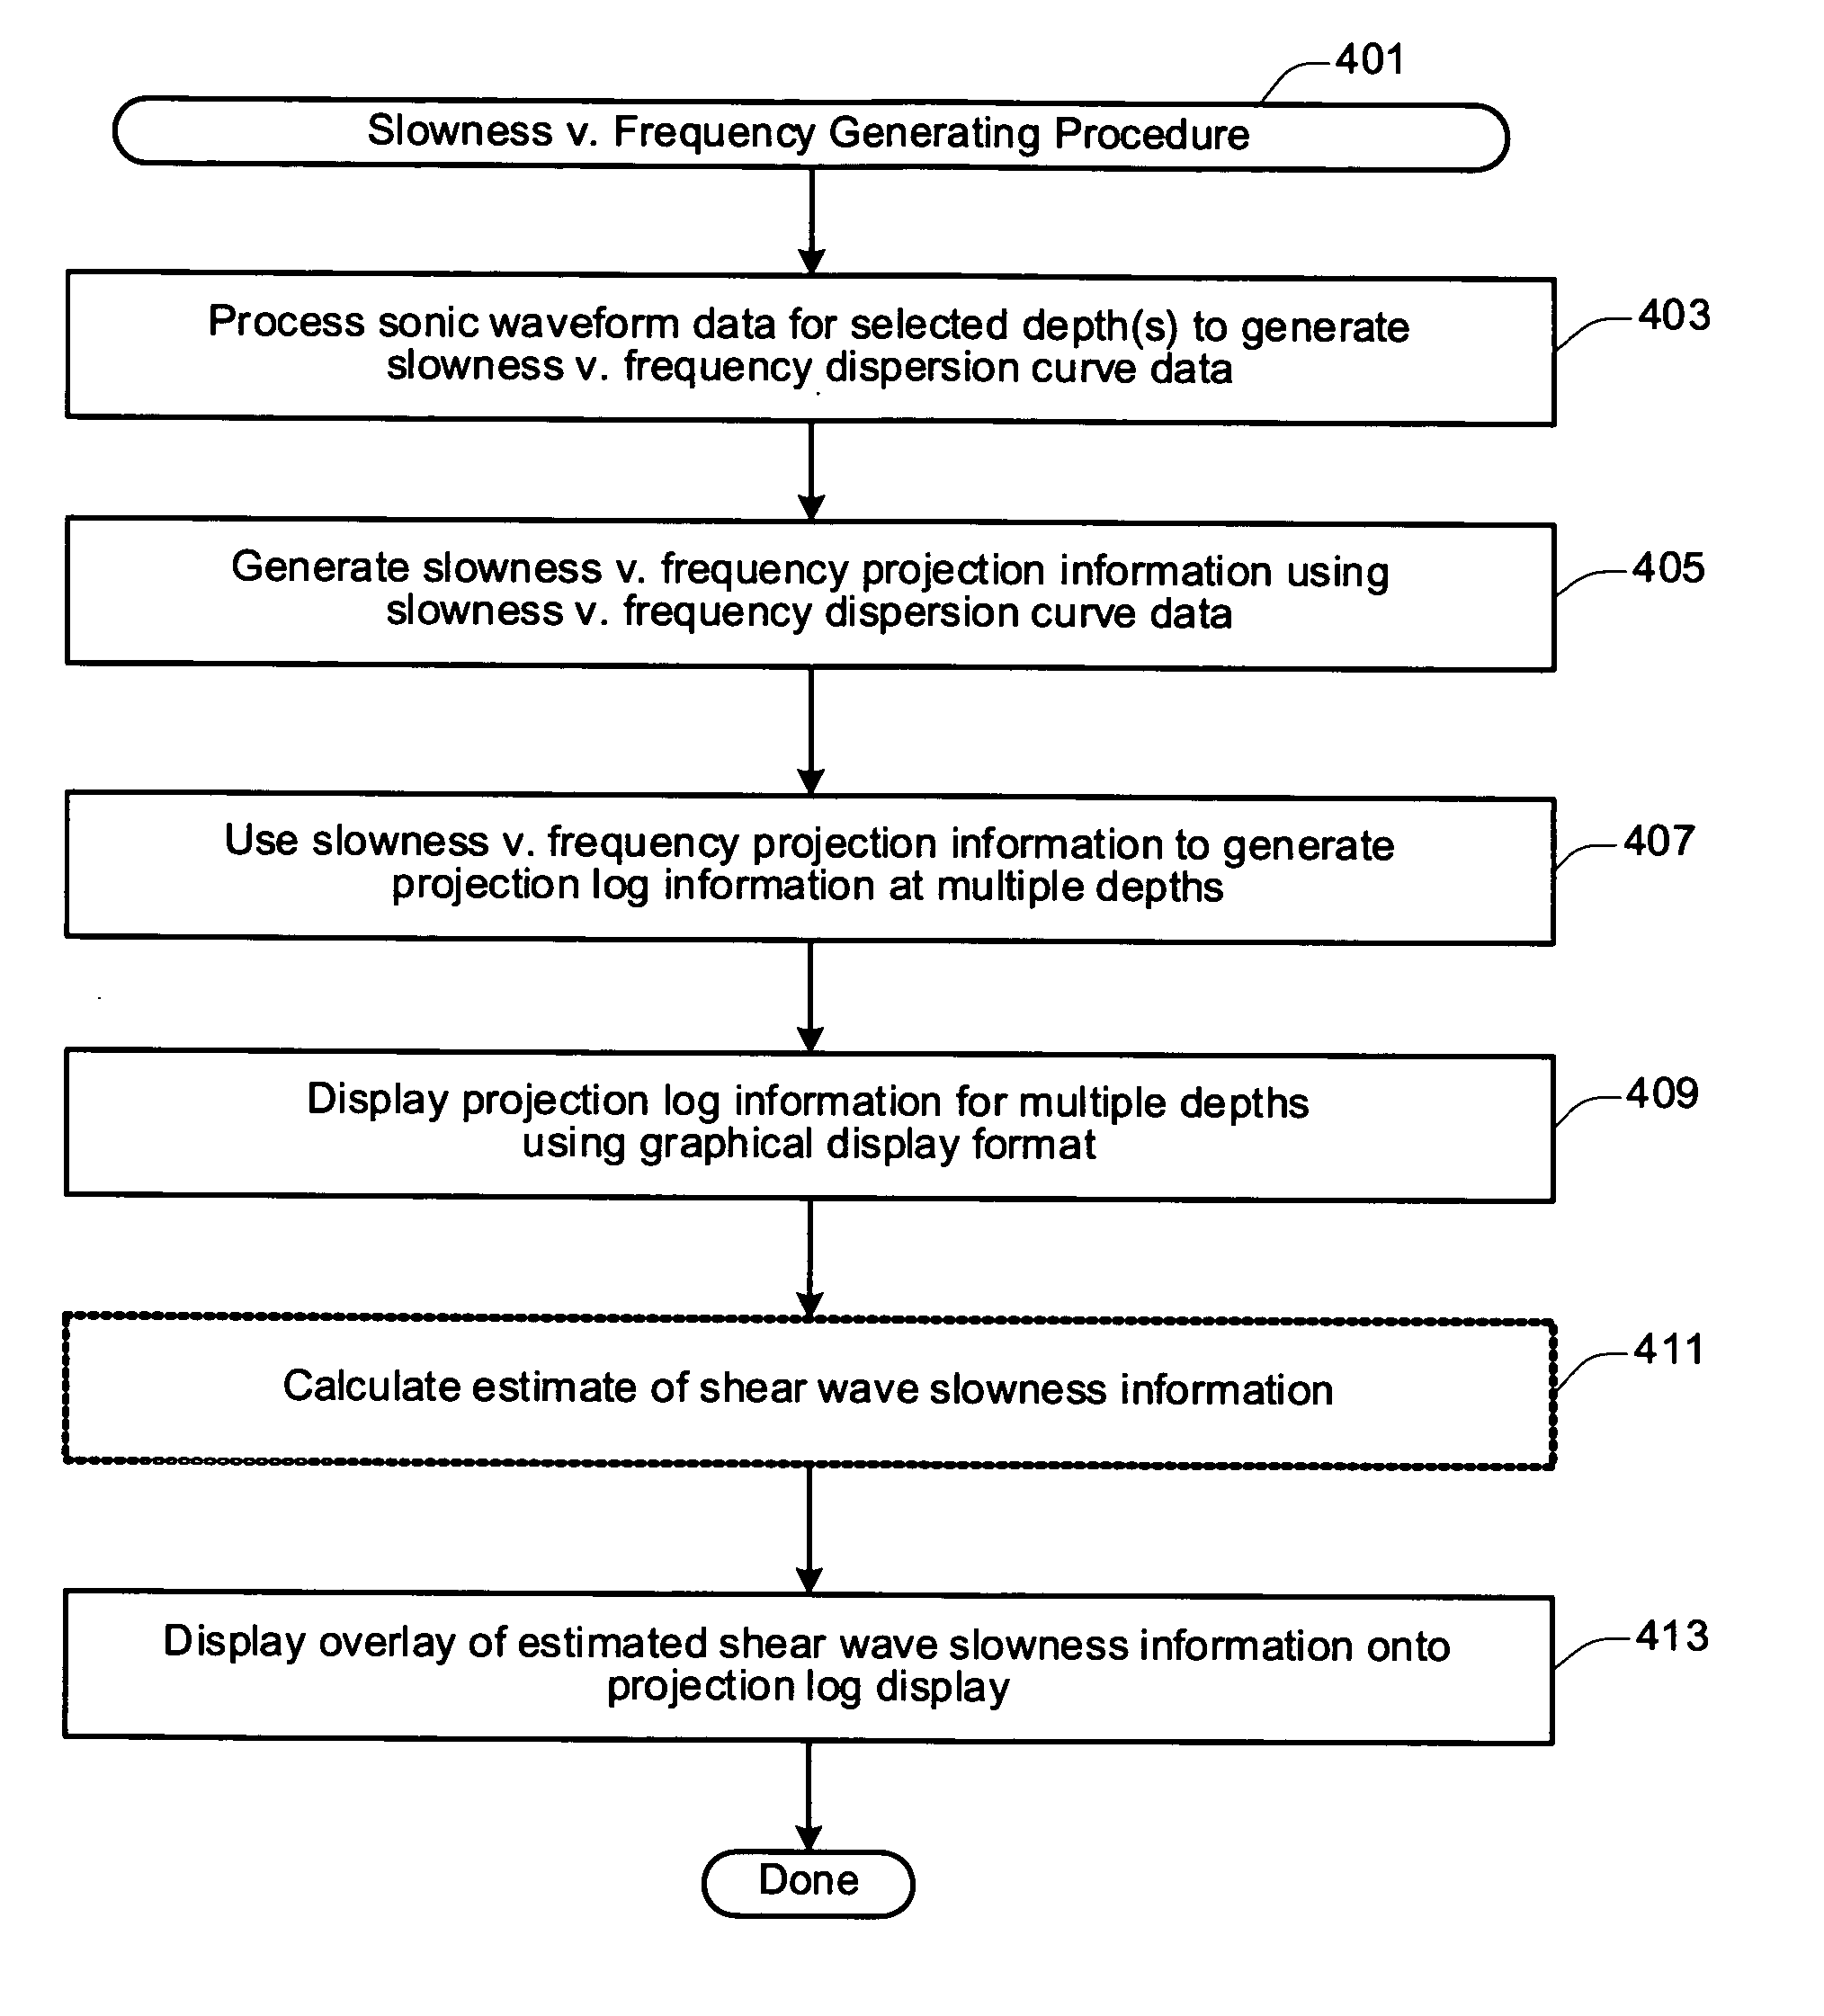
[0026] The present invention describes several techniques for displaying sonic logging data that provide highly reliable, quality-control (QC) indicators which are superior to previous QC indicators. As describing greater detail below, one aspect of the present invention is directed to a novel display of sonic logging data corresponding to a slowness-frequency projection log (i.e., SFA projection log). One of the benefits of the SFA projection log display of the present invention is that the format of the information displayed may be used to quickly and easily verify or QC the accuracy / inaccuracy of the processed sonic logging data, as well as to identify any potential problematic or inconsistent portions of the sonic logging data which may generate erroneous results. Specific embodiments of the present invention describe various graphical displays based on dispersion curve data. Dispersion curve based displays can be used, for example, for wireline sonic data as well as logging-whi...


PUM


Abstract

The present invention describes several techniques for displaying sonic logging data that provide highly reliable, visual quality-control (QC) indicators. One aspect of the present invention is directed to a novel display of sonic logging data corresponding to a slowness frequency analysis (SFA) projection log. One of the benefits of the SFA projection log display of the present invention is that the format of the information displayed may be used to visually confirm the accuracy/inaccuracy of the processed sonic logging data over selected depth intervals. The SFA projection log display may also be used to visually identify any potential problematic or inconsistent portions of the processed sonic logging information. An overlay of estimated wave slowness information may also be displayed onto the SFA log display in a manner which enables an observer of the SFA log display to visually assess the relative accuracy of the estimated wave slowness information over selected depth intervals. The SFA log display may also include a navigable pointer mechanism configured or designed to allow a user to navigate within the SFA log display in order to access depth specific sonic logging information associated with selected depths. In this way selected characteristics of depth specific sonic logging information may be accessed and displayed concurrently with log information for an entire depth interval.

Description

FIELD OF THE INVENTION [0001] The present invention relates to investigation of earth formations and, more particularly, to a technique for displaying sonic well logging information in a manner which provides for reliable quality-control (QC) indicators. BACKGROUND OF THE INVENTION [0002] It is well known that mechanical disturbances can be used to establish acoustic waves in earth formations surrounding a borehole, and the properties of these waves can be measured to obtain important information about the formations through which the waves have propagated. Parameters of compressional, shear and Stoneley waves, such as their velocity (or its reciprocal, slowness) in the formation and in the borehole, can be indicators of formation characteristics that help in evaluation of the location and / or producibility of hydrocarbon resources. An example of some techniques which may be used for determining properties of earth formations using sonic well logging is described in U.S. Pat. No. 6,6...

Claims


Application Information

Patent Timeline
Patent Type & Authority Applications(United States)
IPC IPC(8): G01V1/34G01V1/50
CPCG01V1/50G01V1/34
Inventor PLONA, THOMAS J.KANE, MICHAEL R.SHENOY, RAMZEROUG, SMAINE
Owner SCHLUMBERGER TECH CORP
Why Eureka
Try Eureka