Apparatus and method for displaying a variety of visualizations linked to one or more data source queries

a technology of data source queries and apparatus, applied in the field of apparatus and method for displaying a variety of visualizations linked to one or more data source queries, can solve the problems of inflexibility, time-consuming layout of required information, and inability to adapt to the needs of users,

Active Publication Date: 2008-05-08
BUSINESS OBJECTS SOFTWARE
View PDF29 Cites 229 Cited by
  • Summary
  • Abstract
  • Description
  • Claims
  • Application Information

AI Technical Summary

Problems solved by technology

Indeed, it often provides more flexibility than is needed for data analysis and it becomes time consuming to layout the required information.
A structured workspa...

Method used


Image

  • Apparatus and method for displaying a variety of visualizations linked to one or more data source queries
  • Apparatus and method for displaying a variety of visualizations linked to one or more data source queries
  • Apparatus and method for displaying a variety of visualizations linked to one or more data source queries

Examples


Embodiment Construction

[0020]The following terminology is used while disclosing embodiments of the invention:

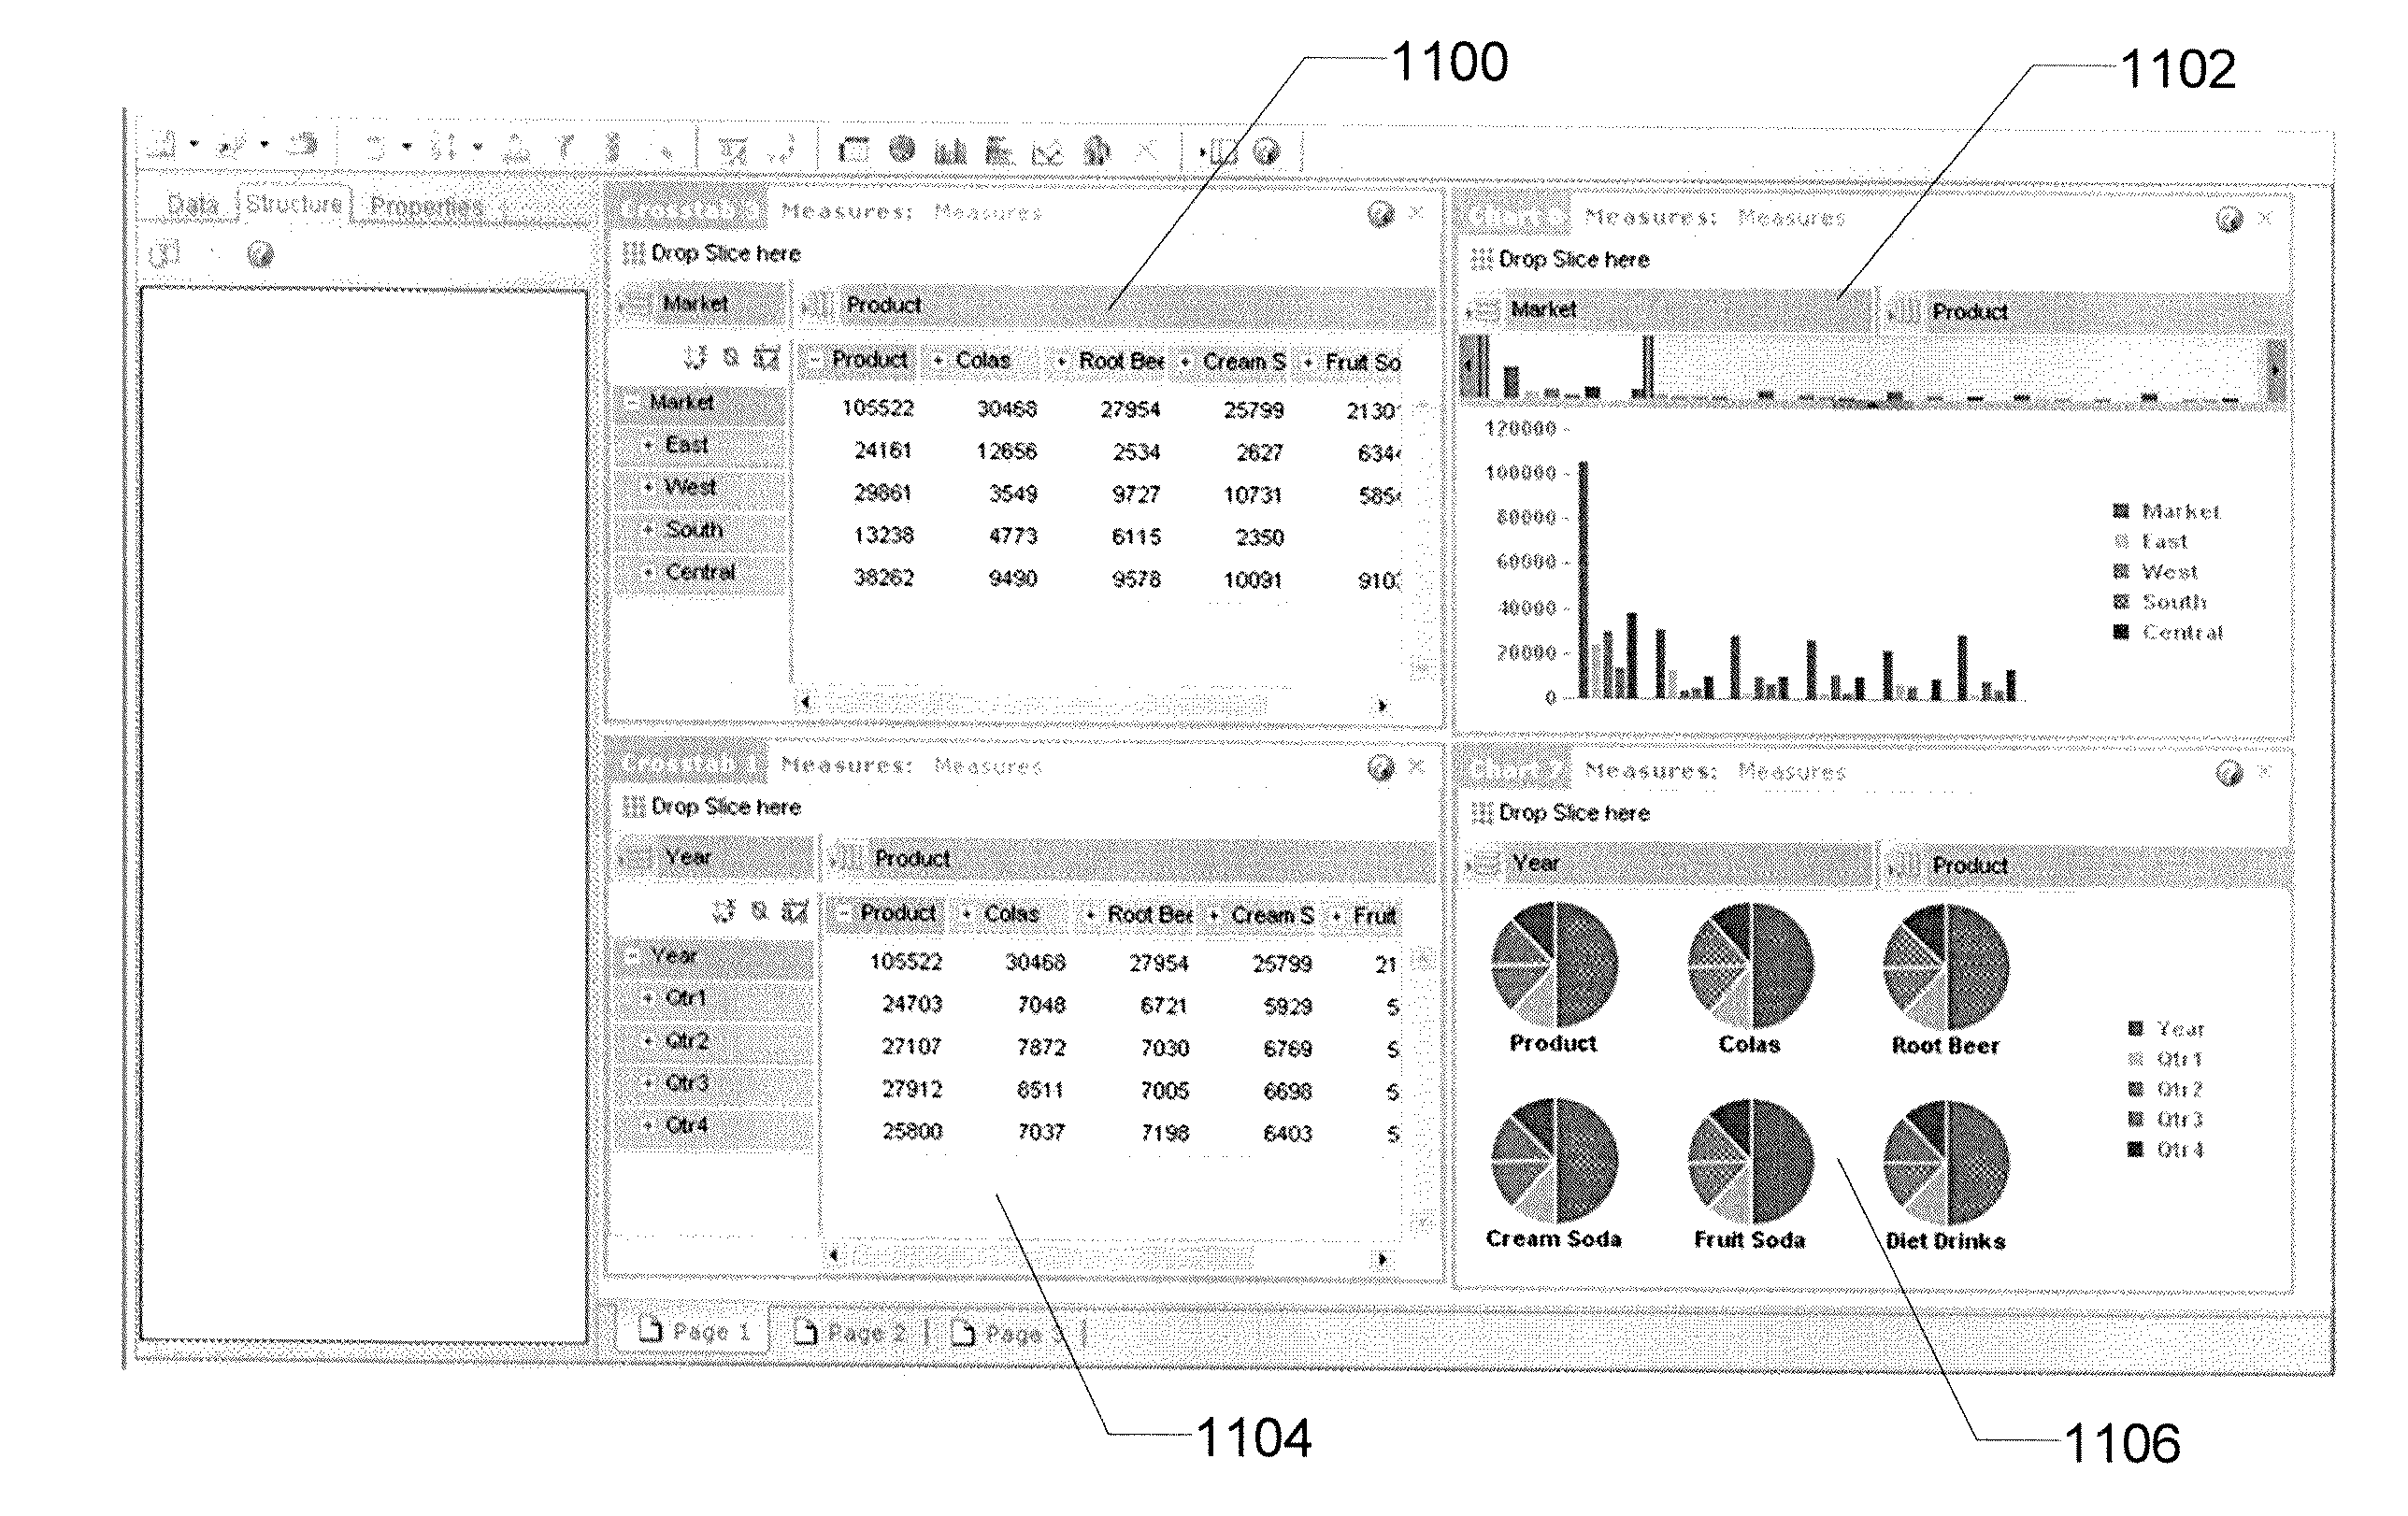
[0021]An associated visualization is a visualization that is displayed as a result of drag-and-dropping a visualization type into a semi-structured workspace. An associated visualization is the same type of visualization as the drag-and-dropped visualization type.

[0022]Axis swapping is the action of replacing a data hierarchy on an x-axis of a chart or graph with a data hierarchy on a y-axis of the chart or graph and vice versa.

[0023]A chart is a collection of visual elements used to convey information (e.g. a pie chart, a bar graph, a scatter plot, a line graph). A chart is a visualization.

[0024]A click is a depression and release of a button.

[0025]Column expansion is the action of opening out or collapsing of a data hierarchy on an x-axis of a crosstab.

[0026]A crosstab (abbreviation of cross-tabulation) is a visualization of data that displays a joint distribution of two or more variables simulta...


PUM


Abstract

A computer readable storage medium includes executable instructions to provide a Graphical User Interface with a plurality of visualization types and a semi-structured workspace. A drag-and-drop of a visualization type into a drop zone in the semi-structured workspace is received. The drop zone corresponds to a location in the semi-structured workspace where an associated visualization is displayed. A link is created between the associated visualization and a query to a data source.

Description

BRIEF DESCRIPTION OF THE INVENTION[0001]This invention relates generally to visualizing data. More particularly, this invention relates to displaying a variety of visualizations for one or more data source queries simultaneously.BACKGROUND OF THE INVENTION[0002]Data analysis tools provide a user with one of two types of workspace, a freeform workspace or a structured workspace. A freeform workspace provides a great deal of flexibility in layout. Indeed, it often provides more flexibility than is needed for data analysis and it becomes time consuming to layout the required information. A structured workspace is too rigid. While the process of laying out the required information is fast, the lack of flexibility prevents the user from viewing the data in an optimal format.[0003]In view of the foregoing, it would be highly desirable to develop a data analysis workspace that finds a middle ground between flexibility and speed during layout.SUMMARY OF INVENTION[0004]The invention includes...

Claims


Application Information

Patent Timeline
IPC IPC(8): G06F3/048G06F7/06
CPCG06F3/0486G06F17/30991G06F17/30592G06F17/30554G06F16/283G06F16/9038G06F16/248
Inventor PRINSEN, EDWARDLO, PHILIP COLDREYGOSPER, JULIAN LARSYAU, CHUEN CHI
Owner BUSINESS OBJECTS SOFTWARE
Why Eureka
Try Eureka