
Cardiac stimulation apparatus and method for the control of hypertension
a technology of cardiac output and apparatus, applied in the field of electric stimulation of the heart, to achieve the effect of reducing stroke volume, improving cardiac output, and improving the rate of sustained cardiac outpu
- Summary
- Abstract
- Description
- Claims
- Application Information
AI Technical Summary
Benefits of technology
Problems solved by technology
Method used
Image

Examples
Embodiment Construction
Cardiac Mechanics Background
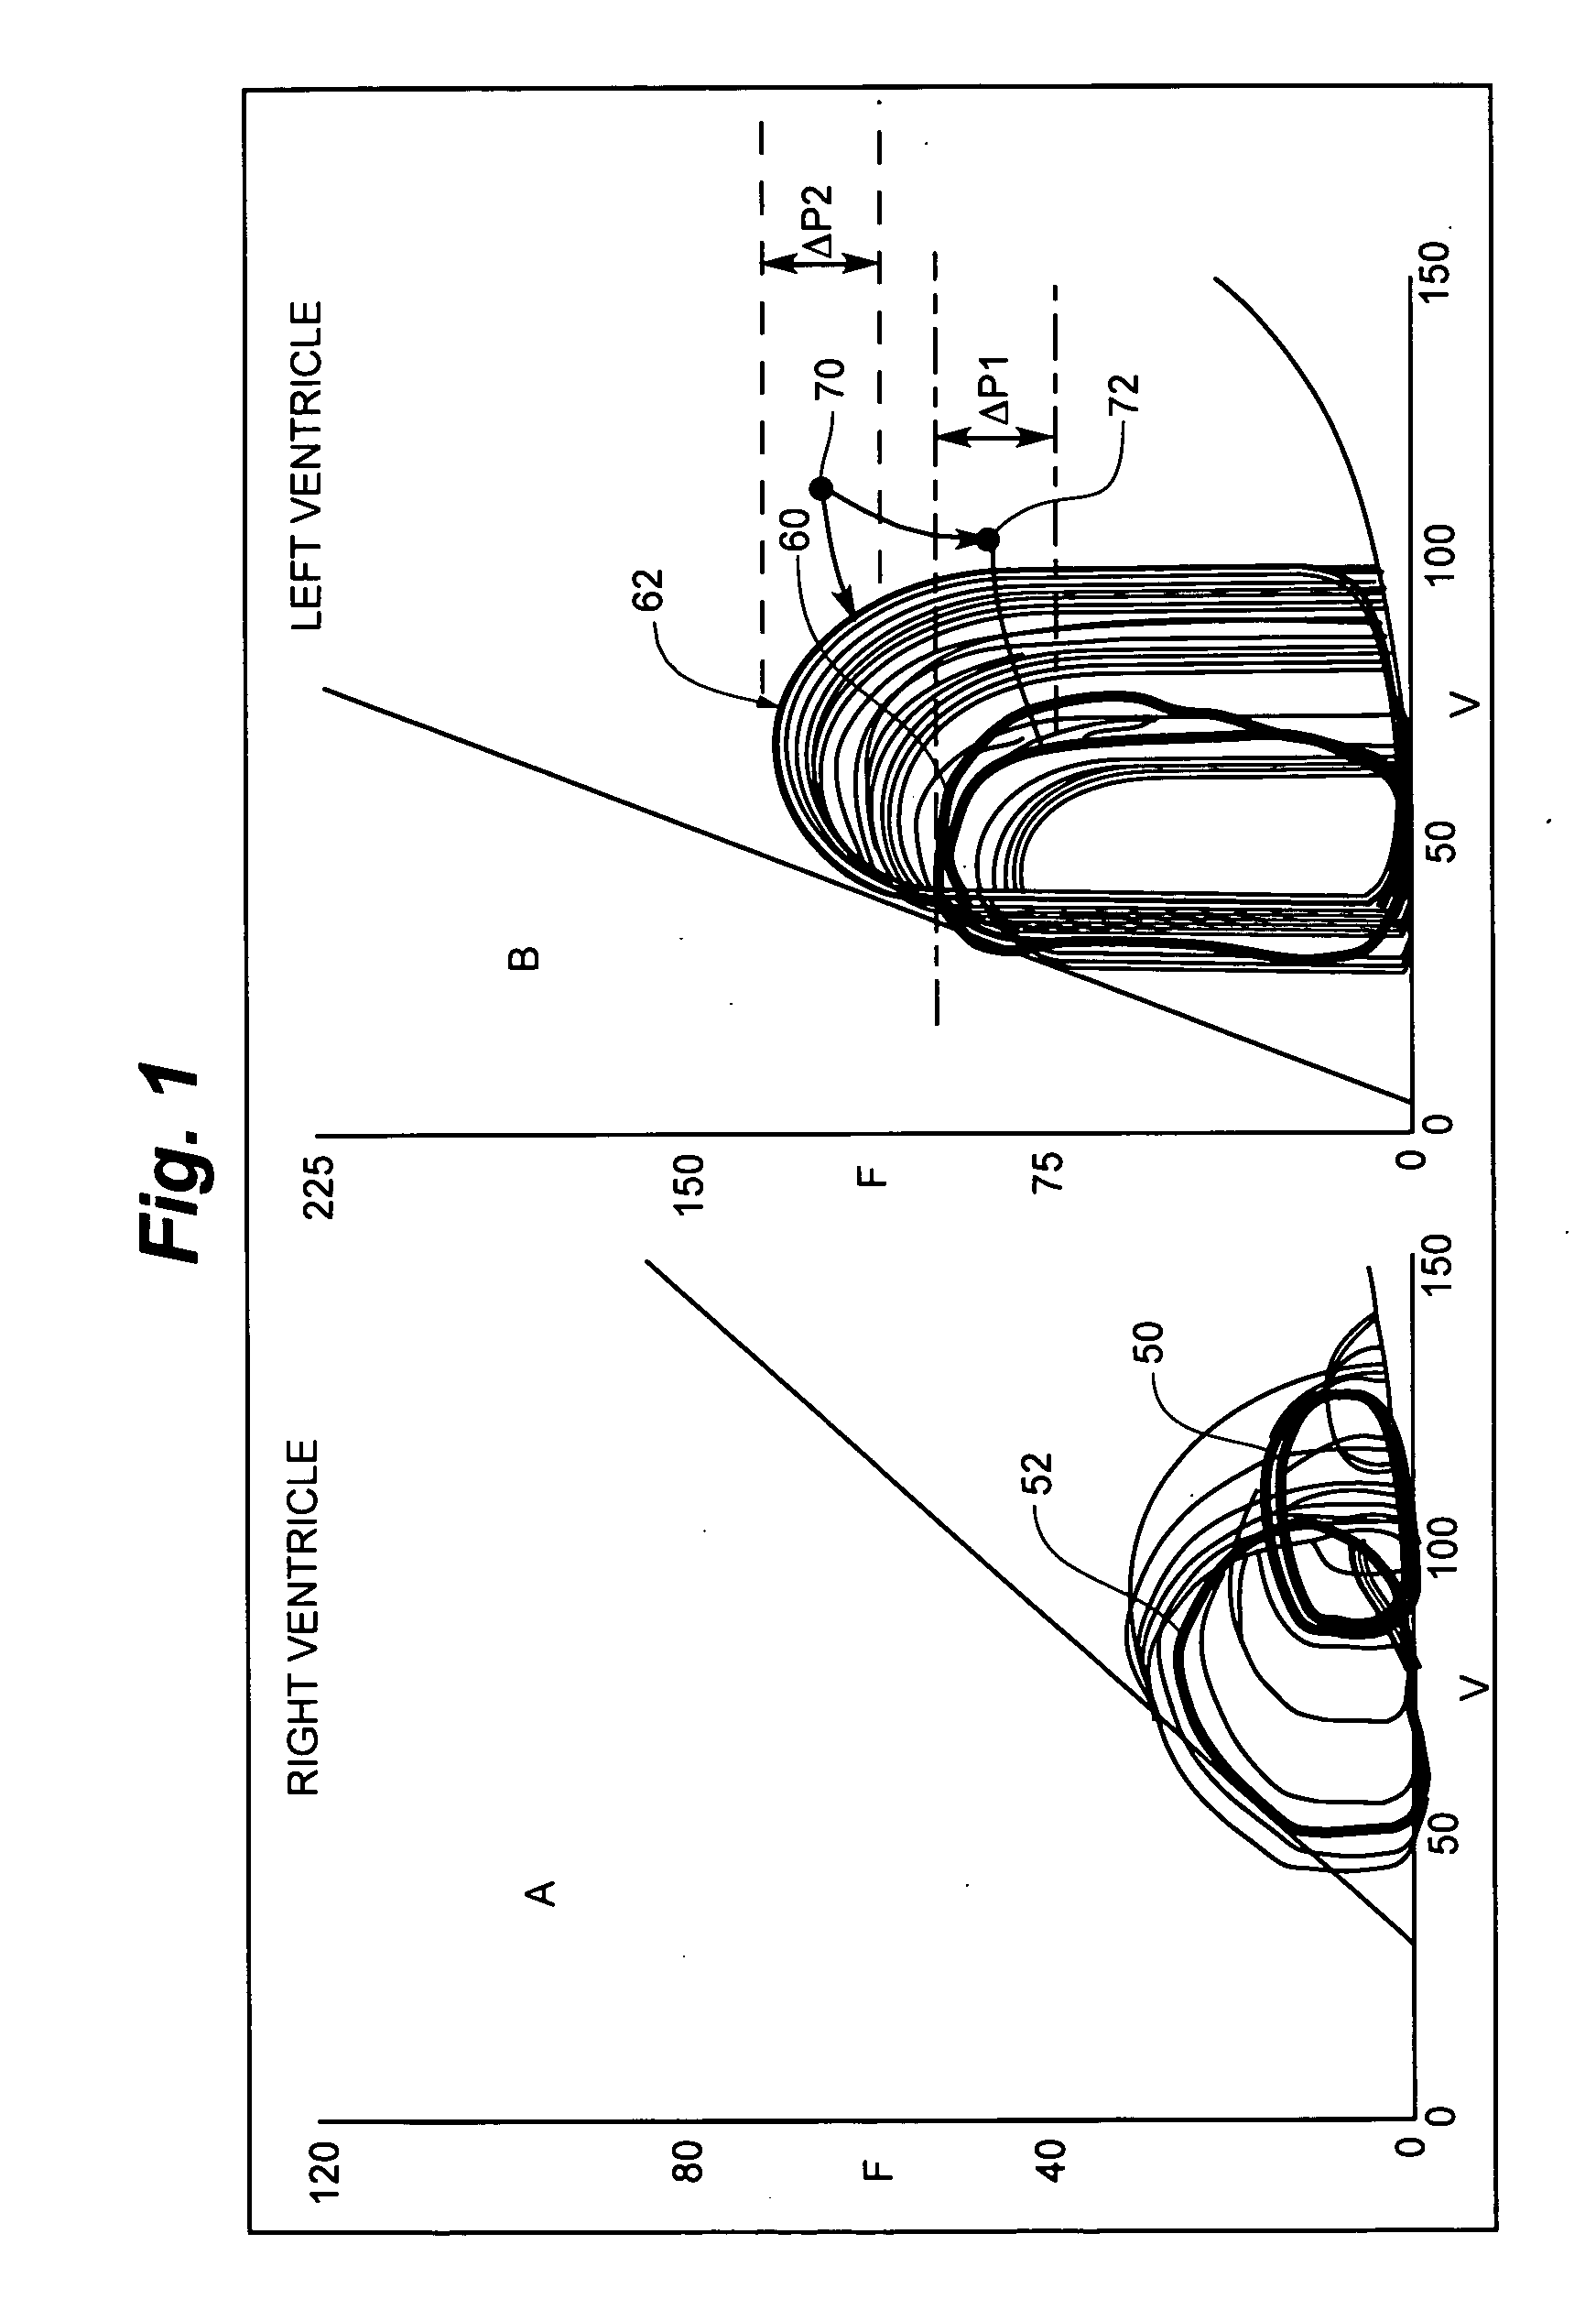
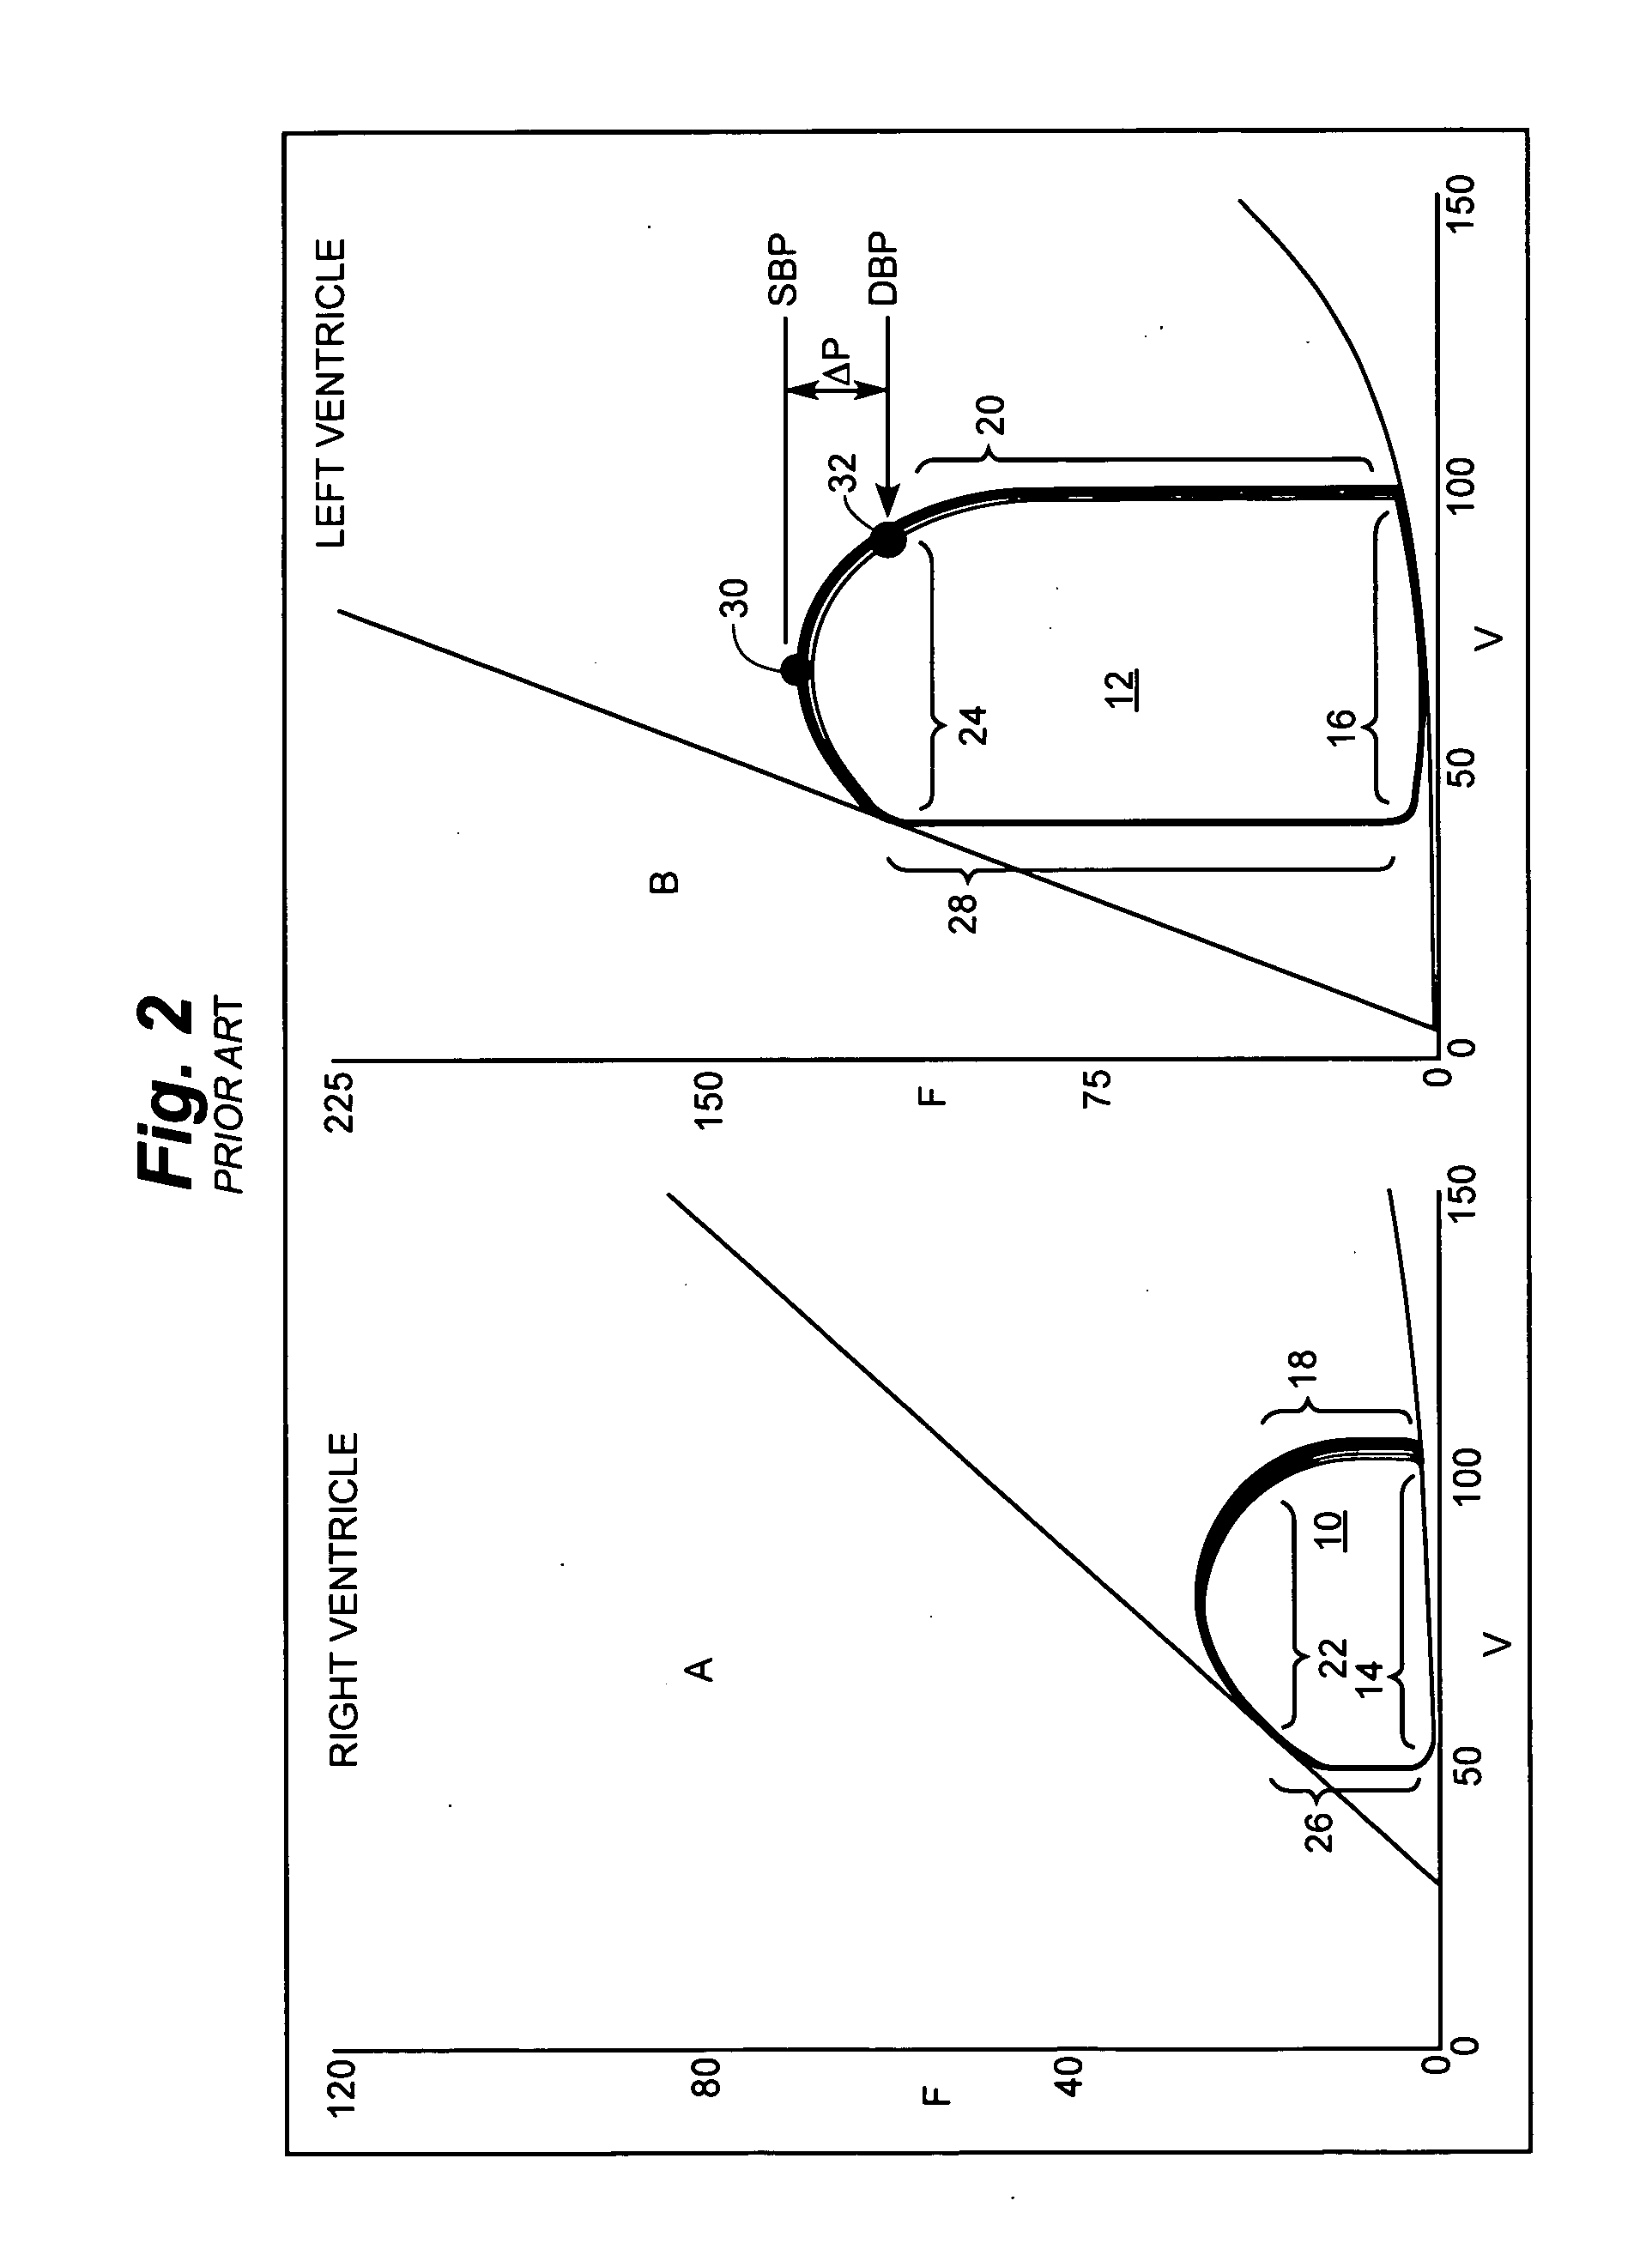
[0043]If ventricular blood pressure (P) is plotted against volume (V) for the right or left ventricles a representative pressure volume (PV) loop is generated. The area bounded by the loop reflects the amount of mechanical work done by the heart pumping blood during that beat. Cardiac events occur in sequence, and these correspond to various locations around the loop. Time proceeds counterclockwise around the loop and if beats were identical all loop points and time events would overly one on another on the 2-D figure. PV loops for sequential beats form overlapping trajectories on the figure.
[0044]FIG. 2 represents the activity of a normal healthy heart presented in the “PV Loop paradigm”, for this reason it is labeled “prior art”. In the figure a separate PV loop for each “side” of the heart is shown separately. The right heart is shown in panel A where the PV loop 10 of the right ventricle is seen. The left heart is depicted in panel B which shows the P...
PUM
 Abstract
Description
Claims
Application Information