

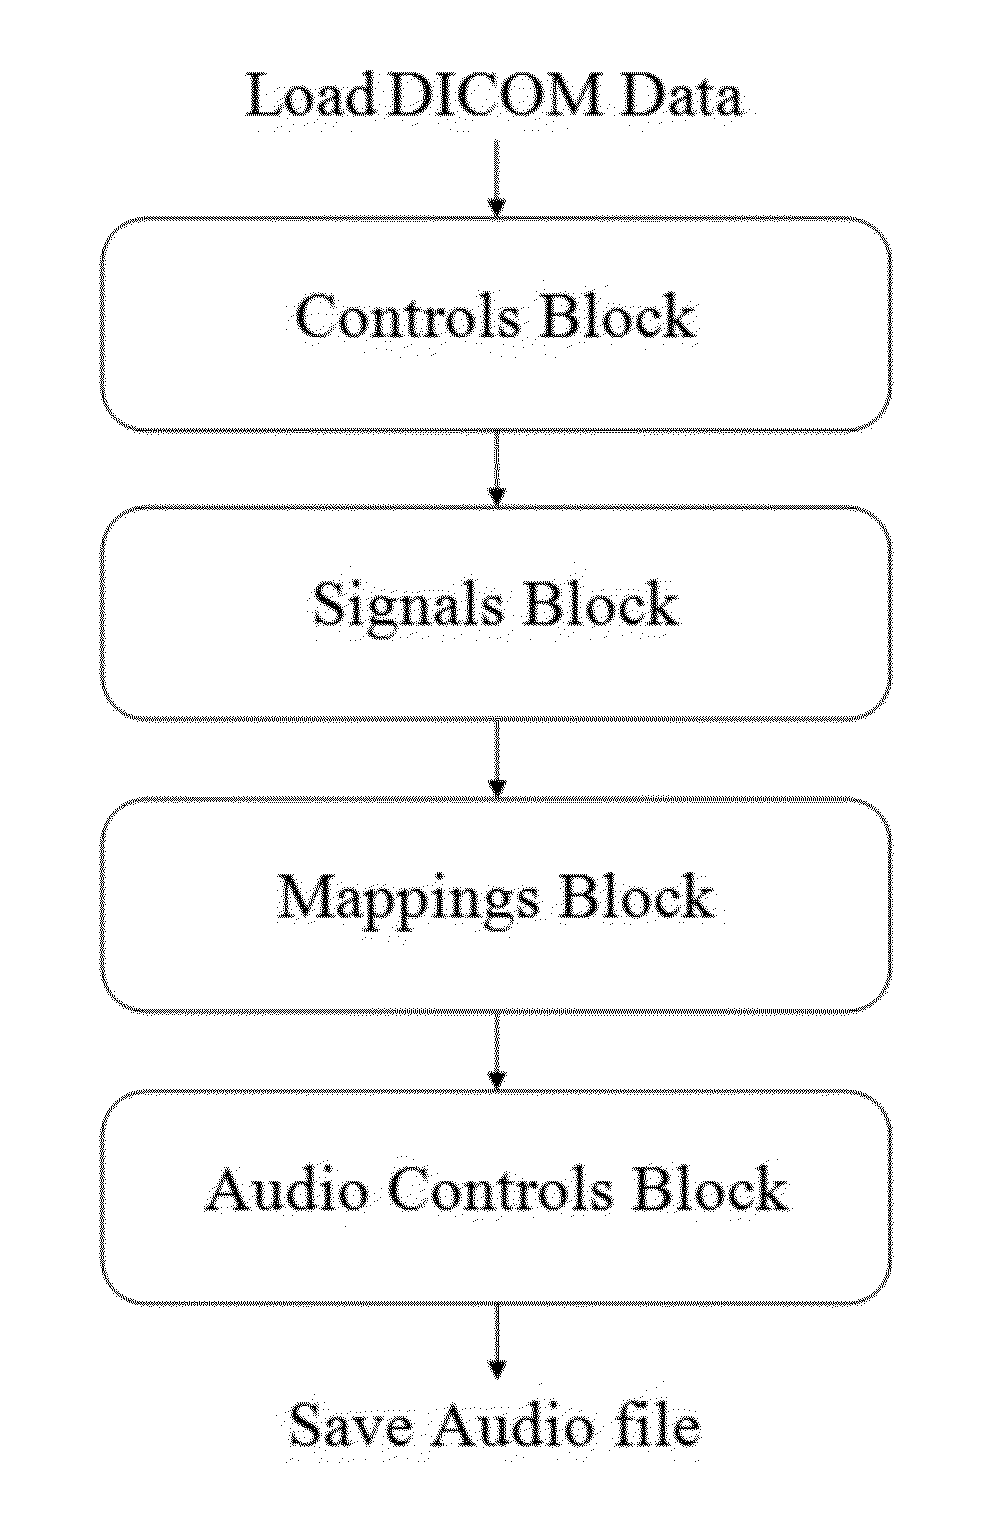
Sonification of imaging data
a technology of imaging data and sonification, applied in the field of information, can solve the problems of clinicians still being unable to detect certain conditions, high accuracy, and many limitations in the ability of the medical community to perceive and analyze the vast amount of data
- Summary
- Abstract
- Description
- Claims
- Application Information
AI Technical Summary
Benefits of technology
Problems solved by technology
Method used
Image

Examples
examples
Brain Scans
[0063]Brains scans contain complex, highly variable data and present a challenge to the interpreting physician. Imaging experts spend years learning to properly read such studies, yet detection of subtle disease remains difficult. Compounding matters, many disease processes remain invisible even to the best observers, either due to lack of meaningful information or undiscovered means by which to identify the relevant data. Visual quantitative techniques have improved matters but there is room for further improvement. It is suspected that as-yet-undiscovered information exists within these images and has diagnostic and therapeutic relevance.
[0064]FIG. 4A-D contains four examples of the spectrograms of sonifications, utilized for illustration purposes to show the correlation between the PET scans and their sonifications, that were created from normal and abnormal brain data. The left side of the figure contains single slices from three-dimensional PET scans depicting sugar ...
case study example
Dementia Case Study Example
[0068]One example utilized the sonification tool and associated methods where the brain is segmented into three regions, and each region is mapped to a different frequency. The interaction of the tones of different frequencies results in beating patterns, which are easily perceived by the human ear. The different beating patterns that can be created, can be illustrated mathematically through additive synthesis, where frequencies are added point by point. The basics of additive synthesis tell us that, when two frequencies are added together, an oscillating amplitude envelope is created at a rate that is the difference between those two frequencies; otherwise known as a beat frequency or beat envelope. If the frequencies are very close together, the psychoacoustic phenomenon is understood more on a tonal level, i.e. our brain would interpret these two distinct frequencies as one frequency that is an average of the two, along with the beat envelope around tha...
PUM
 Abstract
Description
Claims
Application Information