Dynamic filling of shapes for graphical display of data

a data visualization and dynamic filling technology, applied in the field of data visualization, can solve the problems of not being able to easily modify, neither dynamic nor easily modified, and not being able to fill any complex shap

Inactive Publication Date: 2016-11-24
INSIGHTSOFTWARE COM INT
View PDF8 Cites 8 Cited by
  • Summary
  • Abstract
  • Description
  • Claims
  • Application Information

AI Technical Summary

Problems solved by technology

However, these graphics tend to be static displays that are rendered from a single image and are thus neither dynamic nor easily modified.
This is not feasible where the infographic needs to display multiple data points that are unknown to the artist at the time of creation.
Due to the brute force nature of this approach, complex vector images would require vast programming time and large processing resources to render, and therefore are not satisfactory for filling any complex shape.
Additionally, where existing functions have been scripted to simplify the filling of certain shapes, only a limited number of such existing scripts have been created, and thus only a small fraction of the infinite number of possible shapes are covered by such existing scripts.
As seen, existing methods for displaying infographics either require the time-intensive drafting of different shapes and data values by a skilled artist, where every data value and every shape requires a separate drawing, or require an existing script, thus limiting software-generated infographics to those shapes that have been pre-scripted by a programmer.

Method used


Image

  • Dynamic filling of shapes for graphical display of data
  • Dynamic filling of shapes for graphical display of data
  • Dynamic filling of shapes for graphical display of data

Examples


Embodiment Construction

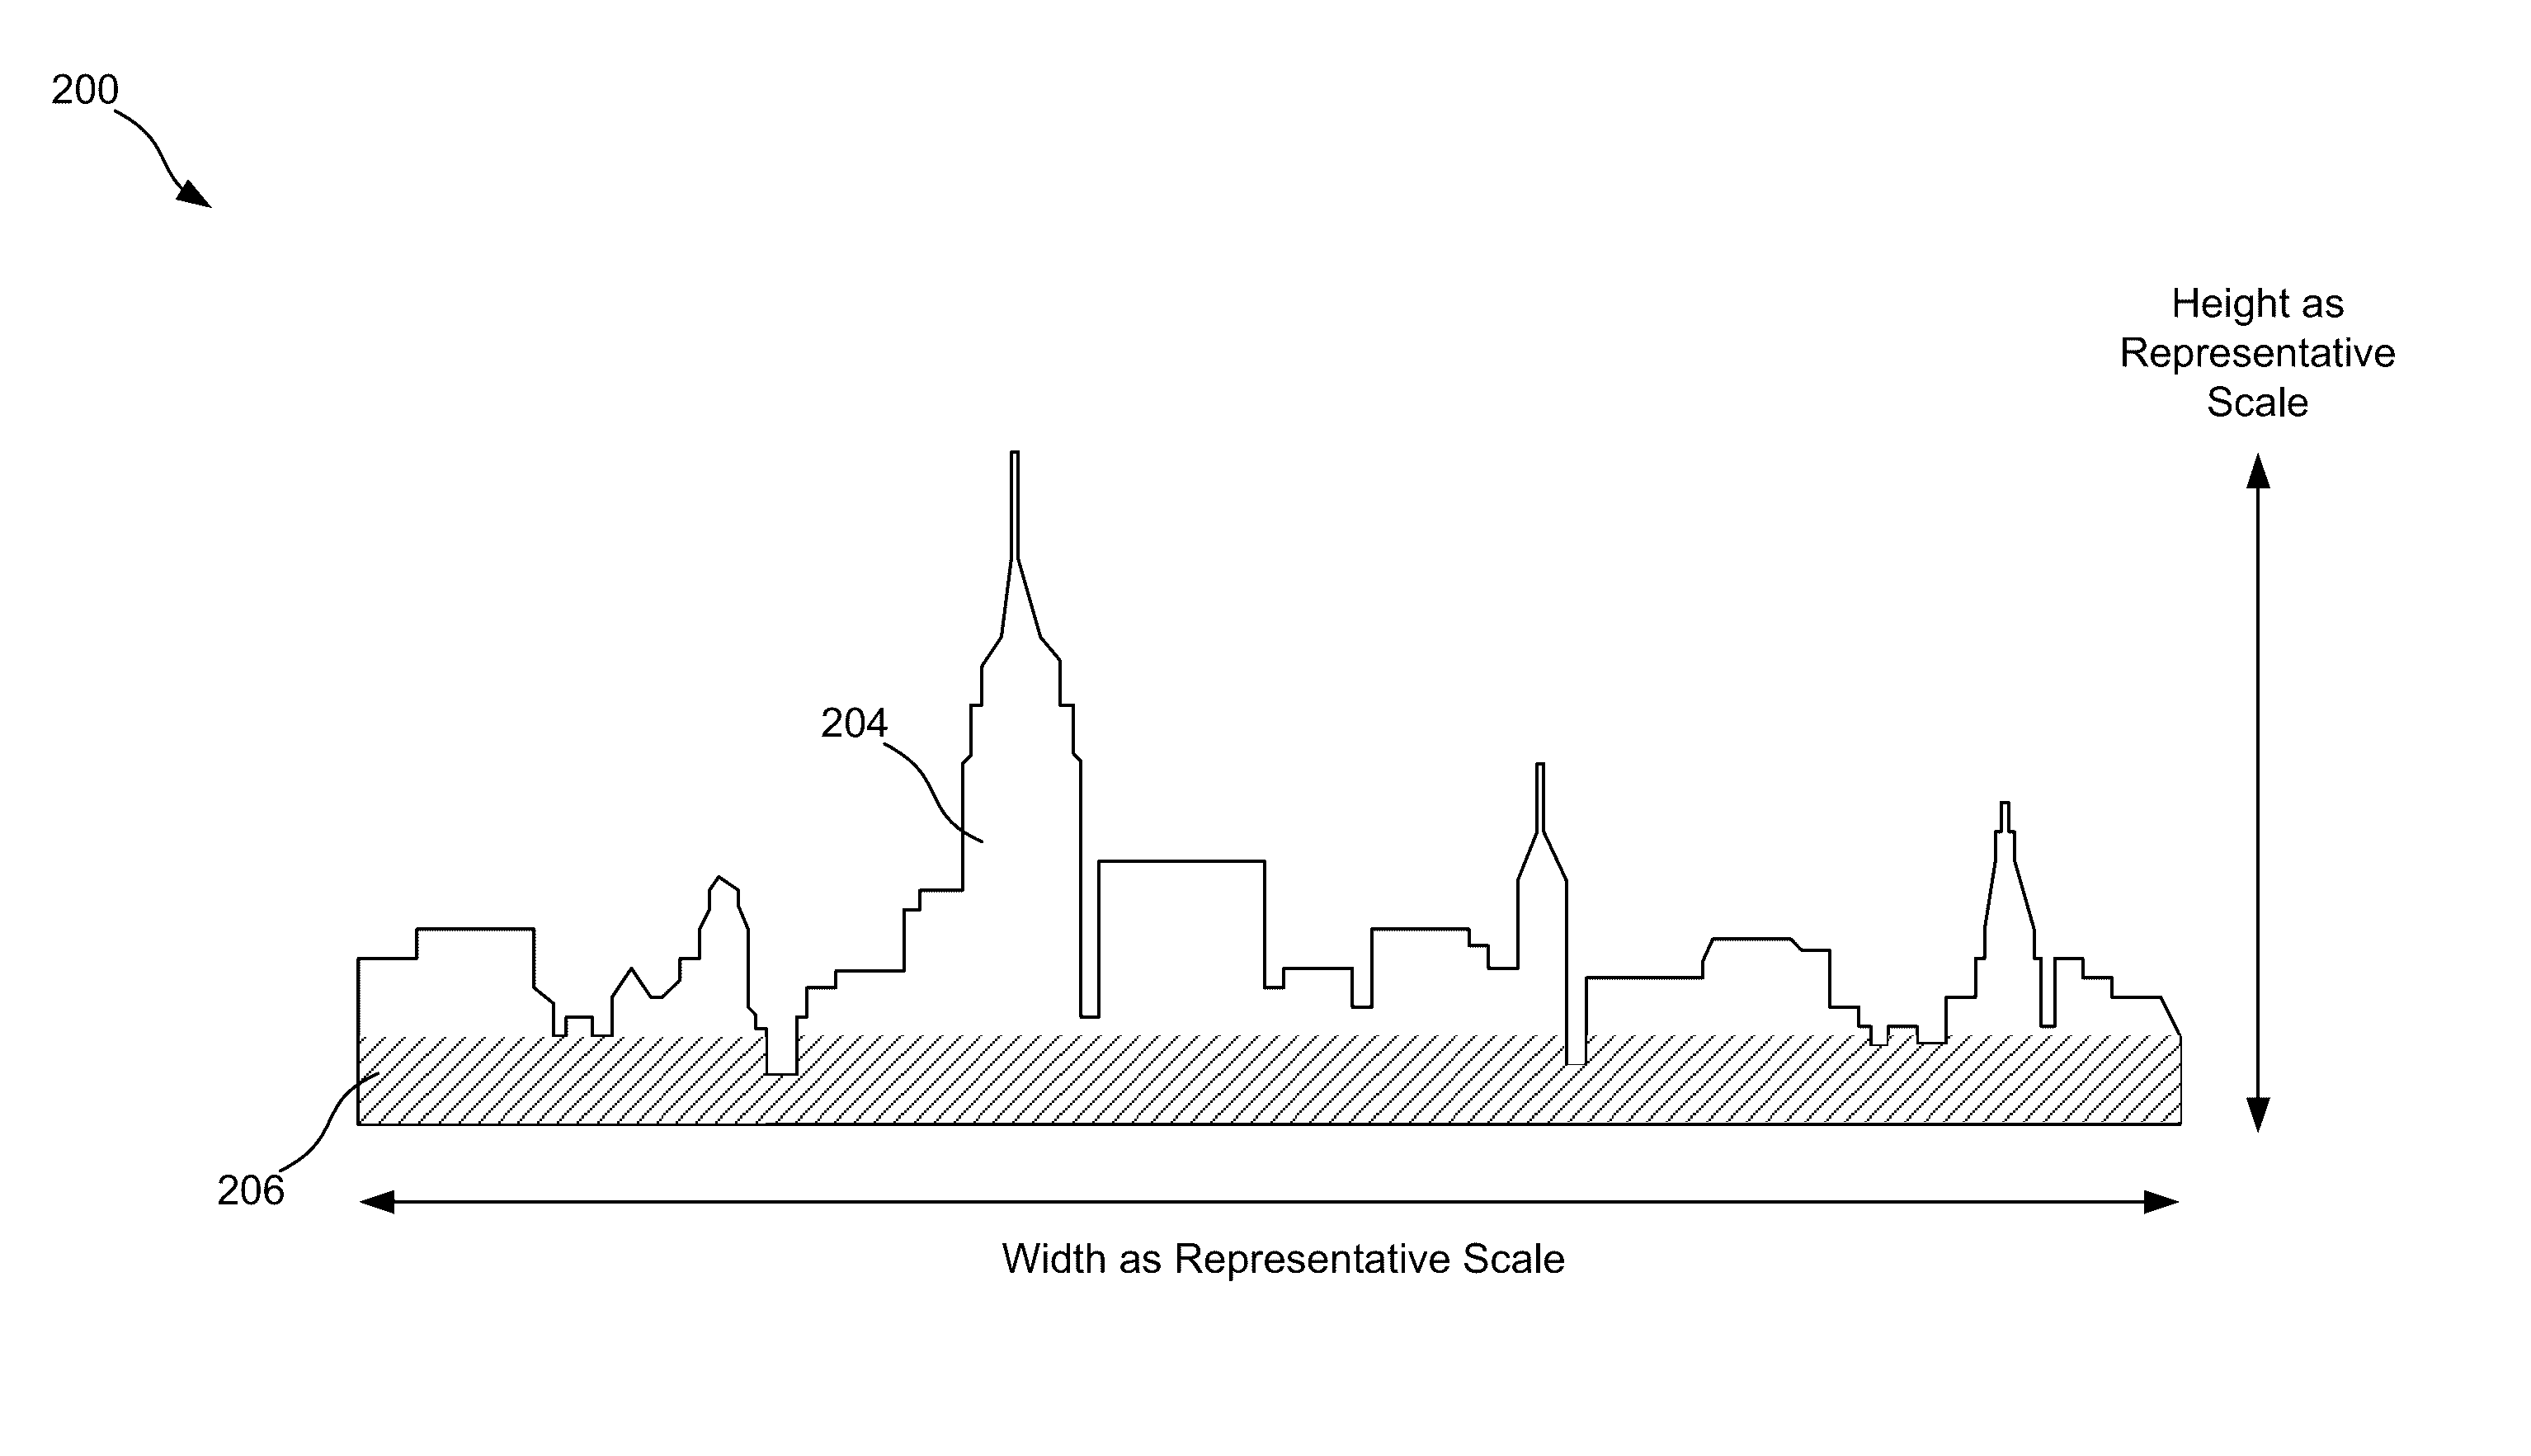
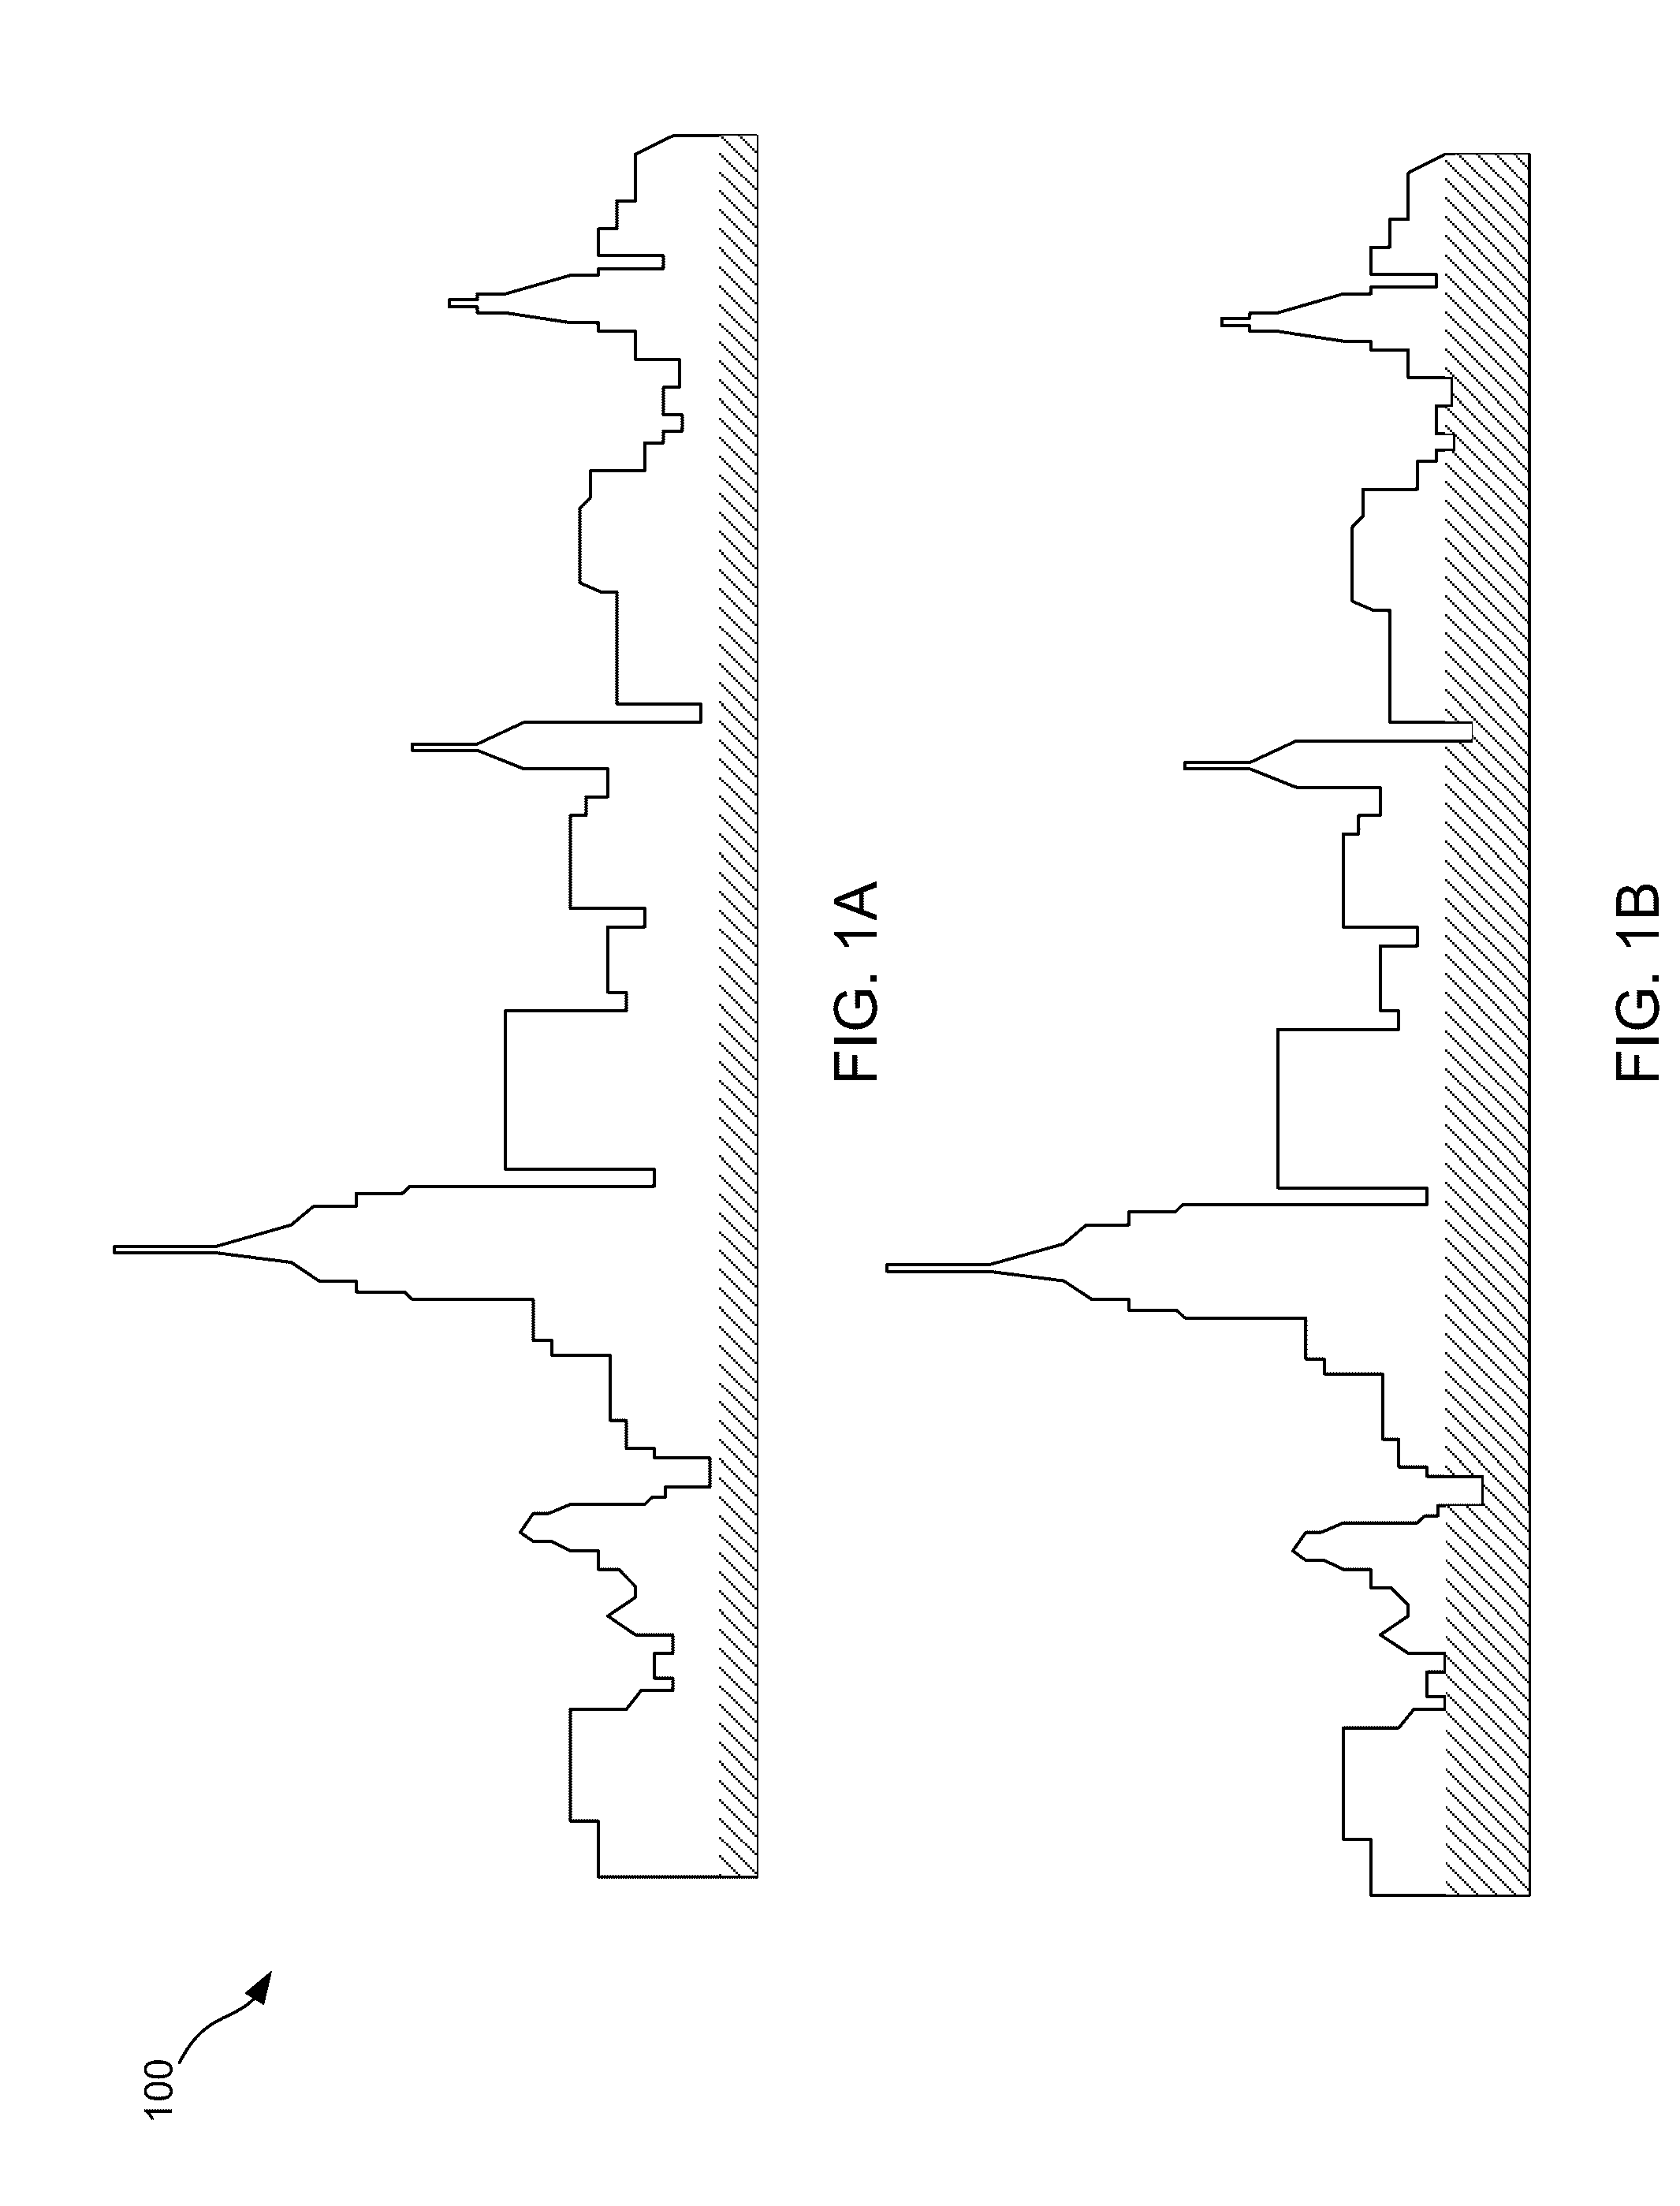
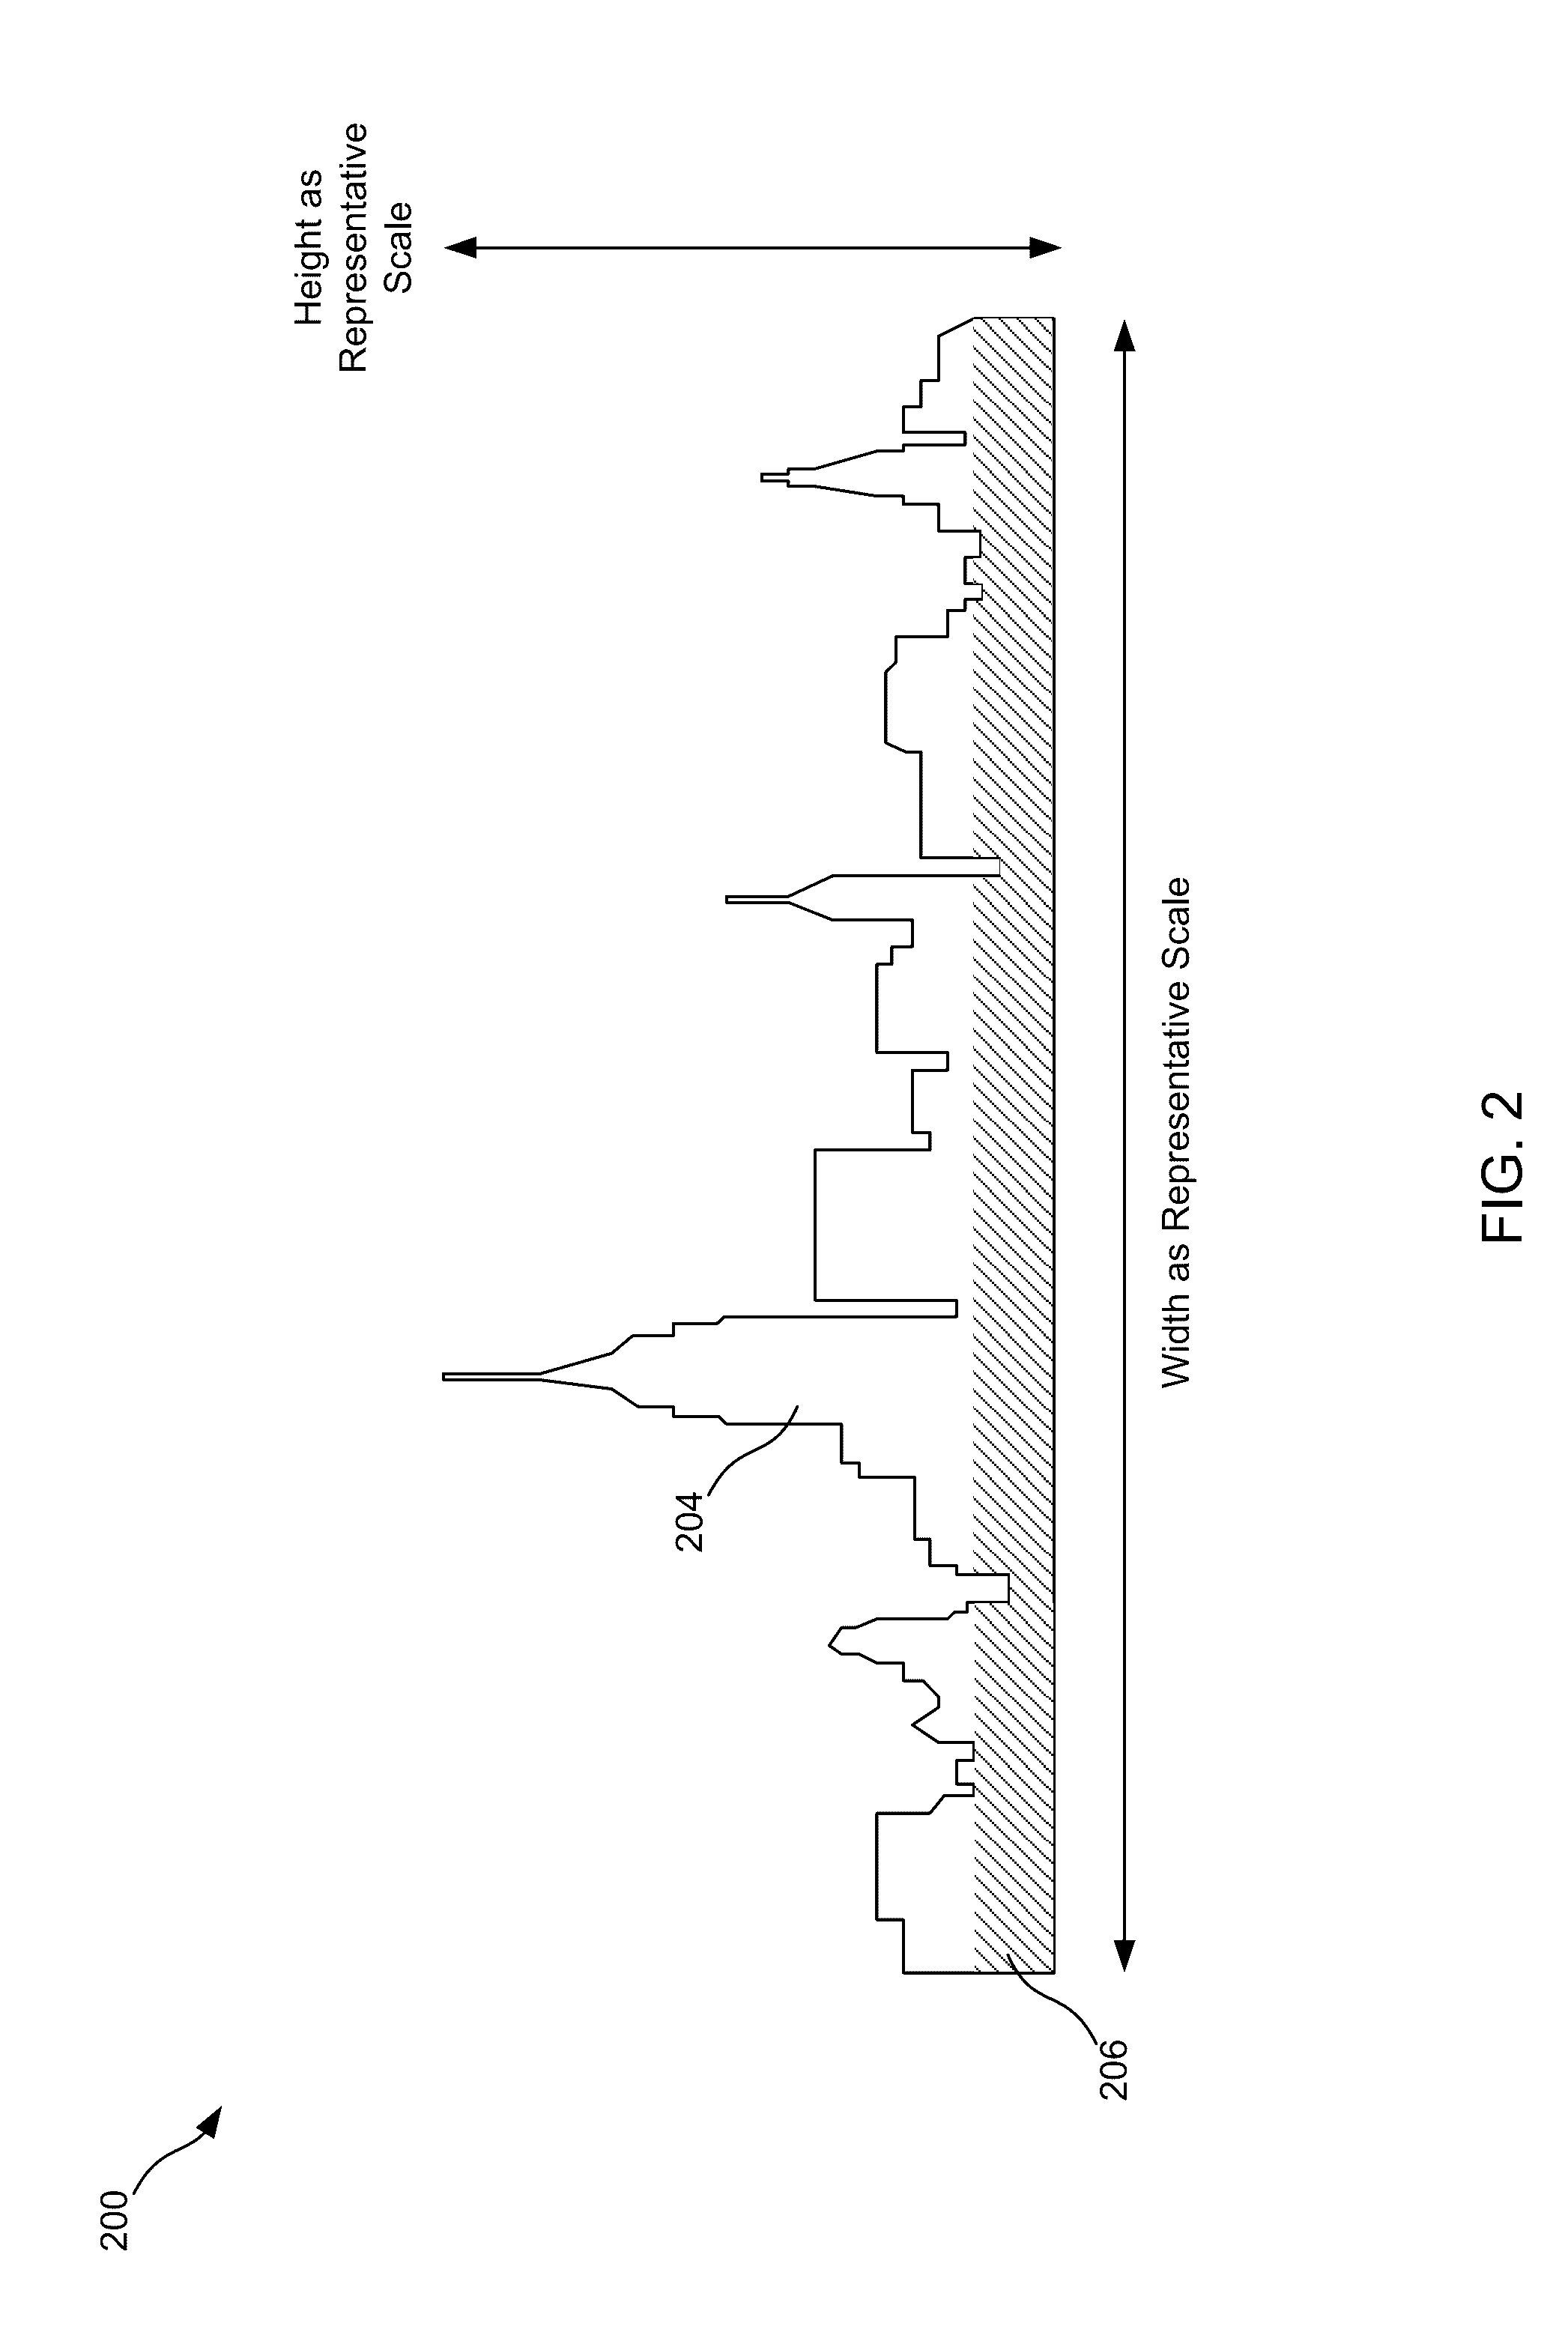
[0041]As noted in the Background, existing methods of creating infographics are either limited to simple shapes, such as the rectangles, circles, donuts, and pyramids that programmers have created via brute force scripting methods (e.g., using an equation to describe and fill a shape), or to complex shapes created by an artist that can only display previously-known data (i.e., at the time that an artist created the complex shapes). Yet, if one wants to fill a complex shape, such as a company logo, outline of a product, or geographic boundaries of sales regions with dynamic data that is ever changing, neither of the above solutions is viable. As a more specific example, take a company sales representative who wishes to show sales levels for different regions of the United States using an infographic of the United States. Traditional methods would require that an artist create images of the United States and the different sales regions, each using a different color, and a different im...


PUM


Abstract

This disclosure describes systems, methods, and apparatus for visualizing data. In particular, the present disclosure creates infographics for any complex shape. Thus, a user can provide a logo, symbol, photograph, drawing, etc. and this disclosure provides a way to turn the provided image into an infographic—or chart, where a shape or outline of the image is filled proportionally to data. Importantly, the fill level can vary with changing data and is thus not limited to data points known at a time when the infographic is created. Further, while simple shapes such as circles, donuts, and rectangles are fillable with dynamic data using existing scripts, there are so many additional and more complex shapes in existence that scripts cannot be written to account for all of these shapes. The present disclosure enables dynamic filling of shapes that cannot be filled using existing scripts.

Description

CLAIM OF PRIORITY UNDER 35 U.S.C. §120 and §119[0001]The present application for patent claims priority to U.S. patent application Ser. No. 14 / 680,032, published as U.S. Patent Publication No. 2015 / 0287227, and entitled “DYNAMIC FILLING OF SHAPES FOR GRAPHICAL DISPLAY OF DATA” filed Apr. 6, 2015, which is a non-provisional conversion of U.S. Provisional Application No. 61 / 975,880 entitled “DYNAMIC FILLING OF SHAPES FOR GRAPHICAL DISPLAY OF DATA” filed Apr. 6, 2014. Both of these applications are assigned to the assignee hereof and hereby expressly incorporated by reference herein.FIELD OF THE DISCLOSURE[0002]The present disclosure relates generally to data visualization. In particular, but not by way of limitation, the present disclosure relates to systems, methods and apparatuses for graphing data within silhouettes of relevant images.BACKGROUND[0003]Infographics, or the display of data using proportional numbers of symbols and / or partially filled silhouettes have long been practic...

Claims


Application Information

Patent Timeline
Patent Type & Authority Applications(United States)
IPC IPC(8): G06T11/20G06T11/40
CPCG06T11/206G06T2200/28G06T2210/36G06T11/40
Inventor REEVES, JONATHAN
Owner INSIGHTSOFTWARE COM INT
Why Eureka
Try Eureka