Identifying sources of anomalies in multi-variable metrics using linearization

a multi-variable, linearization technology, applied in error detection/correction, instruments, computing, etc., can solve the problems of complex and time-consuming task of determining why the anomaly occurred, increase in the number of times web page visitors play embedded video,

Active Publication Date: 2017-04-20
ADOBE INC
View PDF7 Cites 30 Cited by
  • Summary
  • Abstract
  • Description
  • Claims
  • Application Information

AI Technical Summary

Benefits of technology

[0009]One or more embodiments described herein provide benefits and/or solve one or more of the foregoing or other problems in the art with systems and methods that allow for the identification of contributing factors to analytic anomalies. More particularly, one or more embodiments involve identifying multi-variable metrics that contribute t

Problems solved by technology

Occasionally, data analytics reveals anomalies associated with a particular type of user action performed in connection with a website, web page, or client application.
Then, one day, web page visitors may play the embedded video 50 times. This increase in the number of times web page visitors play the embedded video is generally considered an anomaly because it is an outlier compared to the expected number of plays.
While administrators and marketers can gene

Method used


Image

  • Identifying sources of anomalies in multi-variable metrics using linearization
  • Identifying sources of anomalies in multi-variable metrics using linearization
  • Identifying sources of anomalies in multi-variable metrics using linearization

Examples


example environment

[0070

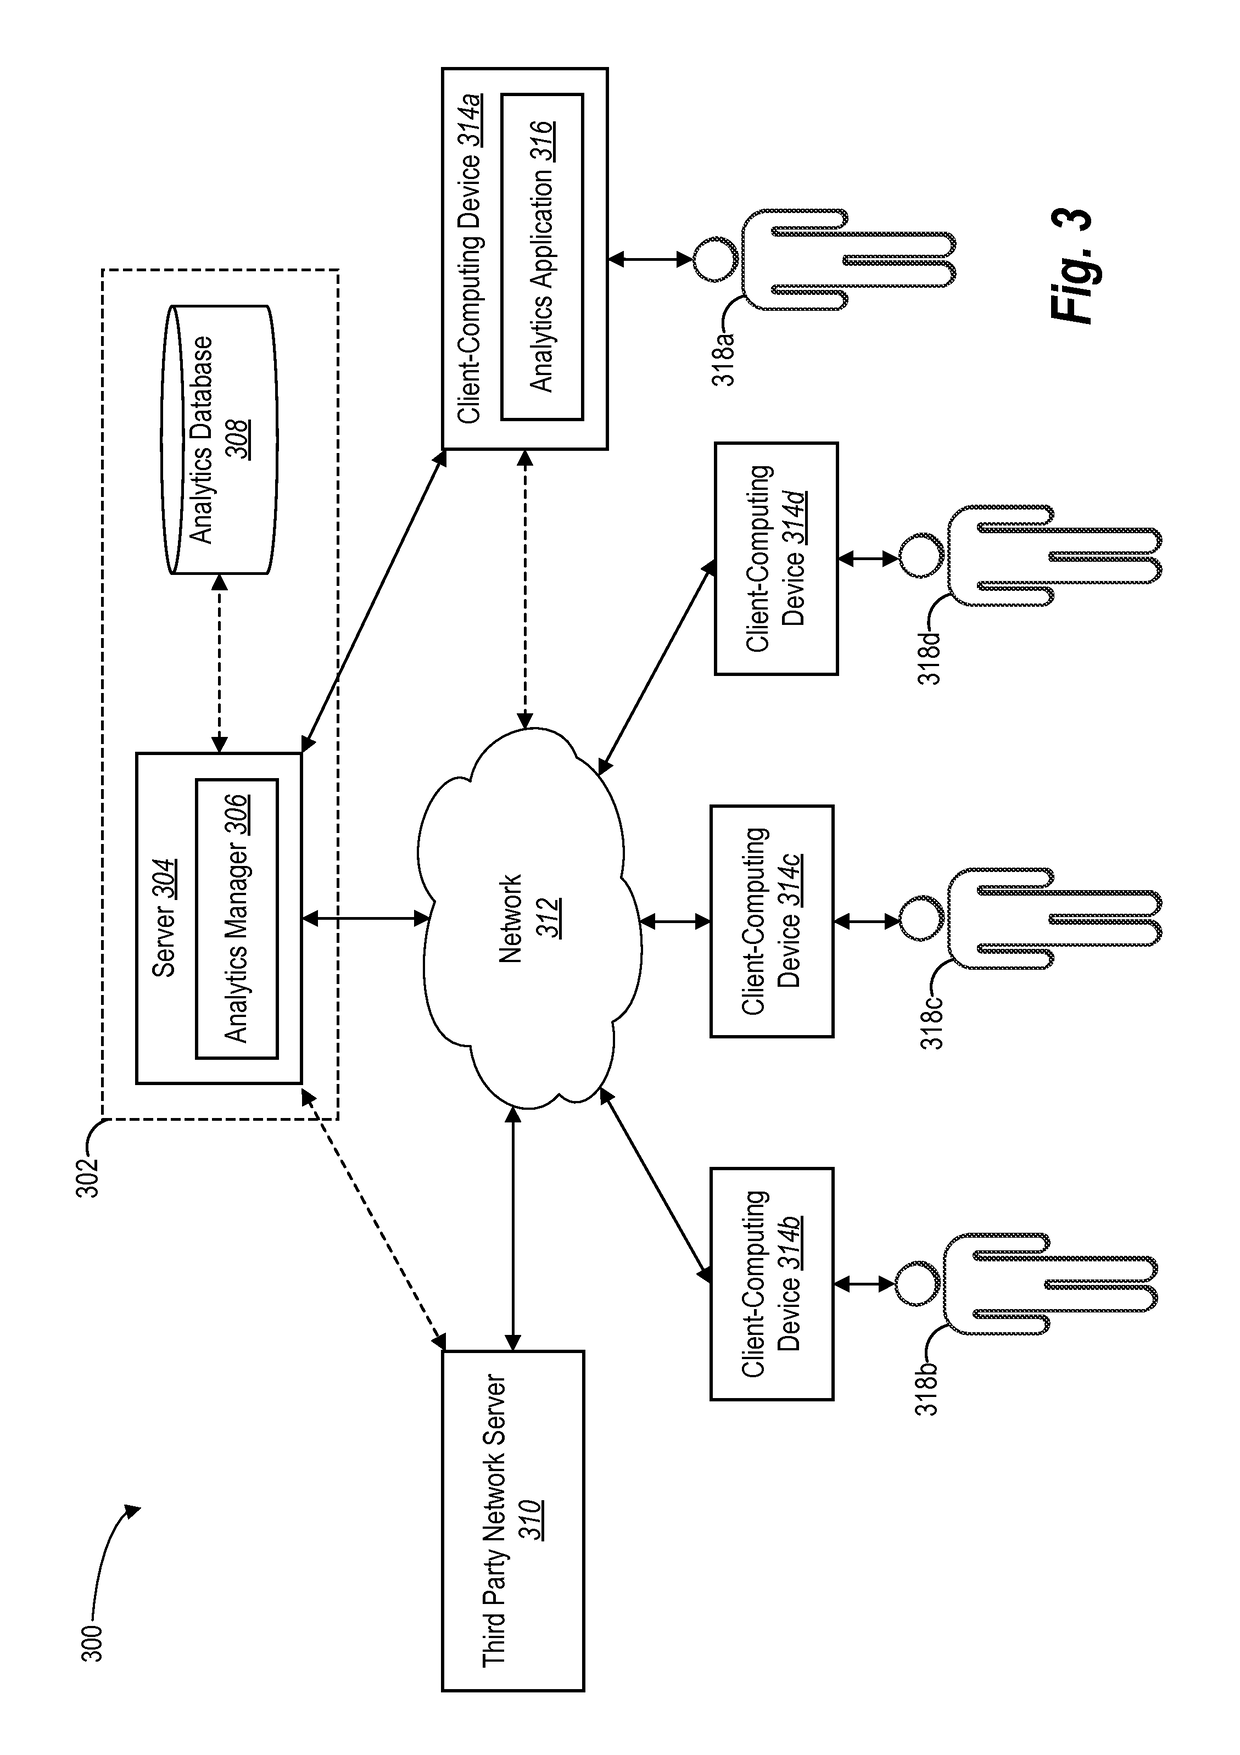
[0071]FIGS. 3 and 4 provide an overview of an analytics system environment and example architecture to provide context for the analytics system described above. FIG. 3 is a schematic diagram illustrating an analytics system 300 in accordance with one or more embodiments. As illustrated in FIG. 3, the analytics system 300 may include users 318a, 318b, 318c, and 318d, client-computing devices 314a, 314b, 314c, and 314d, a third-party network server 310 (e.g., a web server), and a network 312 (e.g., the Internet). As further illustrated in FIG. 3, the client-computing devices 314b-314d can communicate with the third-party network server 310 and the server 304 through the network 312. Although FIG. 3 illustrates a particular arrangement of the users 318a-318d, the client devices 314a-d, the network 312, the third-party network server 310, and the analysis system 300, various additional arrangements are possible. For example, the client devices 314b-314d may directly communicate wit...


PUM


Abstract

The present disclosure is directed toward systems and methods for identifying contributing factors associated with a multi-variable metric anomaly. One or more embodiments described herein identify one or more contributing factors that led to an anomaly in a multi-variable metric by calculating linearizing weights such that the total deviation in the multi-variable metric can be written as a weighted sum of deviations for dimension elements associated with the multi-variable metric.

Description

BACKGROUND[0001]1. Technical Field[0002]One or more embodiments described herein relate generally to enhancing analytical performance. More specifically, one or more embodiments relate to identifying contributing factors associated with a metric anomaly.[0003]2. Background and Relevant Art[0004]Network users access millions of websites daily for a variety of purposes. Network users access websites for purposes such as commerce, information, and entertainment. In fact, it is not uncommon for network users to conduct a large portion of their daily tasks (e.g., shopping, news, recipes, exercise) via various websites. Additionally, users access networks to transfer files, submit search queries, upload pictures and other electronic media, send social network posts, or to utilize various “web-enabled” devices. Users utilize various network connections and servers to perform these tasks in addition to countless other tasks.[0005]In light of widespread and daily network usage, administrator...

Claims


Application Information

Patent Timeline
IPC IPC(8): H04L29/08G06F11/34G06Q30/02
CPCH04L67/025G06F11/3409G06Q30/0201H04L67/22G06F11/3452H04L67/535H04L67/02H04L43/08H04L41/142
Inventor SAINI, SHIV KUMARSINHA, RITWIKRIMER, MICHAELN, ANANDHAVELU
Owner ADOBE INC
Why Eureka
Try Eureka