Risk event identification in maritime data and usage thereof

a risk event and data technology, applied in the field of data analysis, can solve the problems of difficult deciphering and large-scale use of is data, and achieve the effect of increasing false positive metrics

Active Publication Date: 2020-06-11
WINDWARD
View PDF0 Cites 18 Cited by
  • Summary
  • Abstract
  • Description
  • Claims
  • Application Information

AI Technical Summary

Benefits of technology

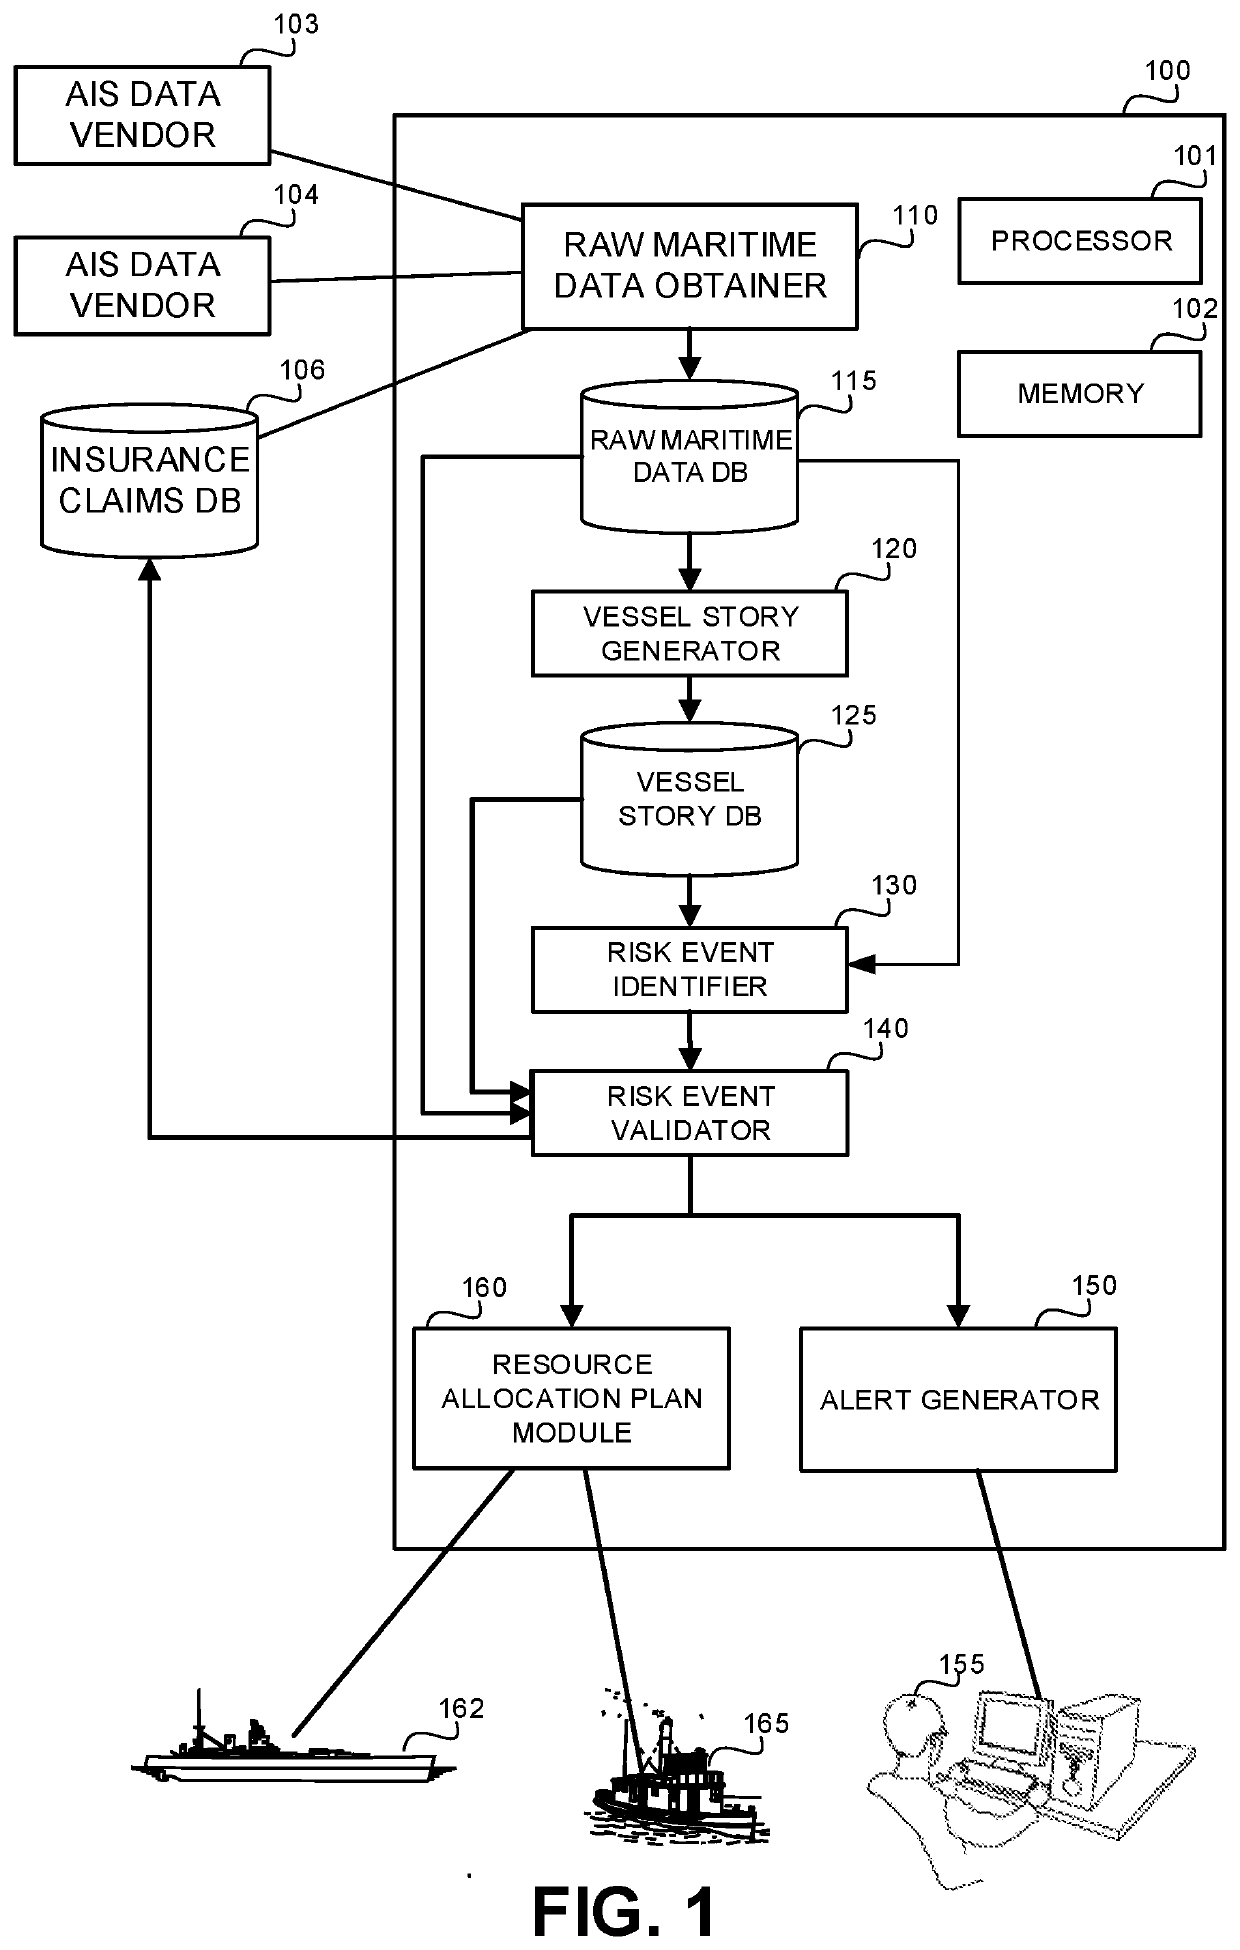
[0005]One exemplary embodiment of the disclosed subject matter is an apparatus comprising: a memory, wherein said memory retaining raw maritime data, wherein the raw maritime data is indicative of a geolocation of vessels at different times, wherein the raw maritime data comprises duplicative data obtained from separate sources; a processor configured to: analyze the raw maritime data to produce for each vessel a vessel story, wherein the vessel story comprises a set of activities and corresponding timestamps, wherein the set of activities are deduced from the raw maritime data, wherein the set of activities associated with the each vessel is smaller by at least one order of magnitude than the raw maritime data associated with the each vessel; identify a pattern in the vessel story associated with a vessel, wherein the pattern conforms with a risk event; and validate the risk event using the raw maritime data or using one or more vessel stories; whereby identifying the risk event using reduced resources in comparison with resources required to identify the risk event in the raw maritime data, and without increasing false positive metrics.
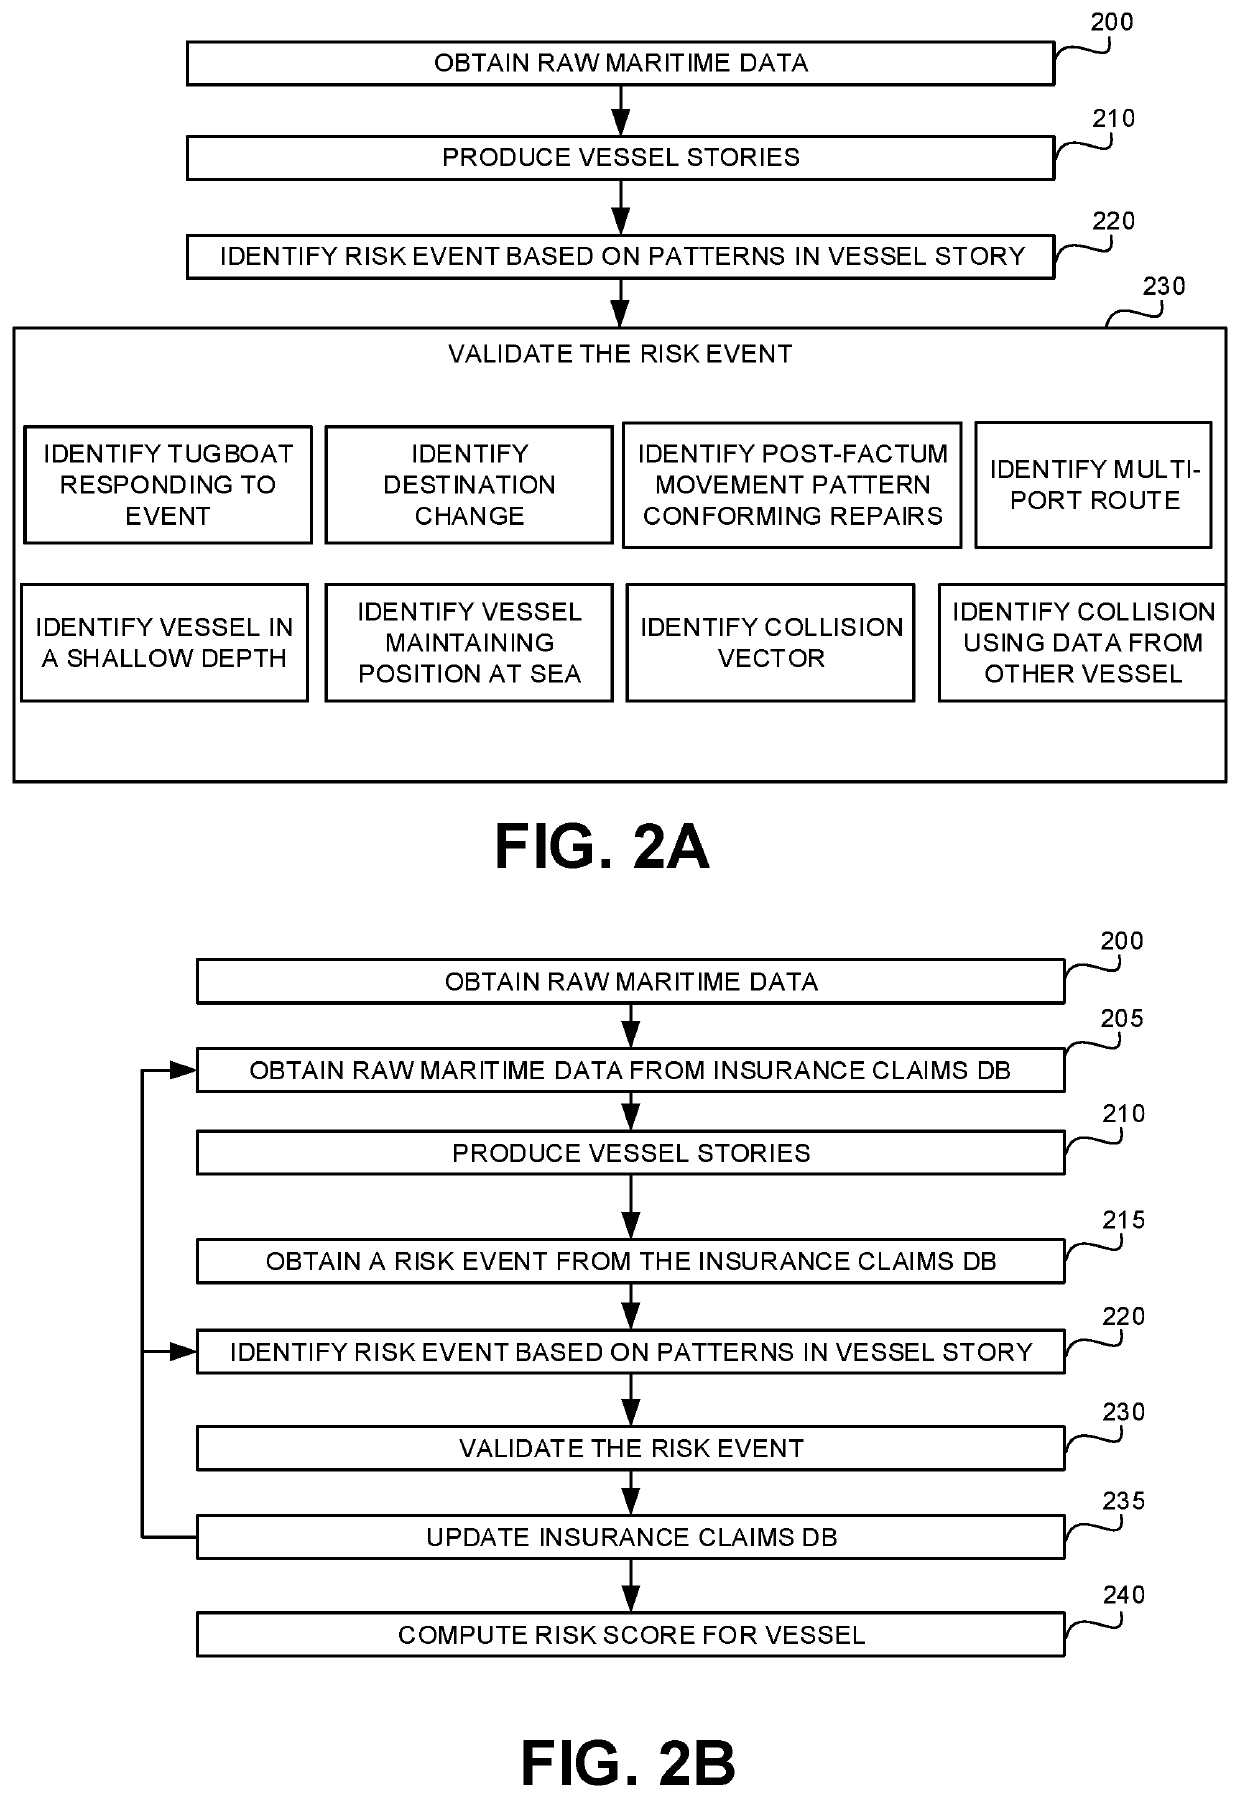
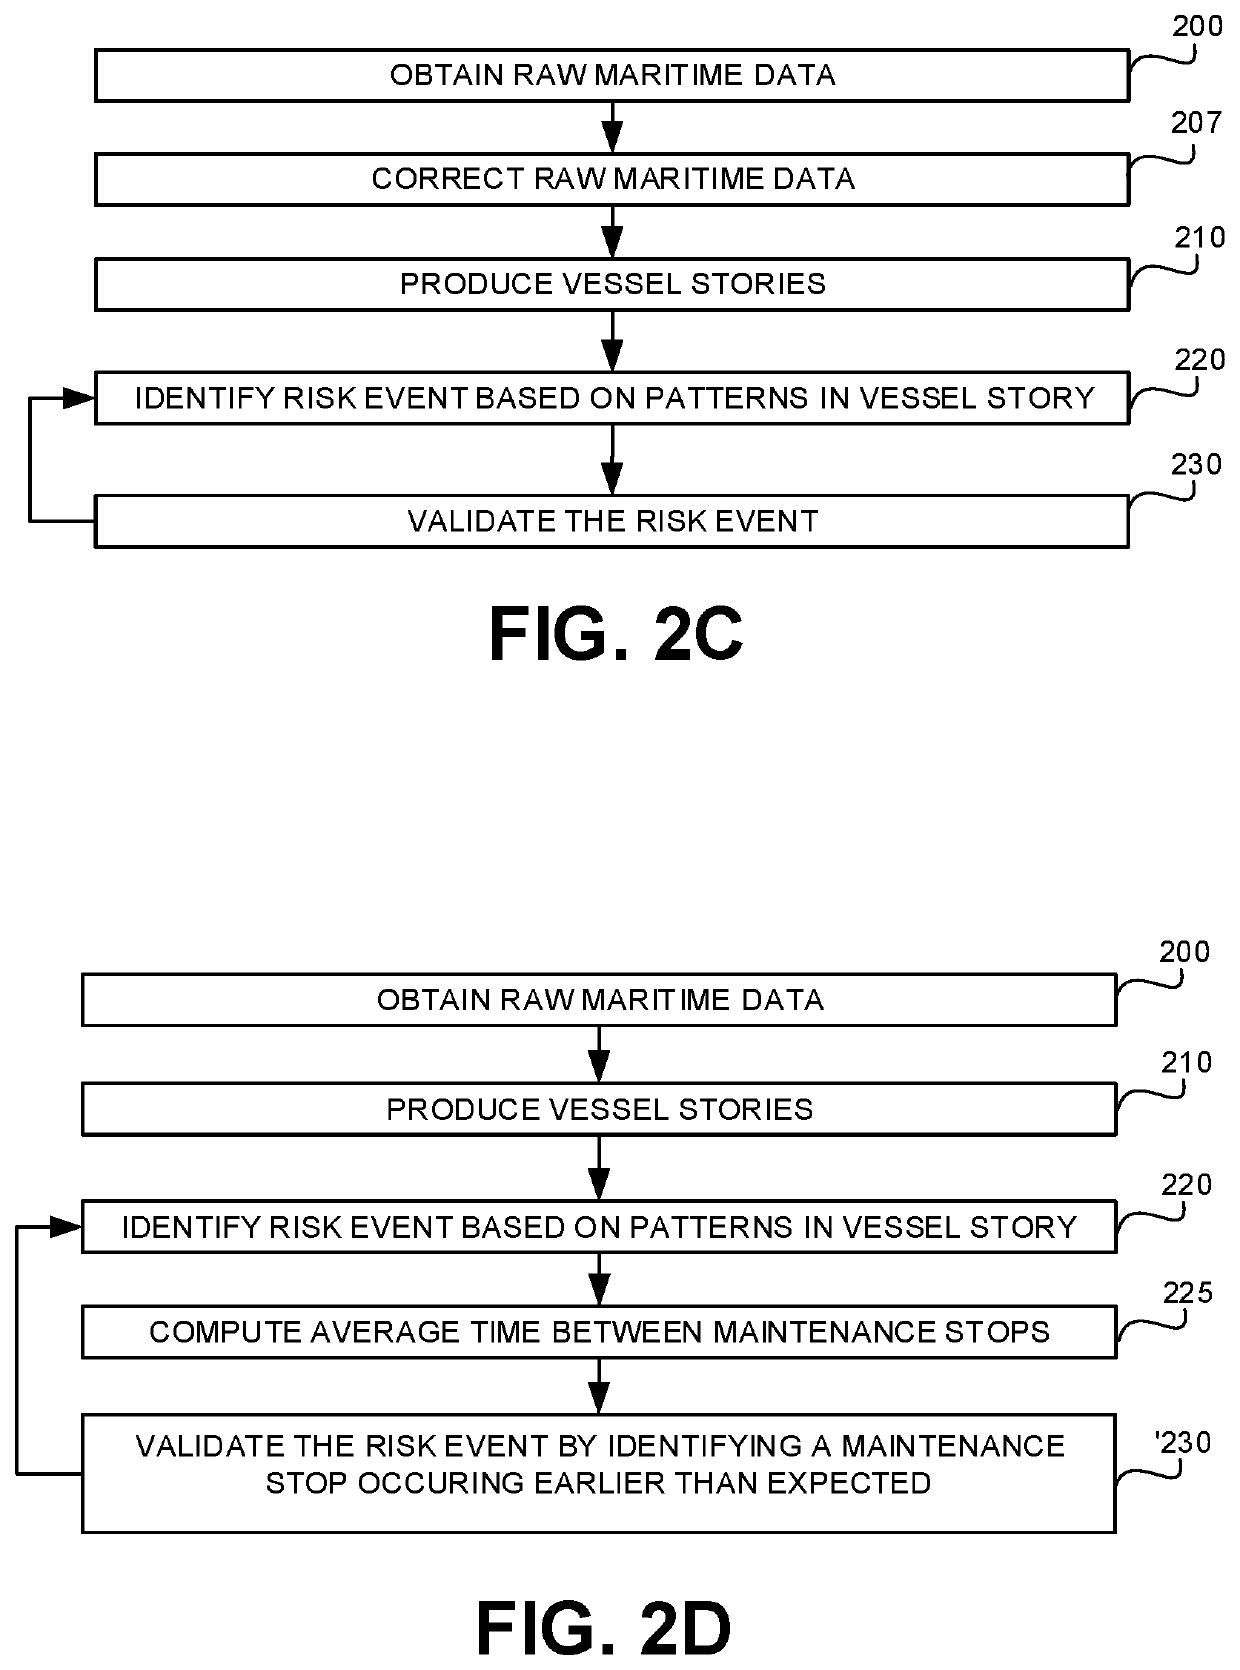
[0022]Another exemplary embodiment of the disclosed subject matter is a method comprising: obtaining raw maritime data from a plurality of sources, wherein the raw maritime data is indicative of a geolocation of vessels at different times, wherein the raw maritime data comprises duplicative data obtained from separate sources; analyzing the raw maritime data to produce for each vessel a vessel story, wherein the vessel story comprises a set of activities and corresponding timestamps, wherein the set of activities are deduced from the raw maritime data, wherein the set of activities associated with the each vessel is smaller by at least one order of magnitude than the raw maritime data associated with the each vessel; identifying a pattern in the vessel story associated with a vessel, wherein the pattern conforms with a risk event; and validating the risk event using the raw maritime data or one or more vessel stories; whereby identifying the risk event using reduced resources in comparison with resources required to identify the risk event in the raw maritime data without increasing false positive metrics.
[0030]Yet another exemplary embodiment of the disclosed subject matter is a method comprising: obtaining raw maritime data from a plurality of sources, wherein the raw maritime data is indicative of a geolocation of vessels at different times, wherein the raw maritime data comprises duplicative data obtained from separate sources; analyzing the raw maritime data to produce for each vessel a vessel story, wherein the vessel story comprises a set of activities and corresponding timestamps, wherein the set of activities are deduced from the raw maritime data, wherein the set of activities associated with the each vessel is smaller by at least one order of magnitude than the raw maritime data associated with the each vessel; identifying a pattern in the vessel story associated with a first vessel, wherein the pattern conforms with a risk event; and validating the risk event using the vessel story associated with a second vessel, wherein the second vessel story is consistent with the risk event occurring to the first vessel; whereby identifying the risk event using reduced resources in comparison with resources required to identify the risk event in the raw maritime data without increasing false positive metrics.
[0034]Optionally, said validating comprises: filtering from the plurality of vessels a subset of vessels, wherein the subset of vessels are vessels that at the time of the risk event or within a time window thereafter are located in proximity to the first vessel; examining vessel stories of each vessel in the subset of vessels to detect the second vessel, whereby checking consistency of vessel stories with the risk event occurring to the first vessel for a reduced number of vessels, whereby reducing computational resources required for said validating.
[0035]Yet another exemplary embodiment of the disclosed subject matter is a non-transitory computer readable medium retaining program instructions, which program instructions when read by a processor, cause the processor to perform a method comprising: obtaining raw maritime data from a plurality of sources, wherein the raw maritime data is indicative of a geolocation of vessels at different times, wherein the raw maritime data comprises duplicative data obtained from separate sources; analyzing the raw maritime data to produce for each vessel a vessel story, wherein the vessel story comprises a set of activities and corresponding timestamps, wherein the set of activities are deduced from the raw maritime data, wherein the set of activities associated with the each vessel is smaller by at least one order of magnitude than the raw maritime data associated with the each vessel; identifying a pattern in the vessel story associated with a vessel, wherein the pattern conforms with a risk event; and validating the risk event using the raw maritime data or one or more vessel stories; whereby identifying the risk event using reduced resources in comparison with resources required to identify the risk event in the raw maritime data without increasing false positive metrics.

Problems solved by technology

Because of this and other reasons, AIS data may be hard to decipher and utilize on a large scale basis.
Similar issues exist with other information sources, such as, for example, VHF Data Exchange Systems (VDES).

Method used


Image

  • Risk event identification in maritime data and usage thereof
  • Risk event identification in maritime data and usage thereof
  • Risk event identification in maritime data and usage thereof

Examples


example

(5)

[0111]Consider the activity of a name change at sea. In order to deduce such activity for a vessel, a first activity of a ship A stopped transmitted at location X and a second activity of a ship B (with that changed name) started transmitting at location X may be determined and used to generate the name change activity. In some cases, the two activities may be at different locations where the distance therebetween is consistent with the travel time of that single vessel. Additionally or alternatively, it may be verified that both ship A and ship B have the same characteristics, such as type of vessel, draught information, or the like.

[0112]In some exemplary embodiments, Vessel Story Generator 120 may create the activities, and then, for every vessel, the raw data is transformed into a vessel story that is retained in Vessel Story Database 125. A Vessel Story User Interface (not shown) may graphically display the path of the vessel. On it, the vessel story may be presented by show...


PUM


Abstract

Method, system and product for risk event identification in maritime data and usage thereof. Ram maritime data is analyzed to produce for each vessel a vessel story. The vessel story comprises a set of activities and corresponding timestamps, that are deduced from the raw maritime data. A pattern, that conforms with a risk event, in the vessel story associated with a vessel. The risk event is validated using the raw maritime data or using one or more vessel stories. So, the risk event is identified using reduced resources in comparison with resources required to identify the risk event in the raw maritime data, and without increasing false positive metrics. Additionally, or alternatively, a pattern, that conforms with a risk event, in the vessel story associated with a first vessel is identified. The risk event is validated using the vessel story associated with a second vessel. So, the risk event is identified using reduced resources in comparison with resources required to identify the risk event in the raw maritime data without increasing false positive metrics.

Description

TECHNICAL FIELD[0001]The present disclosure relates to data analysis in general, and to big data analysis of maritime-related data, in particular.BACKGROUND[0002]Vessel tracking may be achieved through the use of the Automatic Identification System (AIS).[0003]Information provided by AIS equipment, such as identification, position, course, and speed, can be displayed on a screen or an Electronic Chart Display and Information System (ECDIS). AIS is intended to assist a vessel's watchstanding officers and allow maritime authorities to track and monitor vessel movements. AIS integrates a standardized VHF transceiver with a positioning system such as a GPS receiver, with other electronic navigation sensors, such as a gyrocompass or rate of turn indicator. Vessels fitted with AIS transceivers can be tracked by AIS base stations located along coast lines or, when out of range of terrestrial networks, through satellites that are fitted with AIS receivers.[0004]AIS messages comprise an Mari...

Claims


Application Information

Patent Timeline
Patent Type & Authority Applications(United States)
IPC IPC(8): G08G3/02B63B43/18B63B21/66G07C5/00H04W4/029G06F17/18
CPCB63B43/18G07C5/006G07C5/008G06F17/18B63B21/66H04W4/029G08G3/02B63B79/20B63B79/40B63B79/30
Inventor MAZOR, YAIRBENYAMINI, TOMERROKNI, OMIDSOVRAN, IDOHOFFMAN, YONITMEODED, YANIVABELES, ROTEMATIAS, ILANBOCHARENKO, MAKSIM
Owner WINDWARD
Why Eureka
Try Eureka