System and method for interactive grouping of pie chart slices

a pie chart and interactive technology, applied in the field of system and method for interactive grouping of pie chart slices, can solve the problems of skewing the overall presentation, difficult placement of labels, and less than satisfactory layout of the remaining slices

Inactive Publication Date: 2005-12-06
MICROSOFT TECH LICENSING LLC
View PDF11 Cites 19 Cited by
  • Summary
  • Abstract
  • Description
  • Claims
  • Application Information

AI Technical Summary

Benefits of technology

[0005]The present invention is directed at a system and method for grouping elements whose data falls below a grouping threshold, and displaying the grouped elements as a single portion of a graphical chart. Briefly stated, the system and method allow a user to dynamically increase a grouping threshold from a default value to an adjusted value. The data for each elements falling below the adjusted grouping threshold is aggregated. The grouped elements are then displayed as a single slice with a value of the aggregated data rather than being displayed as individual slices. In this way, several smaller slices may be displayed as a group, thereby eliminating the distraction of having smaller elements dispersed among elements of greater value.

Problems solved by technology

However, at least in the case of a pie chart, those smaller elements cannot be simply eliminated because to do so would skew the overall presentation.
In addition, labels are difficult to place on such a pie chart because an appealing layout for the few dominant slices may result in a less than satisfactory layout for the remaining slices.
Users today have few options to address these issues.
However, these solutions do not make the user experience pleasant or it distorts the data.
Unfortunately, an acceptable solution to these issues has eluded those skilled in the art.

Method used


Image

  • System and method for interactive grouping of pie chart slices
  • System and method for interactive grouping of pie chart slices
  • System and method for interactive grouping of pie chart slices

Examples


Embodiment Construction

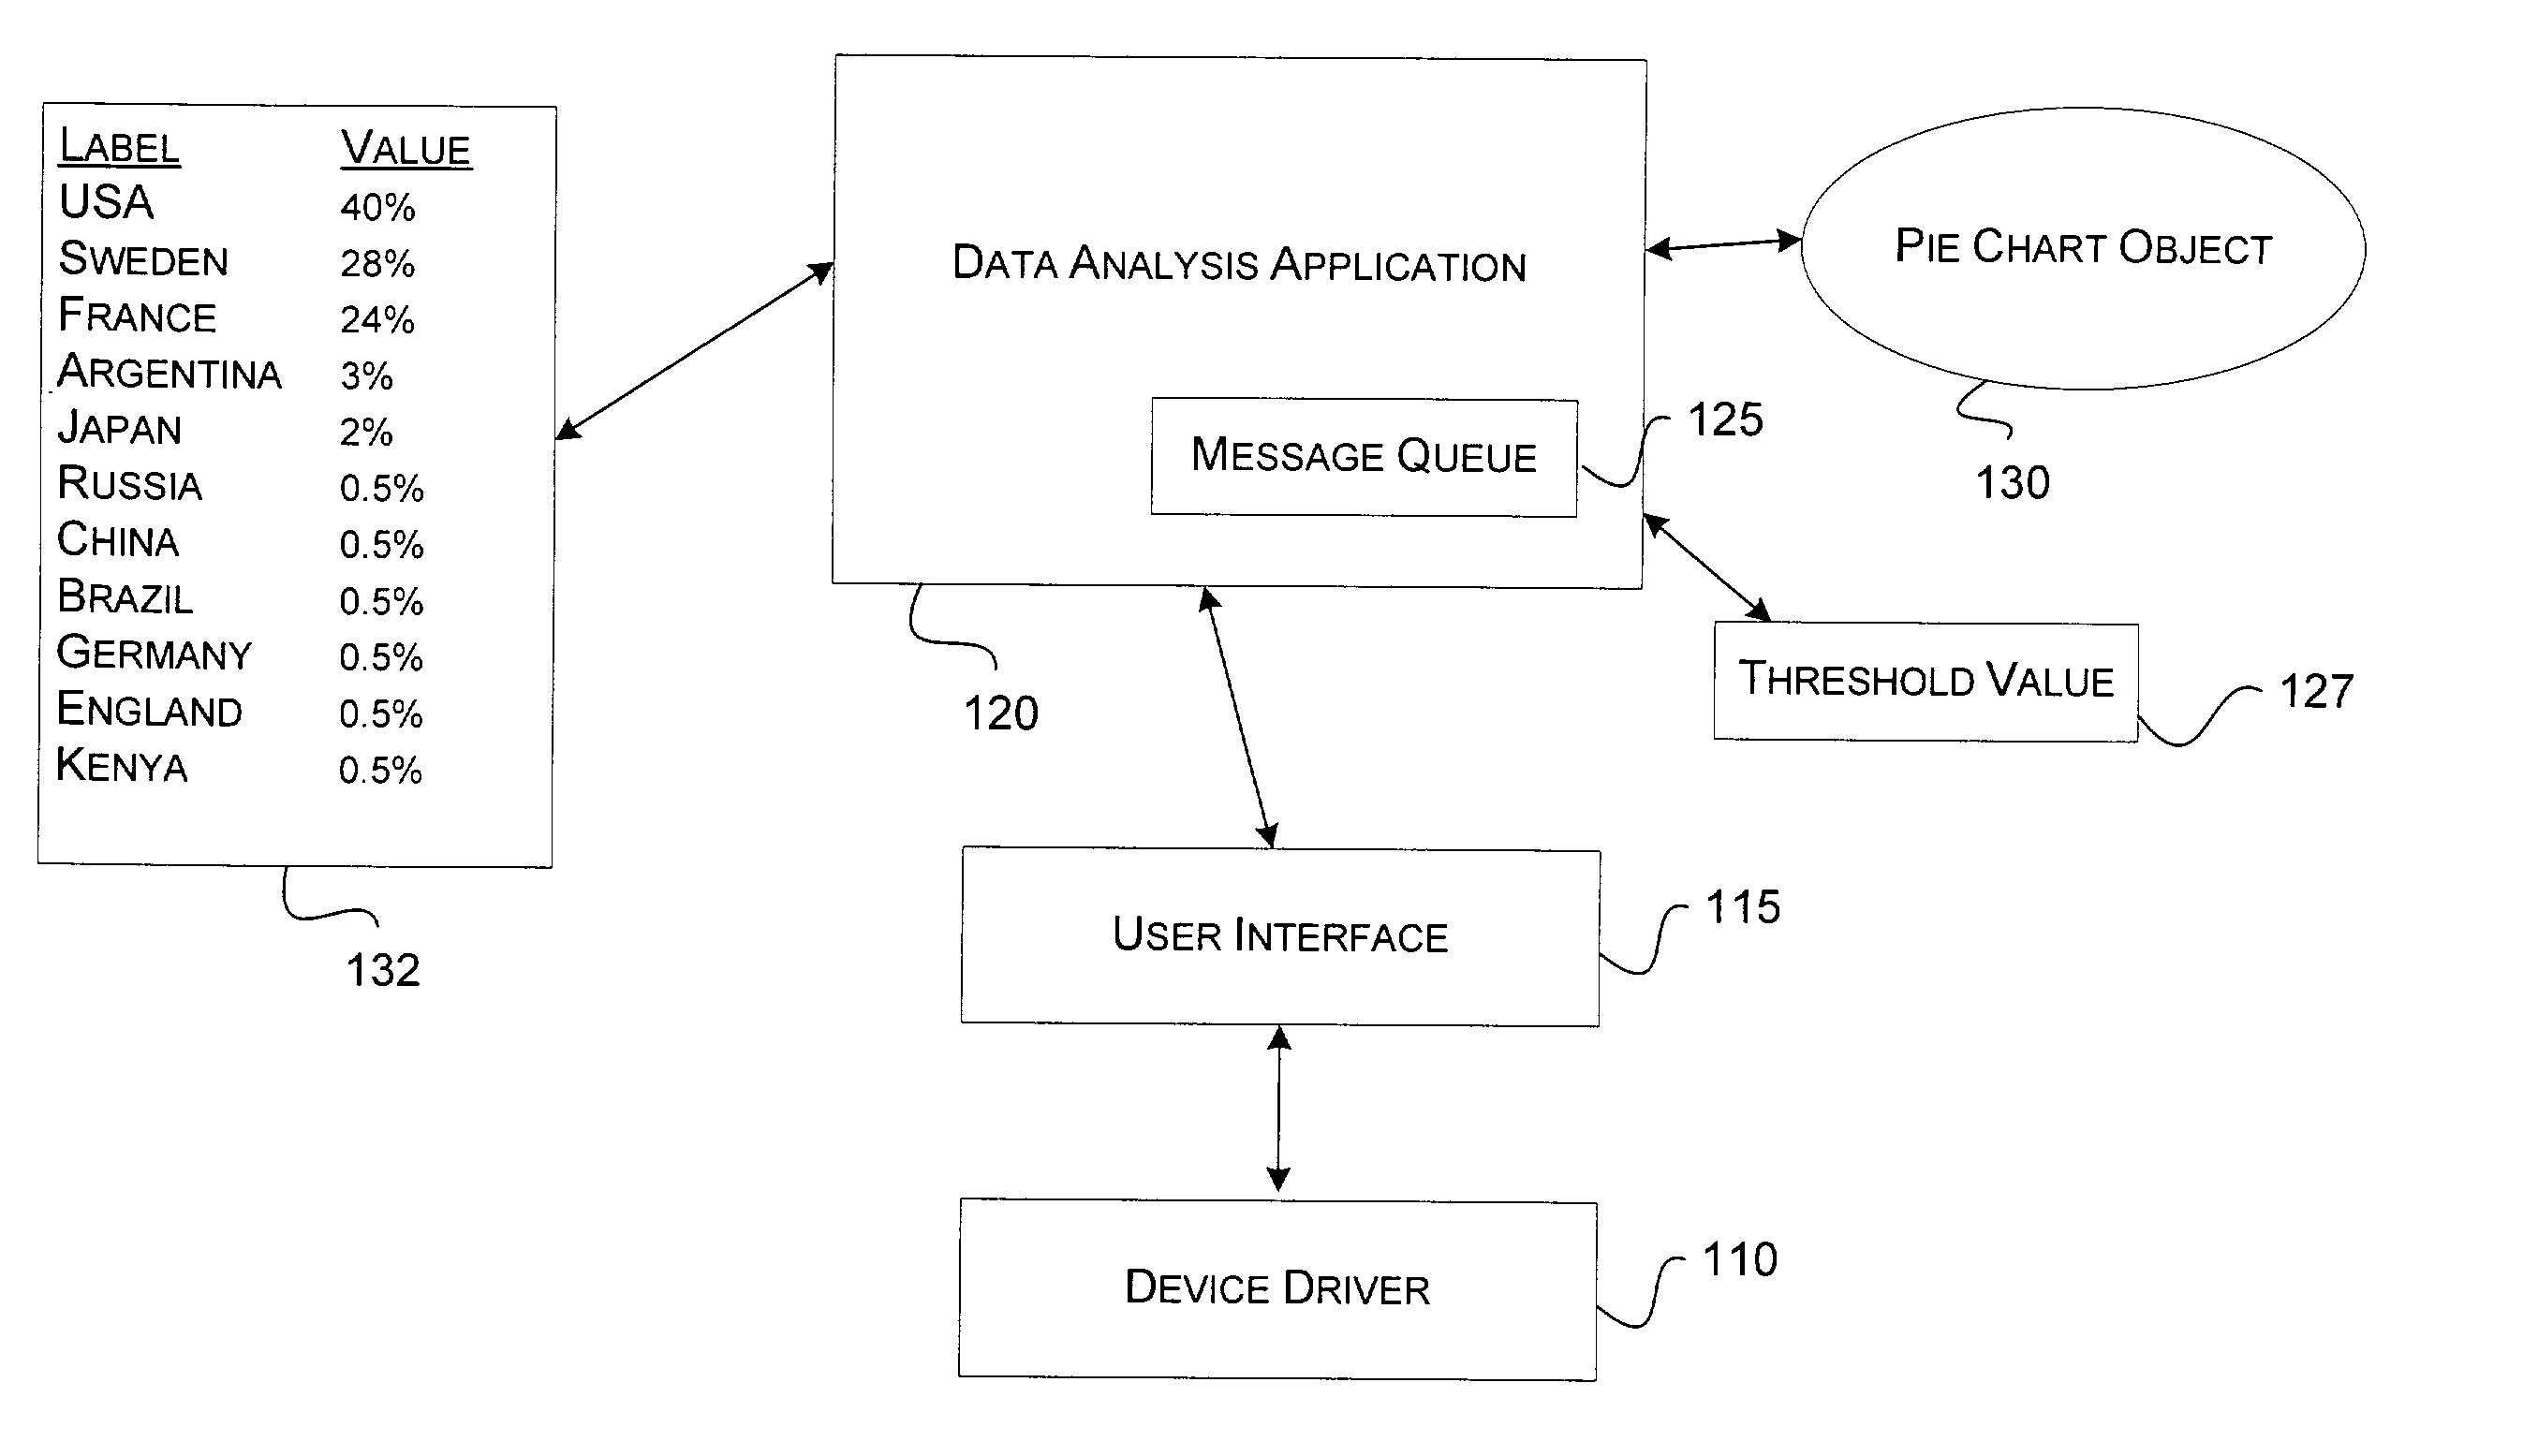
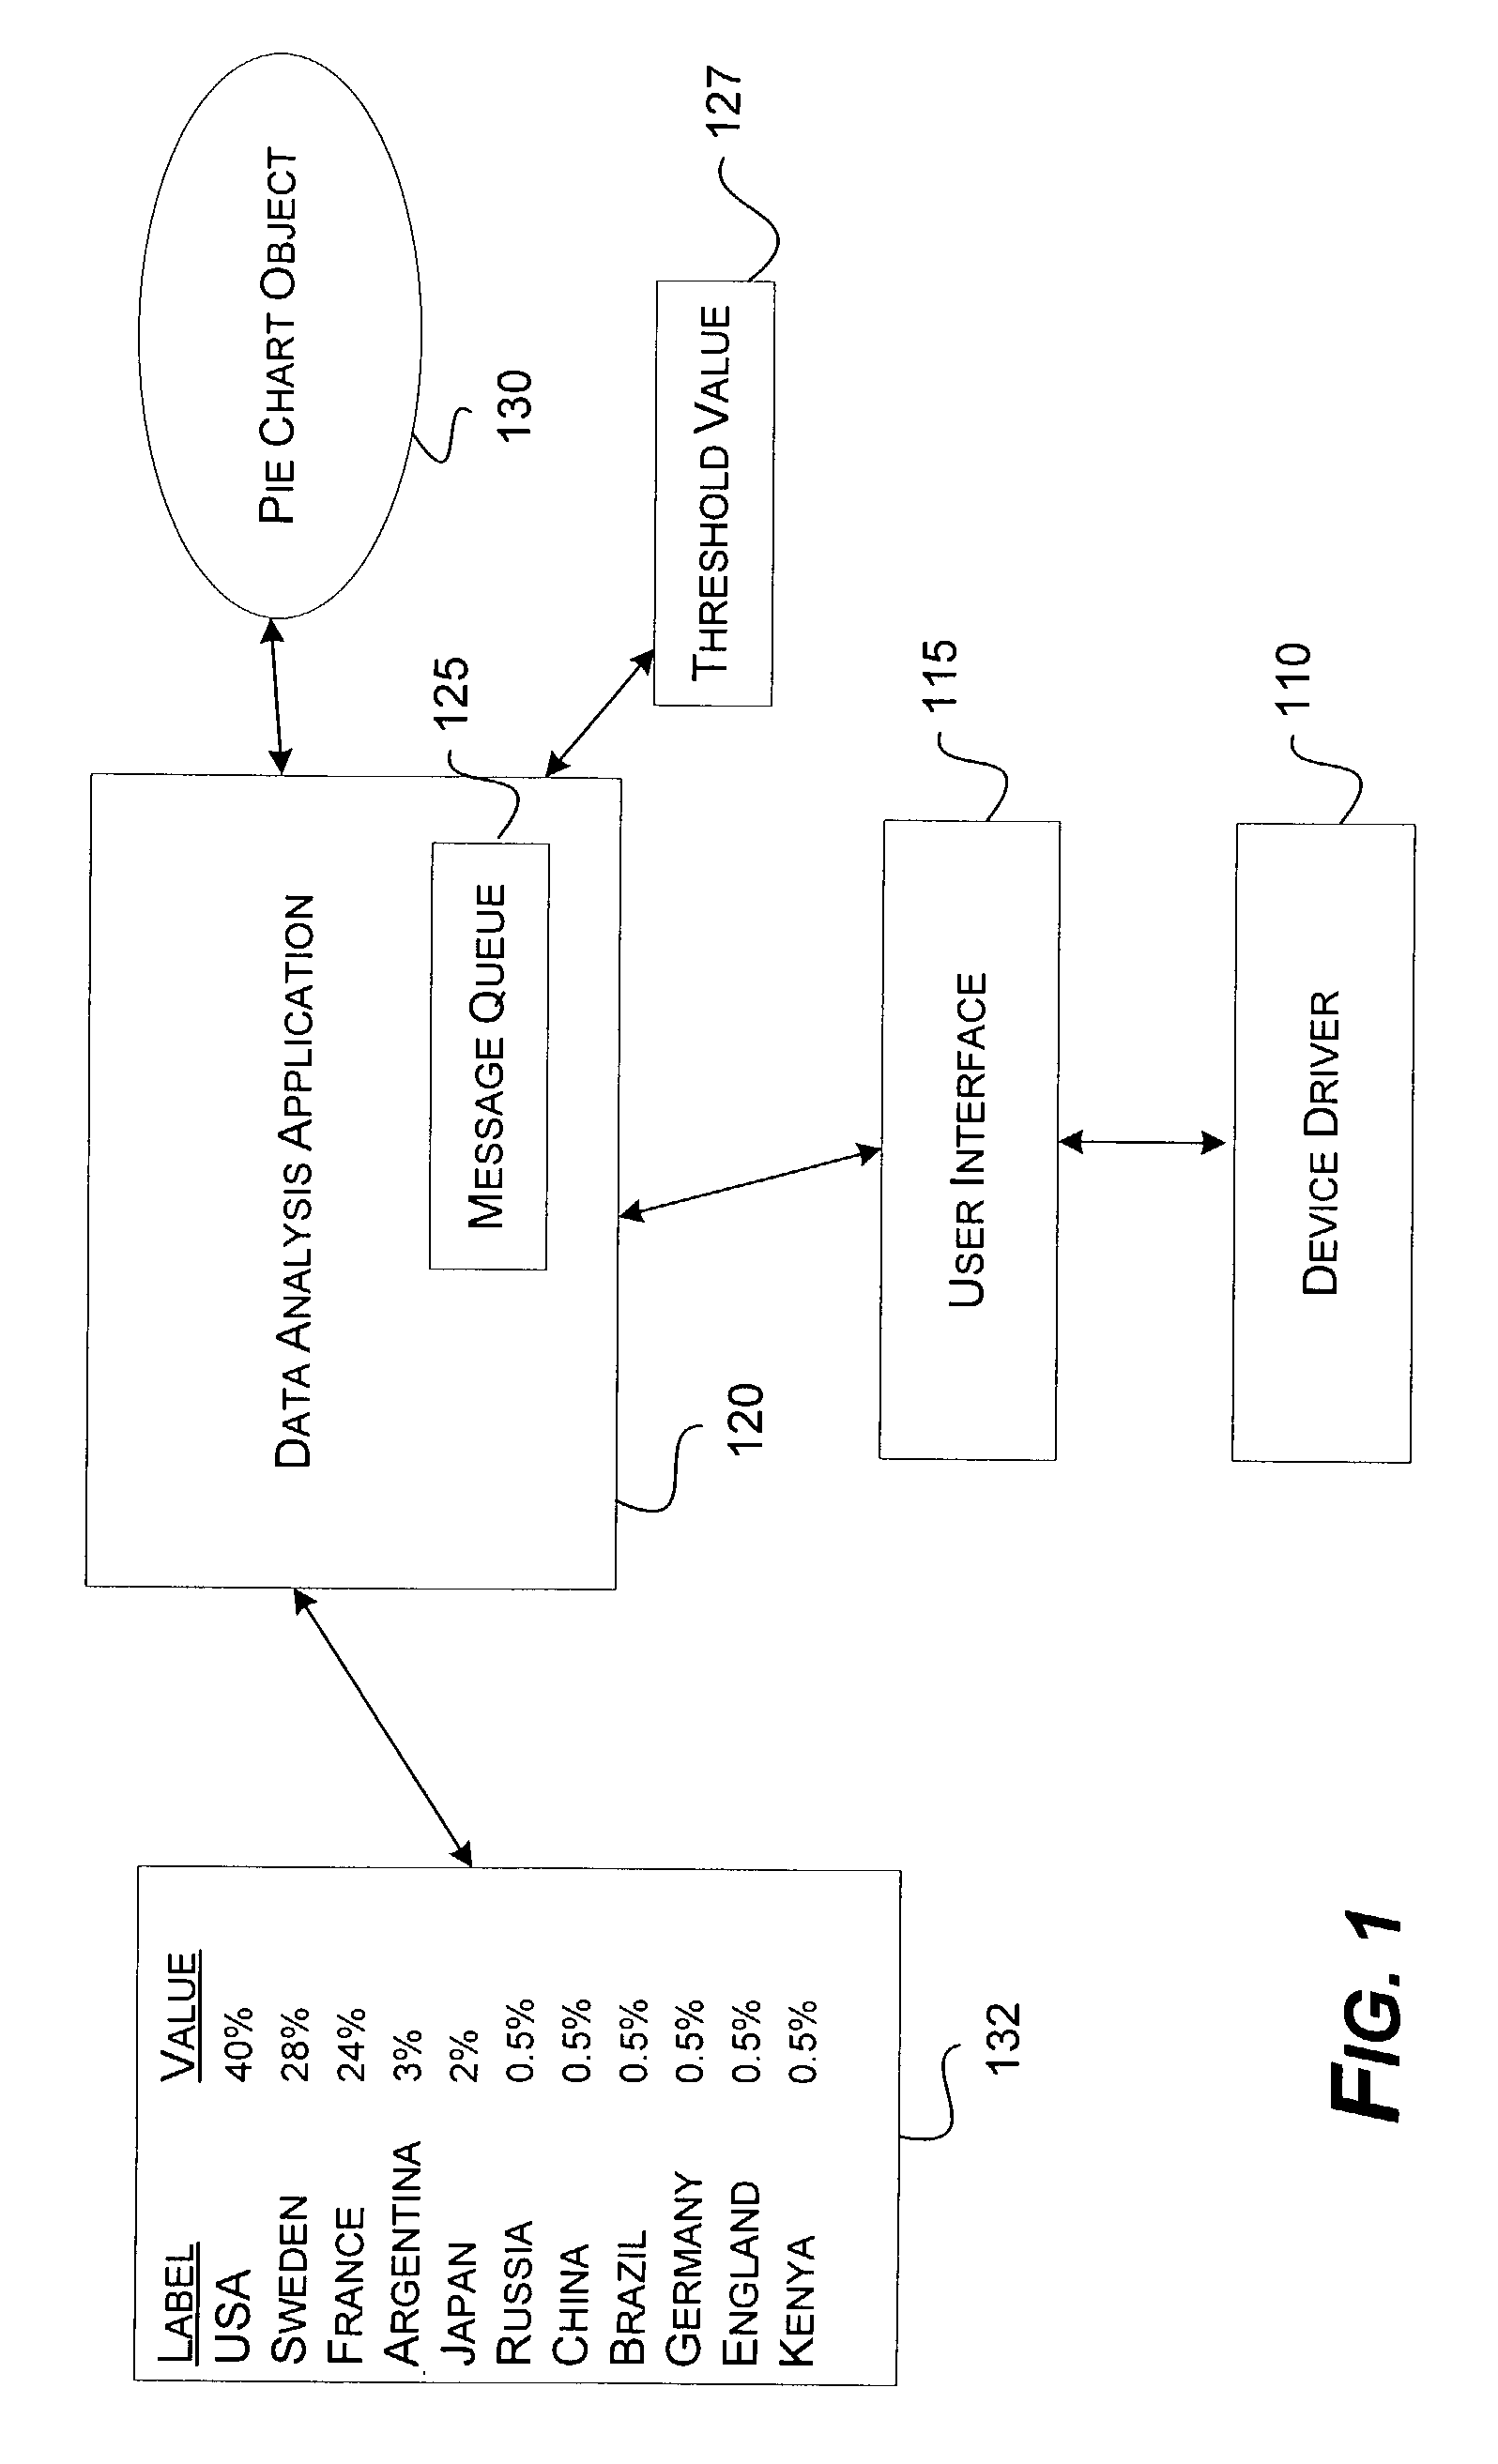
[0011]FIG. 1 is a functional block diagram illustrating components of a software environment in which the present invention may be implemented. Shown in FIG. 1 is a data analysis application 120 that includes analytical functions as well as other functions to enable a user to manipulate and understand data. In one example, the data analysis application 120 may be a spreadsheet application or the like. One function of the data analysis application may be to create images that graphically represent data. For instance, tables of numerical data, such as tabular data 132, may not convey meaningful information to a user until the data is presented in a graphical way. Bar charts, line charts, pie charts, and the like are typical graphical representations of data. In this implementation, the data analysis application 120 is configured to generate a pie chart from tabular data 132. FIG. 1 illustrates the pie chart as a pie chart object 130 having many properties associated with the pie chart...


PUM


Abstract

Described is a system and method for grouping elements whose data falls below a grouping threshold, and for displaying the grouped elements as a single portion of a graphical chart. Briefly stated, the system and method allow a user to dynamically increase a grouping threshold from a default value to an adjusted value. The data for each elements falling below the adjusted grouping threshold is aggregated. The grouped elements are then displayed as a single slice with a value of the aggregated data rather than being displayed as individual slices. In this way, the important information, which normally means the bigger and more significant slices, is more clearly visible. Further more, a single label may be associated with the group, thereby eliminating problems associated with the layout of multiple labels for each individual grouped element.

Description

BACKGROUND OF THE INVENTION[0001]One of the biggest factors considered in the design and development of software applications is ease of use. Often the difference between a successful software application and an unsuccessful software application is decided by the user's experience in interacting with it. Because of this, software developers generally strive to simplify the user's experience.[0002]One particularly competitive segment of the software industry is data analysis software. Data analysis software deals with analyzing data and presenting the data to the user in a meaningful way. Typically, data analysis software includes mechanisms to generate graphical representations of the data, such as pie charts, bar charts, line graphs, and the like. Some data analysis software includes rich features to ensure that those graphical representations convey as much information about the underlying data as possible. For example, data analysis software that generates pie charts may include ...

Claims


Application Information

Patent Timeline
Patent Type & Authority Patents(United States)
IPC IPC(8): G06T11/20
CPCG06T11/206
Inventor BEN-TOVIM, YARIVASNASH, LIVIUHOTER, DANY
Owner MICROSOFT TECH LICENSING LLC
Why Eureka
Try Eureka