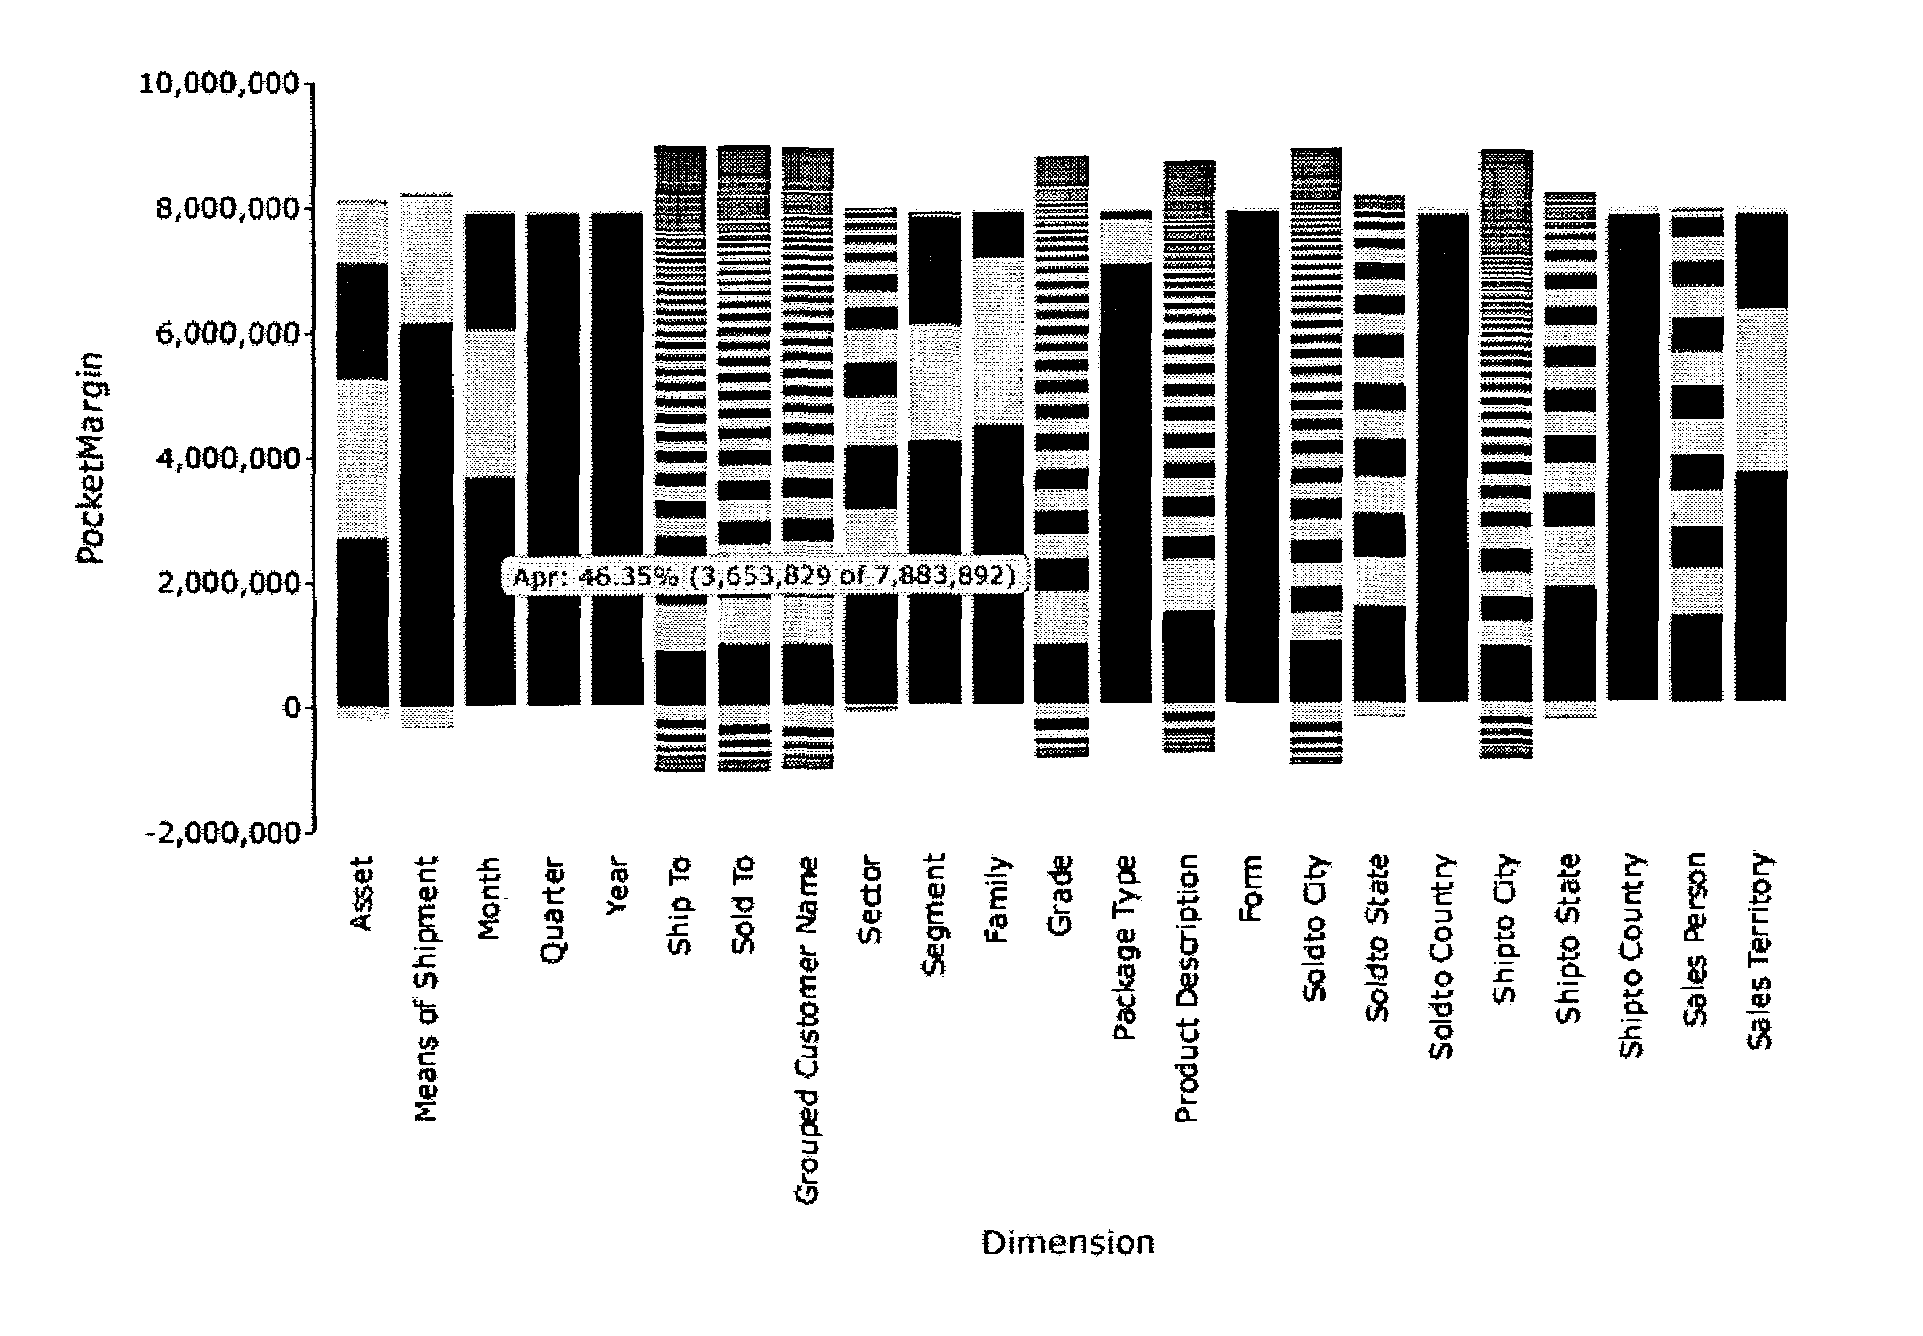
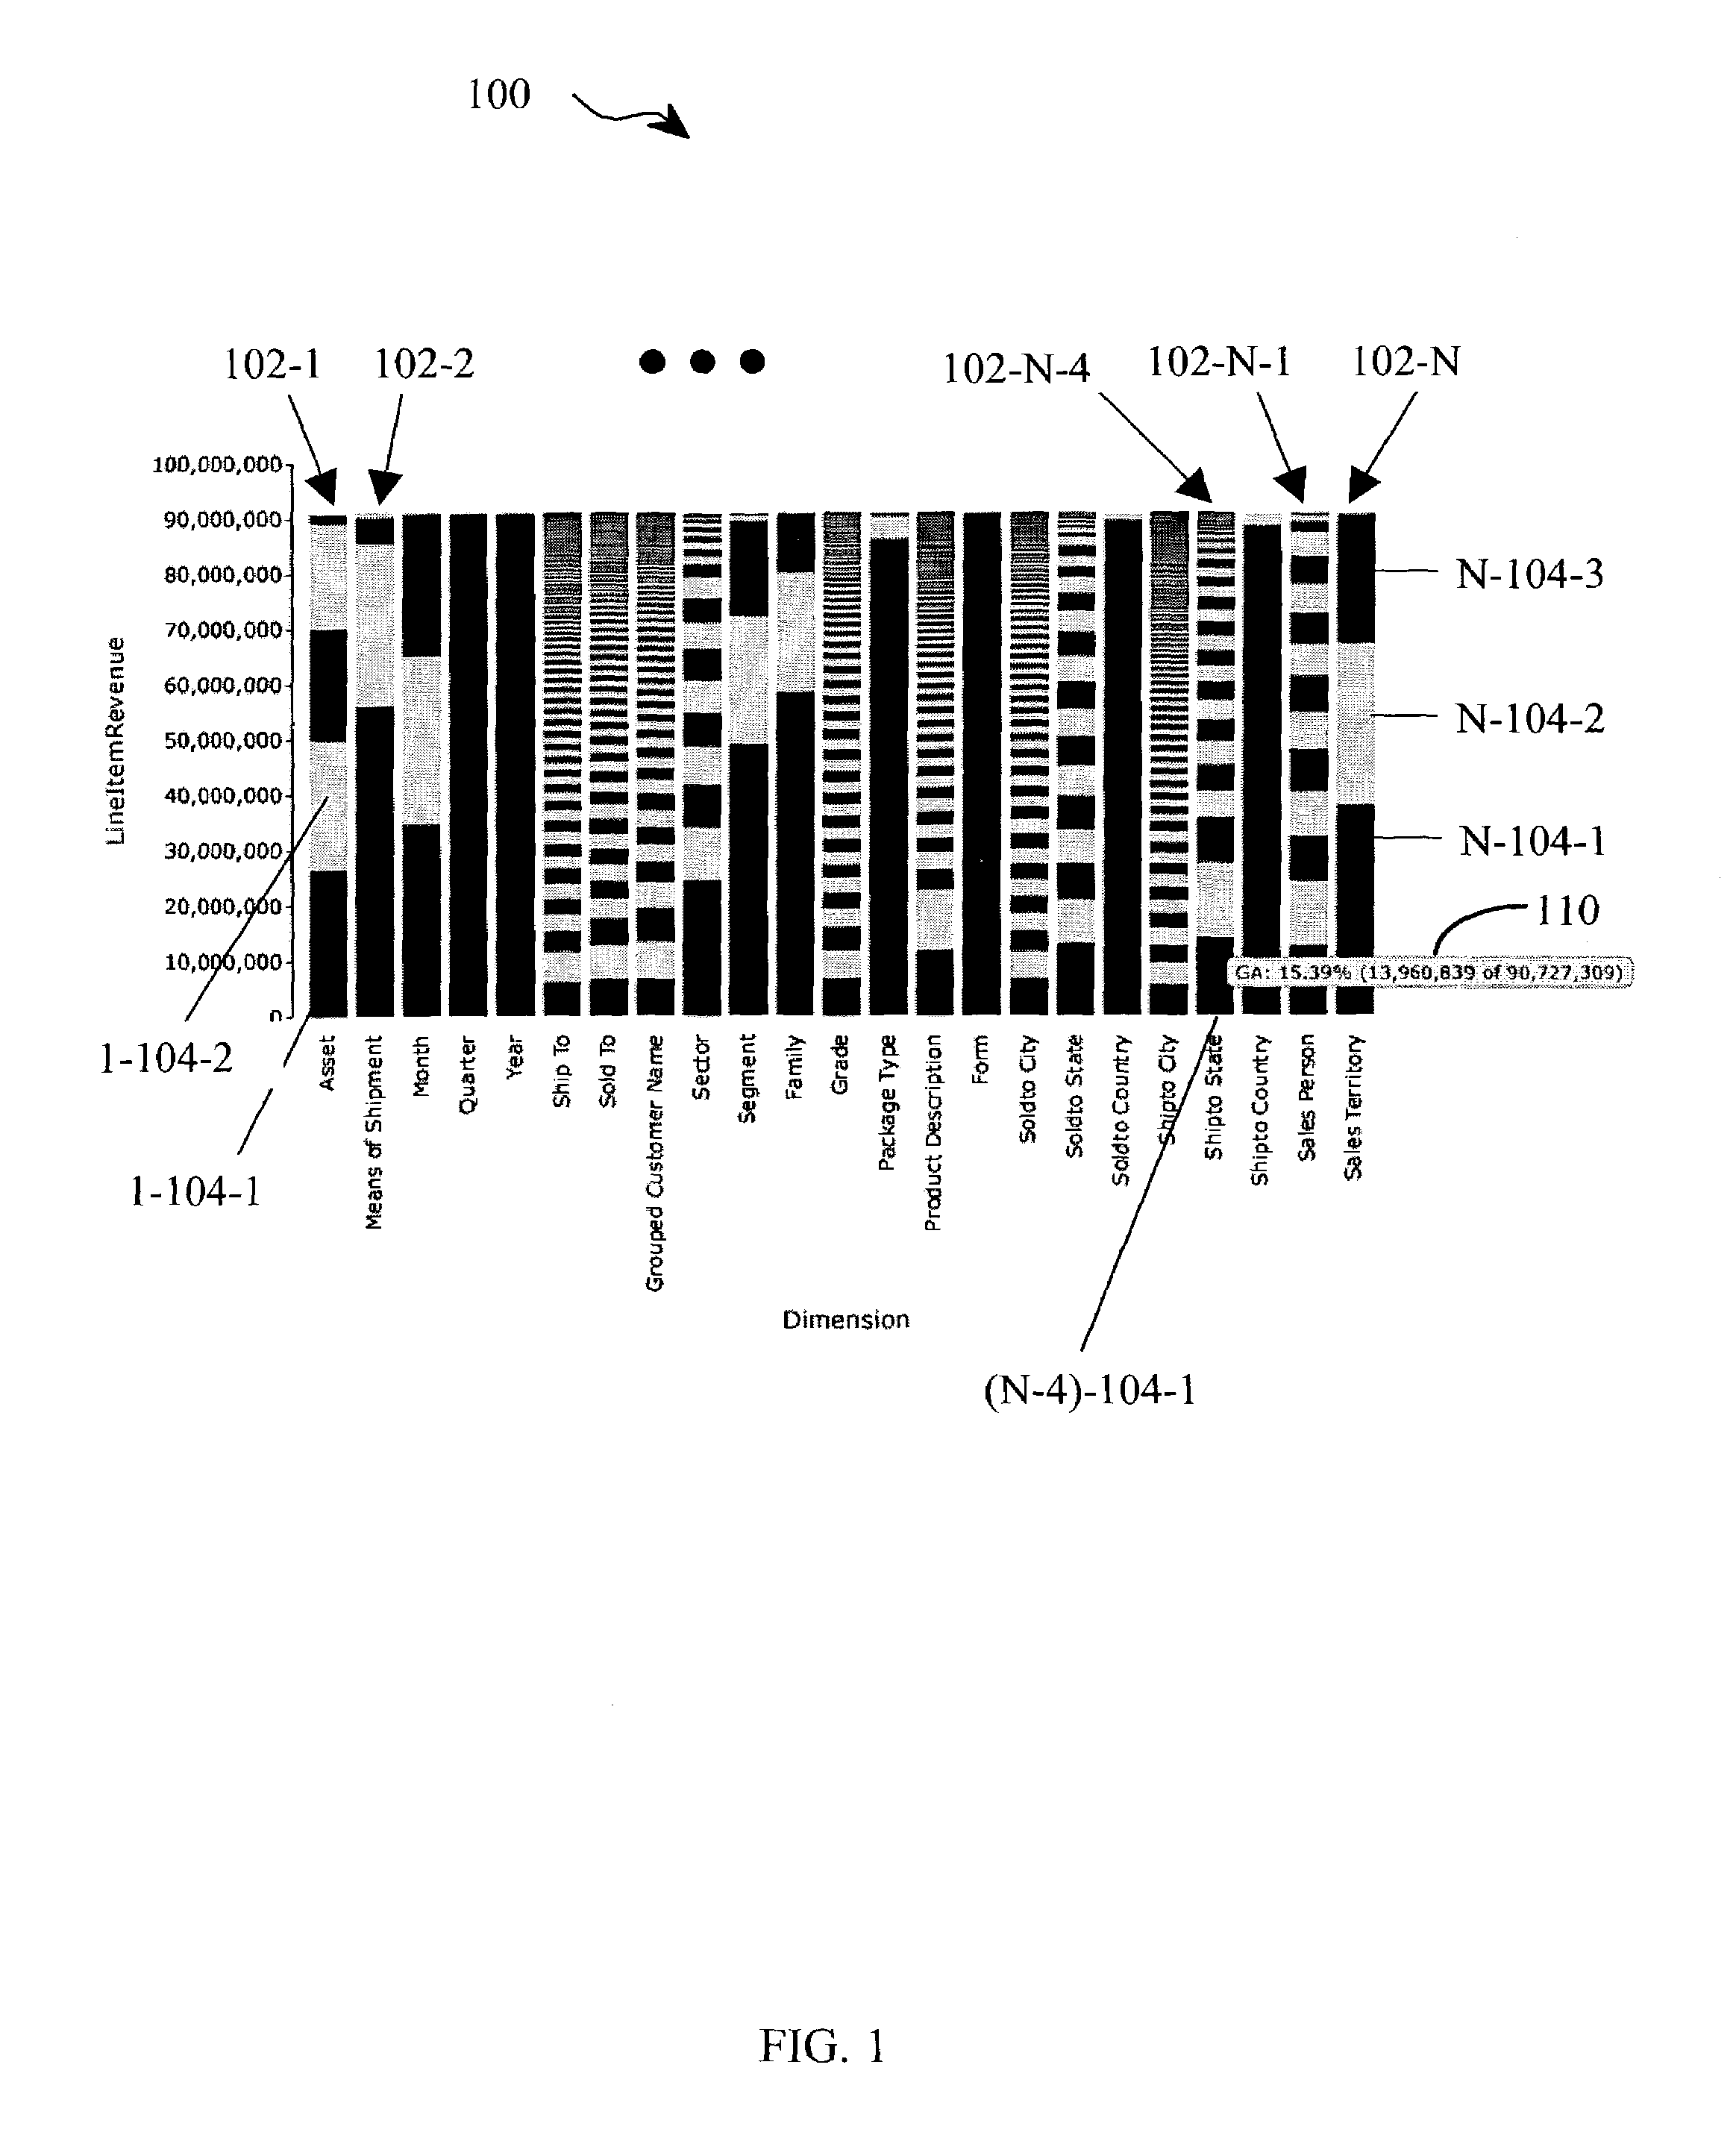
[0007]The present invention provides improved systems and methods for displaying data. In the present invention, data is presented in a novel graph form entitled the zebra chart. An additional
advantage of the present invention is that the novel graph forms of the present invention are interactive. That is, by passing a mouse over components of the present invention, additional information associated with the component of the graph is provided. One embodiment of the present invention provides a
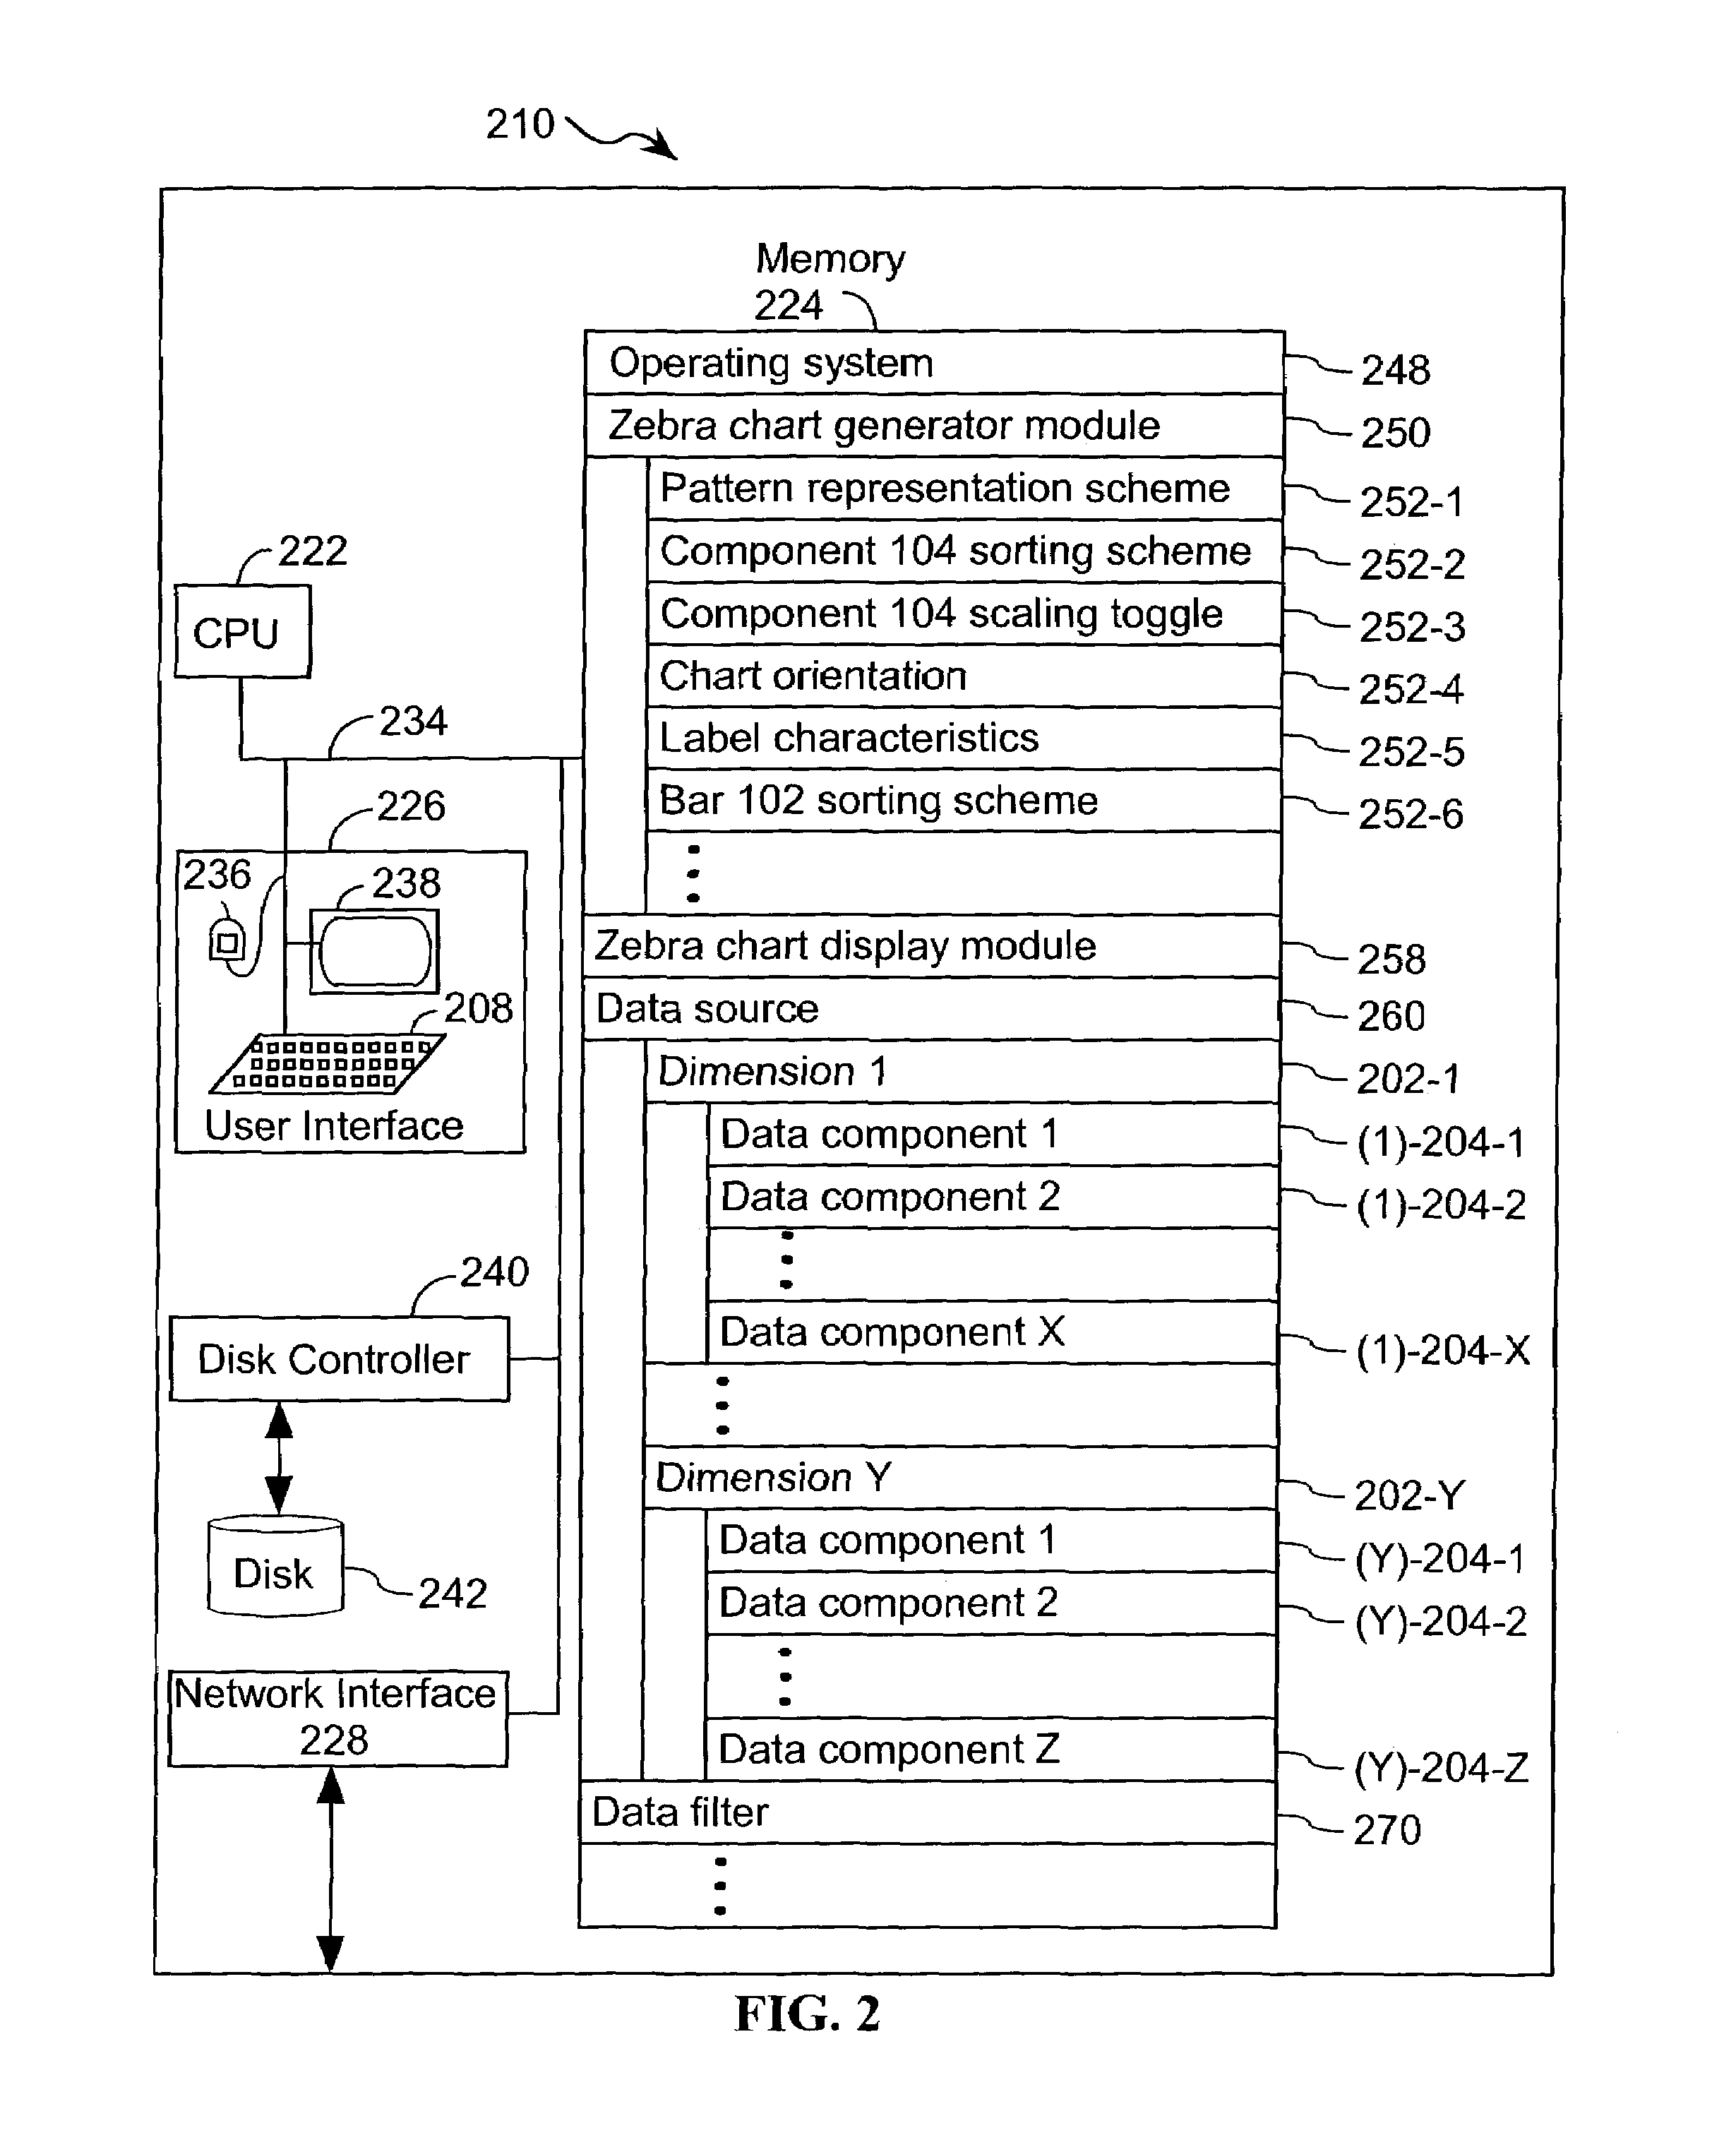
computer program product for use in conjunction with a computer
system. The computer program product comprises a computer readable storage medium and a computer program mechanism embedded therein. The computer program mechanism comprises a chart generator module and a chart display module. In some embodiments, the chart generator module and the chart display module are in a single program module. In some embodiments, the computer program product further comprises the
data source.
[0008]The chart generator module includes instructions for reading a
data source and instructions for generating a chart. The chart comprises a plurality of bars. Each bar in the plurality of bars comprises a plurality of linearly ordered components. The chart display module includes instructions for displaying the chart on an
output device such that, for each bar in the chart, each component in the bar is depicted in a pattern that differs from components in the same bar that border the component.
[0009]In some embodiments, each odd component in the plurality of components in a bar in the chart is displayed in a first pattern and each even component in the plurality of components in the bar is displayed in a second pattern, where the first pattern and the second pattern are different. For example, the first pattern could be
solid shading in a first color and the second pattern could be
solid shading in a second color. In another example, the first pattern is a first hash pattern and the second pattern is a second hash pattern.
[0010]In some embodiments, each (1+3×Y) component in the plurality of components in a bar in the chart is displayed in a first pattern. Furtermore, each (2+3×Y) component in the plurality of components in the bar is displayed in a second pattern. Finally, each (3+3×Y) component in the plurality of components in the bar is displayed in a third pattern. Here, Y is zero or a positive integer and each of the first pattern, the second pattern and the third pattern is different. In one example in accordance with such embodiments, the first pattern is
solid shading in a first color, the second pattern is solid shading in a second color, and the third pattern is solid shading in a third color.
[0011]More generally, the present invention provides a bar in the chart. And, for each integer s in a set of integers S, where the set S consists of the integers 1 to M, each s+M×Y component in the plurality of components in a bar in said chart is displayed in an sth pattern. Each sth pattern is different from any other pattern used to display a component in the same bar. Further, Y has a value of zero or any positive integer, and M has a value of two or greater.
[0012]In some embodiments, more than two patterns can be used to display the components of a bar in the chart. In the general case of M shading patterns numbered zero to M-1, and where the components of the bar are linearly numbered from zero to N−1, where N is the total number of components of a particular bar in the chart, the shading pattern of component number I, where 0 I<N of the bar is number I MOD M, where MOD denotes the remainder or modulus operator of numerical division.

