System and method to present and display multiple data using enhanced box charts
a box chart and enhanced technology, applied in the field of enhanced box charts, can solve the problem that existing known uses provide a limited amount of data in a rigid way
- Summary
- Abstract
- Description
- Claims
- Application Information
AI Technical Summary
Benefits of technology
Problems solved by technology
Method used
Image
Examples
examples
[0104]FIG. 3 illustrates an example of enhanced box chart 300, which is used to graphically display the data for a class report card. Here, a particular student's grade is marked with horizontal line 310. As illustrated, enhanced box chart 300 is designated with a red-cross logo. Enhanced box chart 300 includes three sub-groupings of the population: Ethnic A (green), Ethnic B (pink), and Ethnic C (blue). Enhanced box chart 300 also includes measures for the overall median (M) and the average (A).
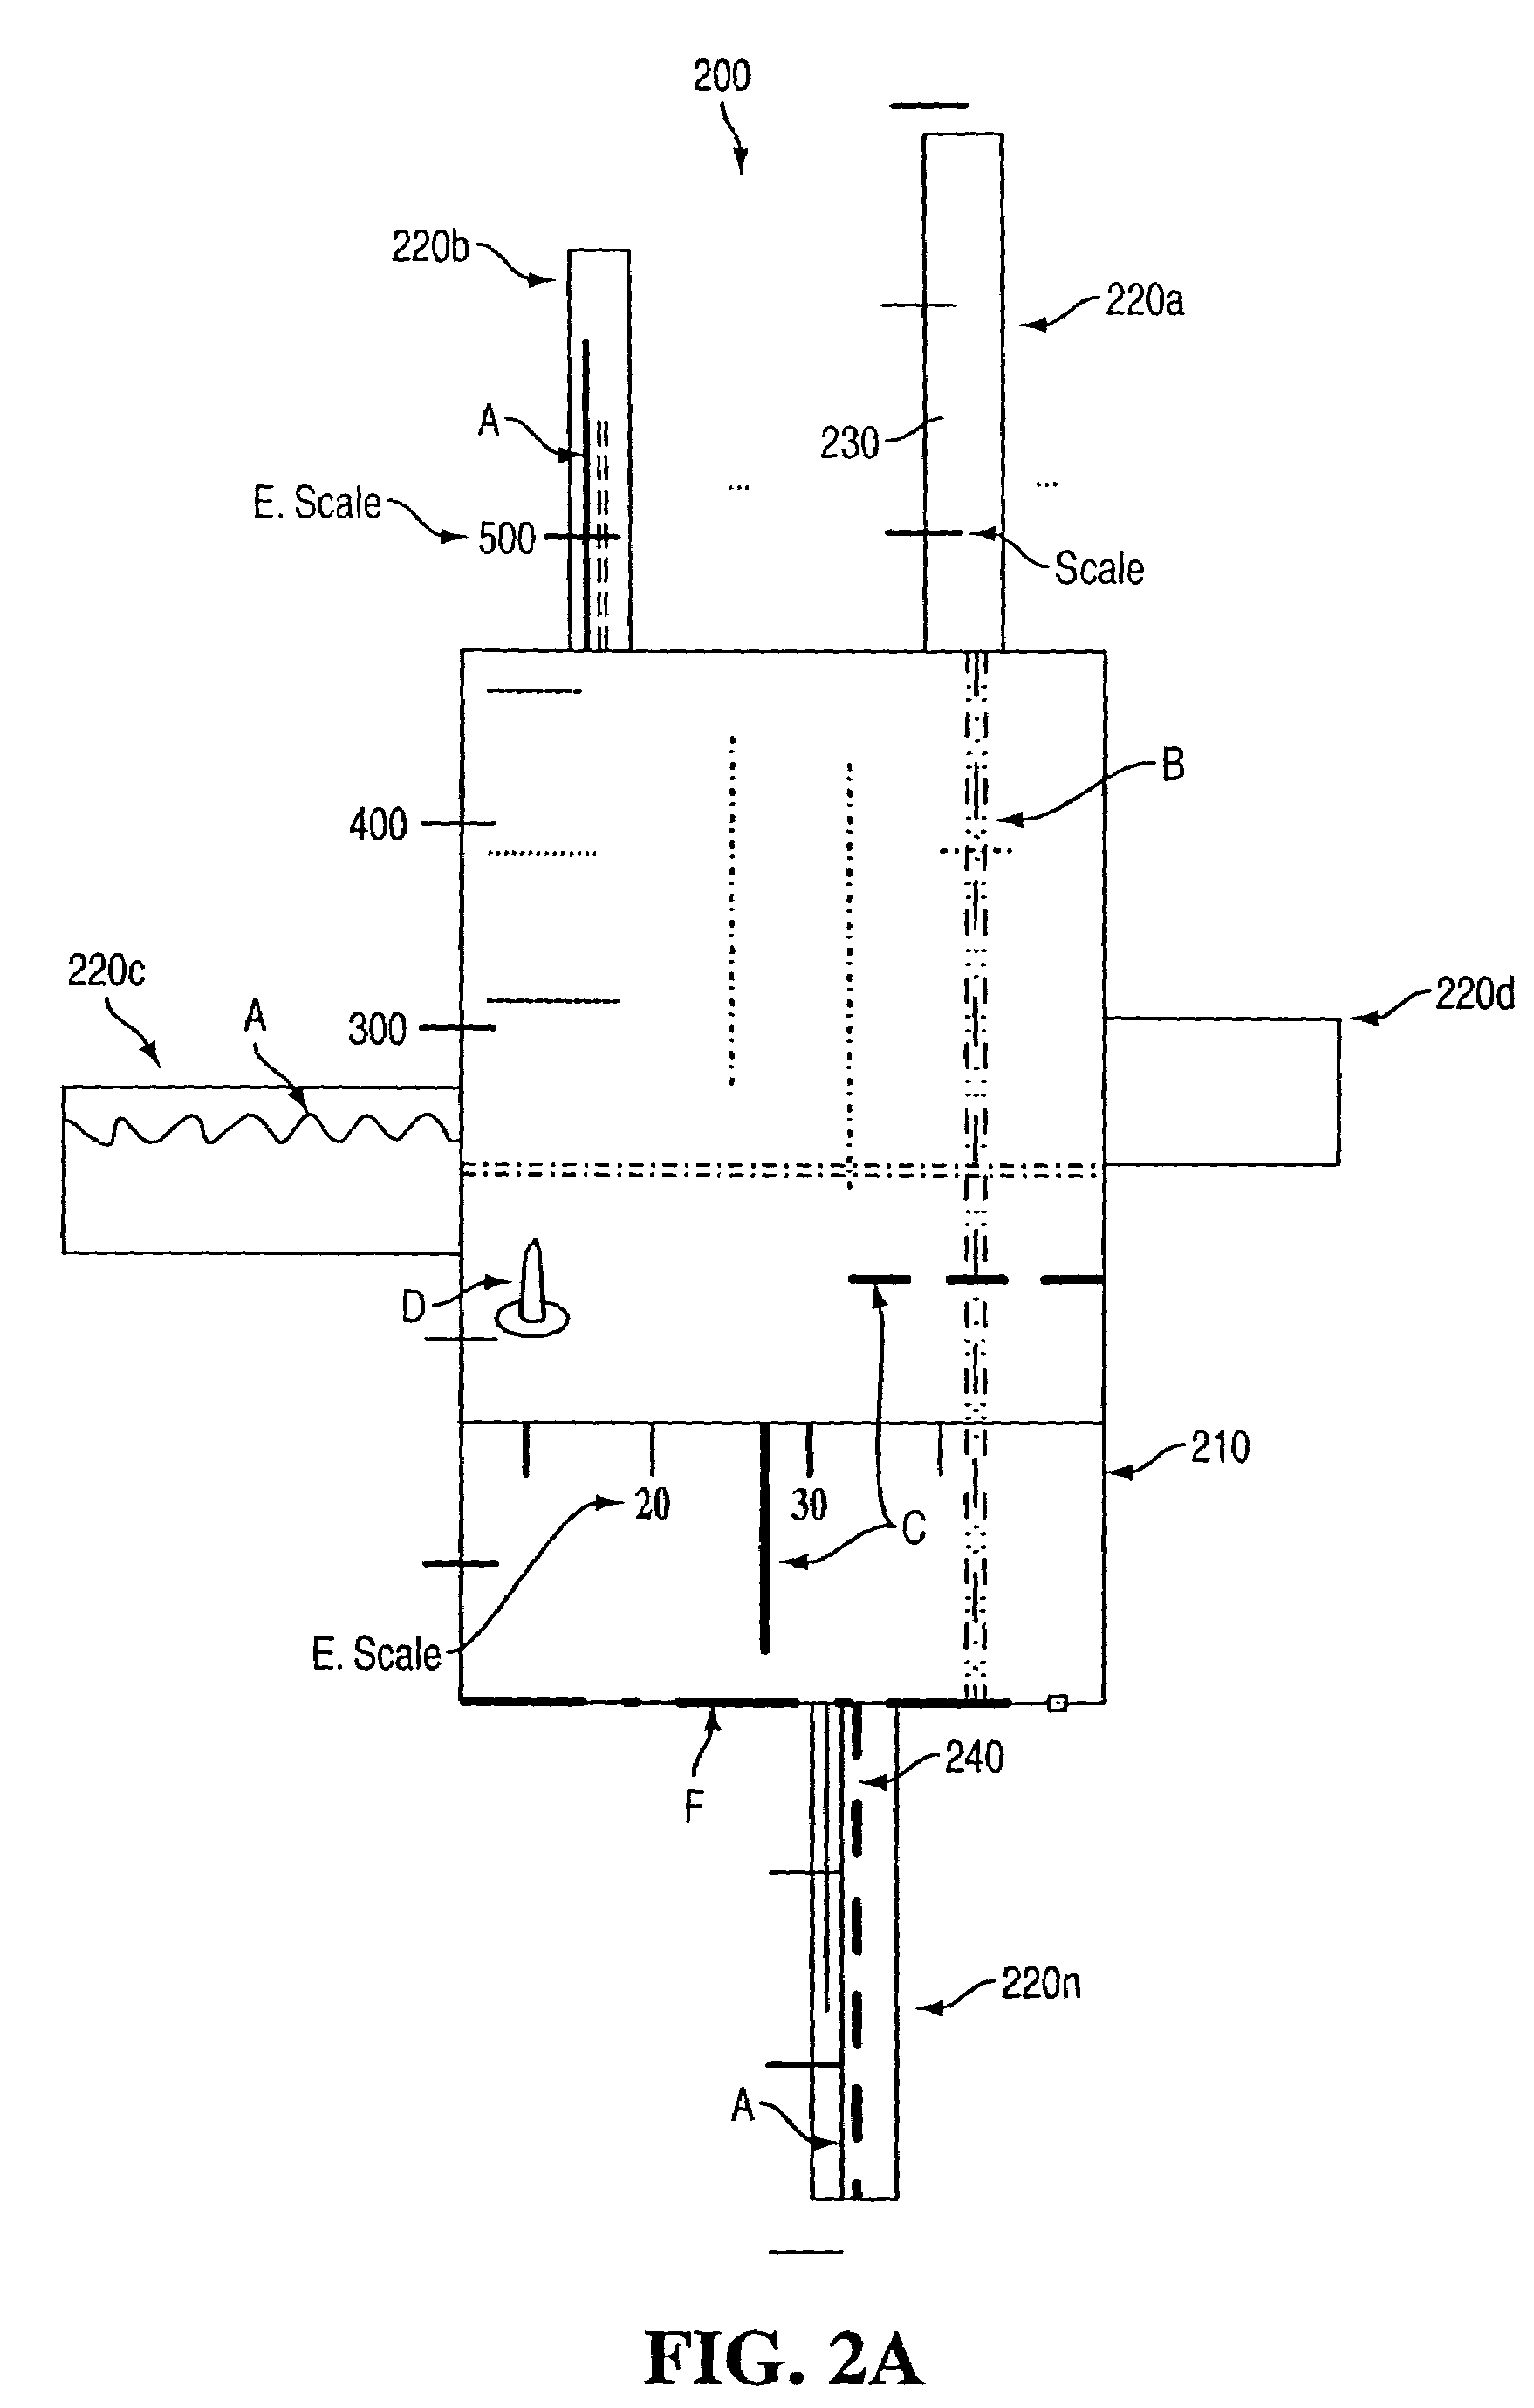
[0105]As further illustrated, the area (or width) of the body portion of enhanced box chart 300 covers 10 to 90 (percentile or absolute number) of the bell curve. As indicated by the relative widths of the upper and lower edges of the body portion, there are more samples around the median value (see indication of median dispersion on upper edge of the body portion) than around the mean value (see indication of mean dispersion on lower edge of the body portion). Further information regarding ...
PUM
 Abstract
Description
Claims
Application Information
 - R&D
- Intellectual Property
- Life Sciences
- Materials
- Tech Scout
- Unparalleled Data Quality
- Higher Quality Content
- 60% Fewer Hallucinations
Browse by: Latest US Patents, China's latest patents, Technical Efficacy Thesaurus, Application Domain, Technology Topic, Popular Technical Reports.
© 2025 PatSnap. All rights reserved.Legal|Privacy policy|Modern Slavery Act Transparency Statement|Sitemap|About US| Contact US: help@patsnap.com


