Polygonal chart drawing processing method, device and computer-readable medium recording a program of the same

a polygonal chart and drawing processing technology, applied in drawing from basic elements, instruments, computing, etc., can solve problems such as error in intuitive determination of the size of the area of the radar chart graphic, and the inability to accurately reflect the total score of the evaluation of the obj

Inactive Publication Date: 2007-10-23
FUJITSU LTD
View PDF6 Cites 9 Cited by
  • Summary
  • Abstract
  • Description
  • Claims
  • Application Information

AI Technical Summary

Benefits of technology

[0020]An object of the present invention is to provide a new polygonal chart drawing processing method, device and a computer-readable medium storing a program of the same for enabling a computer to draw a new polygonal chart graphic, which accurately reflects scores of evaluation objects on an area of the polygonal chart graphic to be drawn without losing a feature of a radar chart of superiority in visualizing tendencies by inequalities of the base positions on respective indicator axes.
[0029]Moreover, relationship between respective item-value-corresponding graphics in the polygonal chart is always corresponding to relationship among scores of allocated evaluation items and displayed by similar figures. Thus, the polygonal chart also has a feature of a radar chart for visualizing tendencies by inequalities of the base position on respective indicator axes of respective evaluation items. In other words, higher the score, closer to the periphery the base of an item-value-corresponding graphic is drawn, so that intuitive evaluation performed as comparing polygonal charts may be performed more easily and accurately than in the conventional arts.
[0033]The present invention can present magnitude relationship with scores of respective evaluation items or total scores as magnitude relationship with areas of polygonal charts so as to solve a problem of impossibility of performing accurate evaluation in evaluation process by simple comparing between areas of radar chart graphics in analyzing by using a radar chart.
[0034]Additionally, the present invention can display charts for enabling tendencies to be visualized by inequalities of the base positions on respective indicator axes for respective items, which is an advantage of a radar chart. Thus, the present invention may improve accuracy of evaluation even in intuitive evaluation performed by visually comparing charts.

Problems solved by technology

In such an analyzing technique using a radar chart, however, areas of a radar chart graphic representing objects to be determined or evaluated may not accurately reflect the total scores of evaluation for the objects.
Some physical relationship between scores plotted on indicator axes of radar charts forming a radar chart graphic may lead an error in intuitive determination on sizes of areas of the radar chart graphic.
In a radar chart shown in FIG. 1, it is difficult for a user to recognize what comprehensively the best among the three evaluation objects at a glance.
If objects are evaluated for superiority and inferiority based on areas of their radar chart graphics, the ranking of evaluation may be incorrect.
Thus, areas of radar chart graphics representing evaluation objects do not accurately correspond to the total scores of the evaluation items.
It is difficult for a user to intuitively determine magnitude relationship between radar chart graphics based on impressions the user got from the sizes of graphics.
This is because characteristics in shapes of radar chart graphics are not suitable for comparing areas, and a combination of locations of scores on indicator axes of radar charts may change the user's impression on the size of the graphic.
Therefore, magnitude relationship with evaluation objects in total scores does not correspond to magnitude relationship with areas of radar chart graphics, which leads incorrect evaluation.
Thus, a user does not take advantage of convenience of comparison between radar charts.
As such, the conventional arts do not take account of how to accurately reflect total evaluation scores of evaluation objects on areas of radar chart graphics.
Accordingly, incorrect evaluation result caused by simple comparison of areas of radar chart graphics for evaluation objects cannot be eliminated.
Characteristics in a shape of radar chart graphic also make it difficult for a user to intuitively evaluate superiority and inferiority of radar chart graphics by comparing them.

Method used


Image

  • Polygonal chart drawing processing method, device and computer-readable medium recording a program of the same
  • Polygonal chart drawing processing method, device and computer-readable medium recording a program of the same
  • Polygonal chart drawing processing method, device and computer-readable medium recording a program of the same

Examples


Embodiment Construction

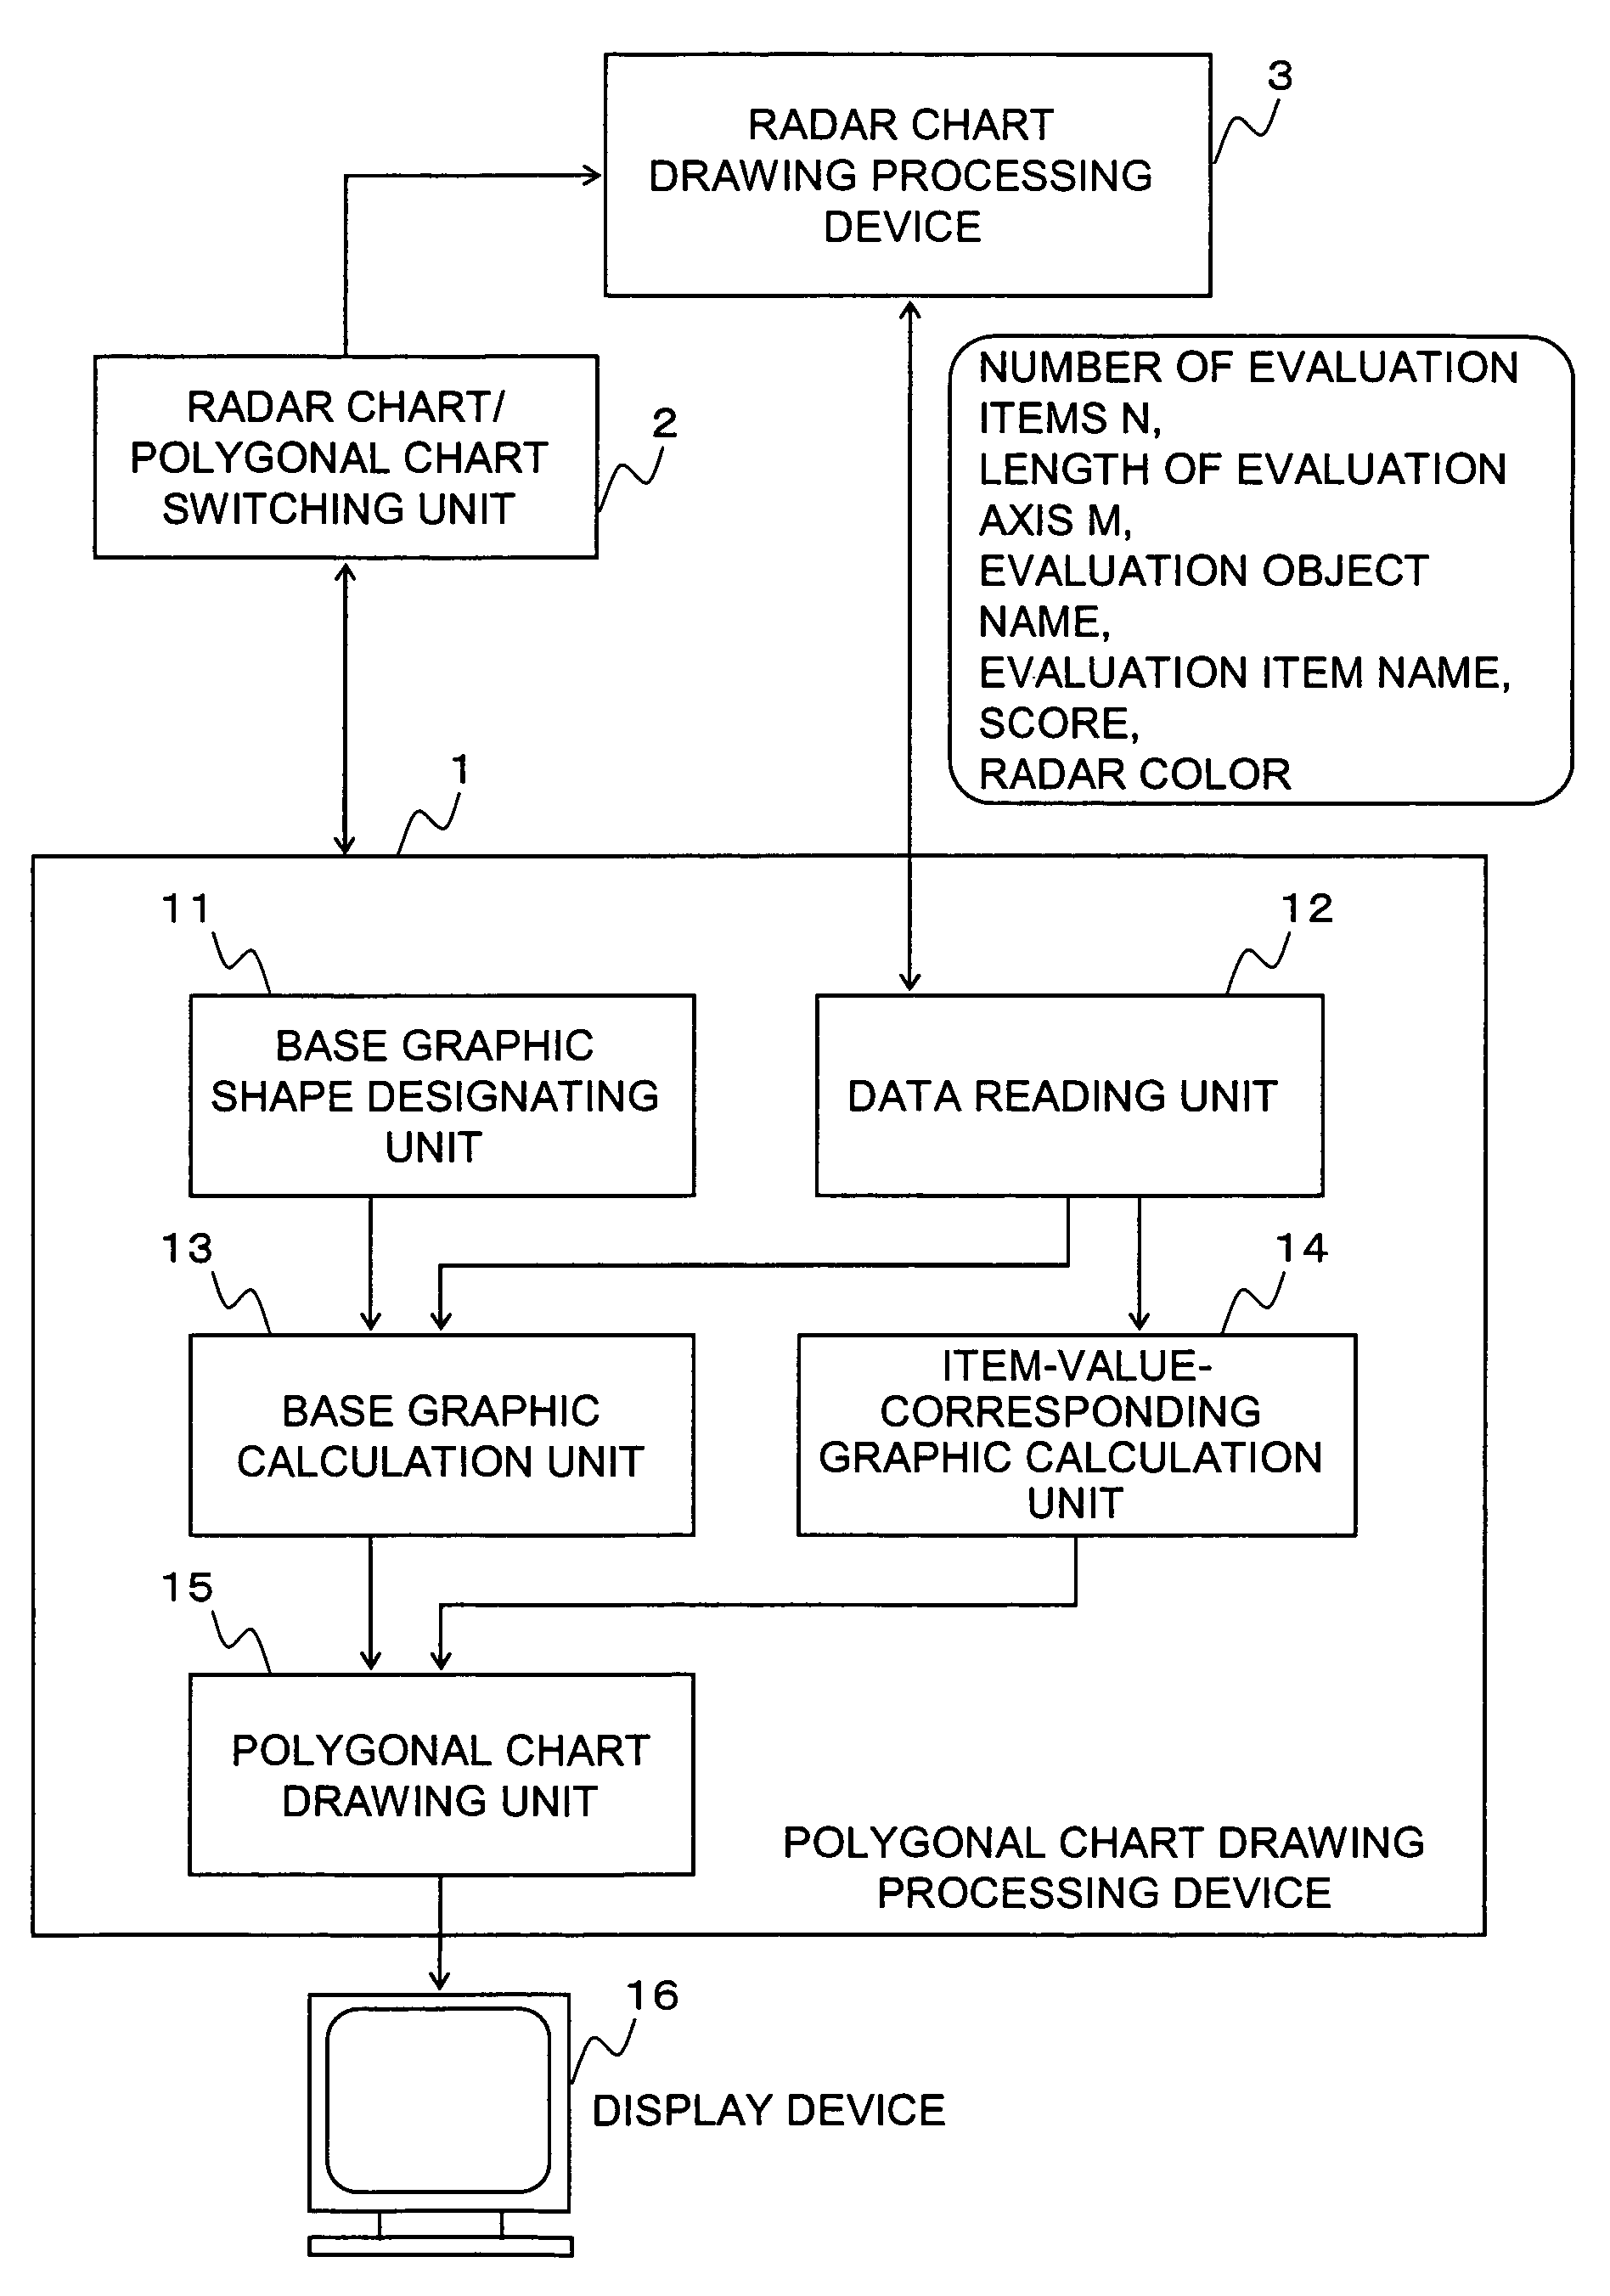
[0046]FIG. 5 is a diagram showing an example of a configuration of a polygonal chart drawing processing device 1 according to the present invention.

[0047]The polygonal chart drawing processing device 1 is a processing device for drawing a polygonal chart with combination of similar figures to a base graphic forming a predetermined geometrical form in order to represent a relationship among evaluation values of each evaluation item for drawing objects, for which at least three evaluation items set. The polygonal chart drawing processing device 1 is implemented as a module of a program, which is read in a computer and executed there.

[0048]The polygonal chart drawing processing device 1 also sends and receives data or a request to / from a radar chart / polygonal chart switching unit 2 and a radar chart drawing processing device 3 provided in the same computer.

[0049]The radar chart / polygonal chart switching unit 2 is a processing unit for accepting user input to designate either of a radar...


PUM


Abstract

The polygonal chart drawing processing device inputs information including the number N of evaluation items, the length M of an evaluation axis, evaluation items and values for the drawing object from the radar chart drawing processing device. The device generates base graphics (e.g. isosceles triangle) as many as the number of evaluation items, then, by obtaining the length L of an isosceles side of the similar figure to the base graphic, generates an item-value-corresponding graphic having a vertical angle being 2π / N and an area representing an item value of the corresponding evaluation item. The device then draws a polygonal chart which consists of all the item-value-corresponding graphics arranged in a radial pattern with the indicator axis of a radar chart being placed over a center line of the corresponding item-value-corresponding graphic and the vertical angle of the item-value-corresponding graphic being placed over the center point.

Description

CROSS-REFERENCE TO RELATED APPLICATIONS[0001]This application claims priority from Japanese patent application Ser. no. 2005-250415 filed Aug. 31, 2005, the contents of which are incorporated by reference herein.BACKGROUND OF THE INVENTION[0002]1. Field of the Invention[0003]This invention relates to a chart drawing processing method and device, and computer-readable medium recording a program of the same. More specifically, the present invention relates to a processing method and device for drawing a polygonal chart using polygon by computer, and a computer-readable medium storing a program for causing a computer to function as the processing device.[0004]2. Description of the Related Art[0005]Analyzing techniques using a radar chart include a determination technique of calculating areas of graphics, each of which is made by drawing lines between the scores plotted on indicator axes for evaluation items on the radar chart (hereinafter referred to as “radar chart graphic”), and simp...

Claims


Application Information

Patent Timeline
Patent Type & Authority Patents(United States)
IPC IPC(8): G06T11/20
CPCG06T11/206
Inventor IGUCHI, MASAYUKIEZAWA, MASAOSATO, TADASHI
Owner FUJITSU LTD
Why Eureka
Try Eureka