Stock price chart

a stock price and chart technology, applied in the field of stock price charts, can solve the problems of difficult to forecast a future trend, easy to be misled by fluctuations, and difficulty in reading the chart for beginners, and achieve the effect of easy reading

Inactive Publication Date: 2008-07-15
MASUDA ECONOMIC RES INST
View PDF3 Cites 42 Cited by
  • Summary
  • Abstract
  • Description
  • Claims
  • Application Information

AI Technical Summary

Benefits of technology

[0012]The present invention has been devised in view of such problems, and it is an object of the present invention to provide a

Problems solved by technology

However, on the other hand, a problem has been pointed out in that, since each stick tends to be complicated and fluctuate largely, and further, adjacent sticks do not necessarily have a continuity, a beginner in stock trading experiences difficulty in reading the chart and is easily mislead by the fluctuations

Method used


Image

  • Stock price chart
  • Stock price chart
  • Stock price chart

Examples


first embodiment

[0038]A first embodiment for solving the above-mentioned problems is realized as a stock price chart in which “sticks” for a predetermined stock brand are arranged in time series on coordinates consisting of a price axis and a time axis.

[0039]In this stock price chart, an upper end and a lower end of a “stick” are arranged so as to indicate one of an average closing price of the present evaluation period, which is calculated from a closing price of the present evaluation period and already obtained closing prices for a prescribed period before that, and an average closing price of the previous evaluation period, which is calculated from a closing price of the previous evaluation period and already obtained closing prices for a prescribed period before that, respectively.

[0040]Here, ‘the present evaluation period’ and ‘the previous evaluation period’, in this context represent two time periods (day, week, month and the like) that continue in a time axis on the chart, respectively. Fo...

second embodiment

[0054]Next, the present invention is a stock price chart in which “sticks” for a predetermined stock brand are arranged in time series on coordinates consisting of a price axis and a time axis. A plurality of types of “sticks” having different ‘prescribed period’ are drawn, whose upper end and lower end are arranged so as to show one of an average closing price for the present evaluation period calculated from a closing price for the present evaluation period and already obtained closing prices for a prescribed period before that, and an average closing price for the previous evaluation period calculated from a closing price for the previous evaluation period and already obtained closing prices for a prescribed period before that, respectively. Further, an indication showing a magnitude relationship between an average closing price for the previous evaluation period and an average closing price for the present evaluation period, a coordinate point showing a closing price for the pre...

third embodiment

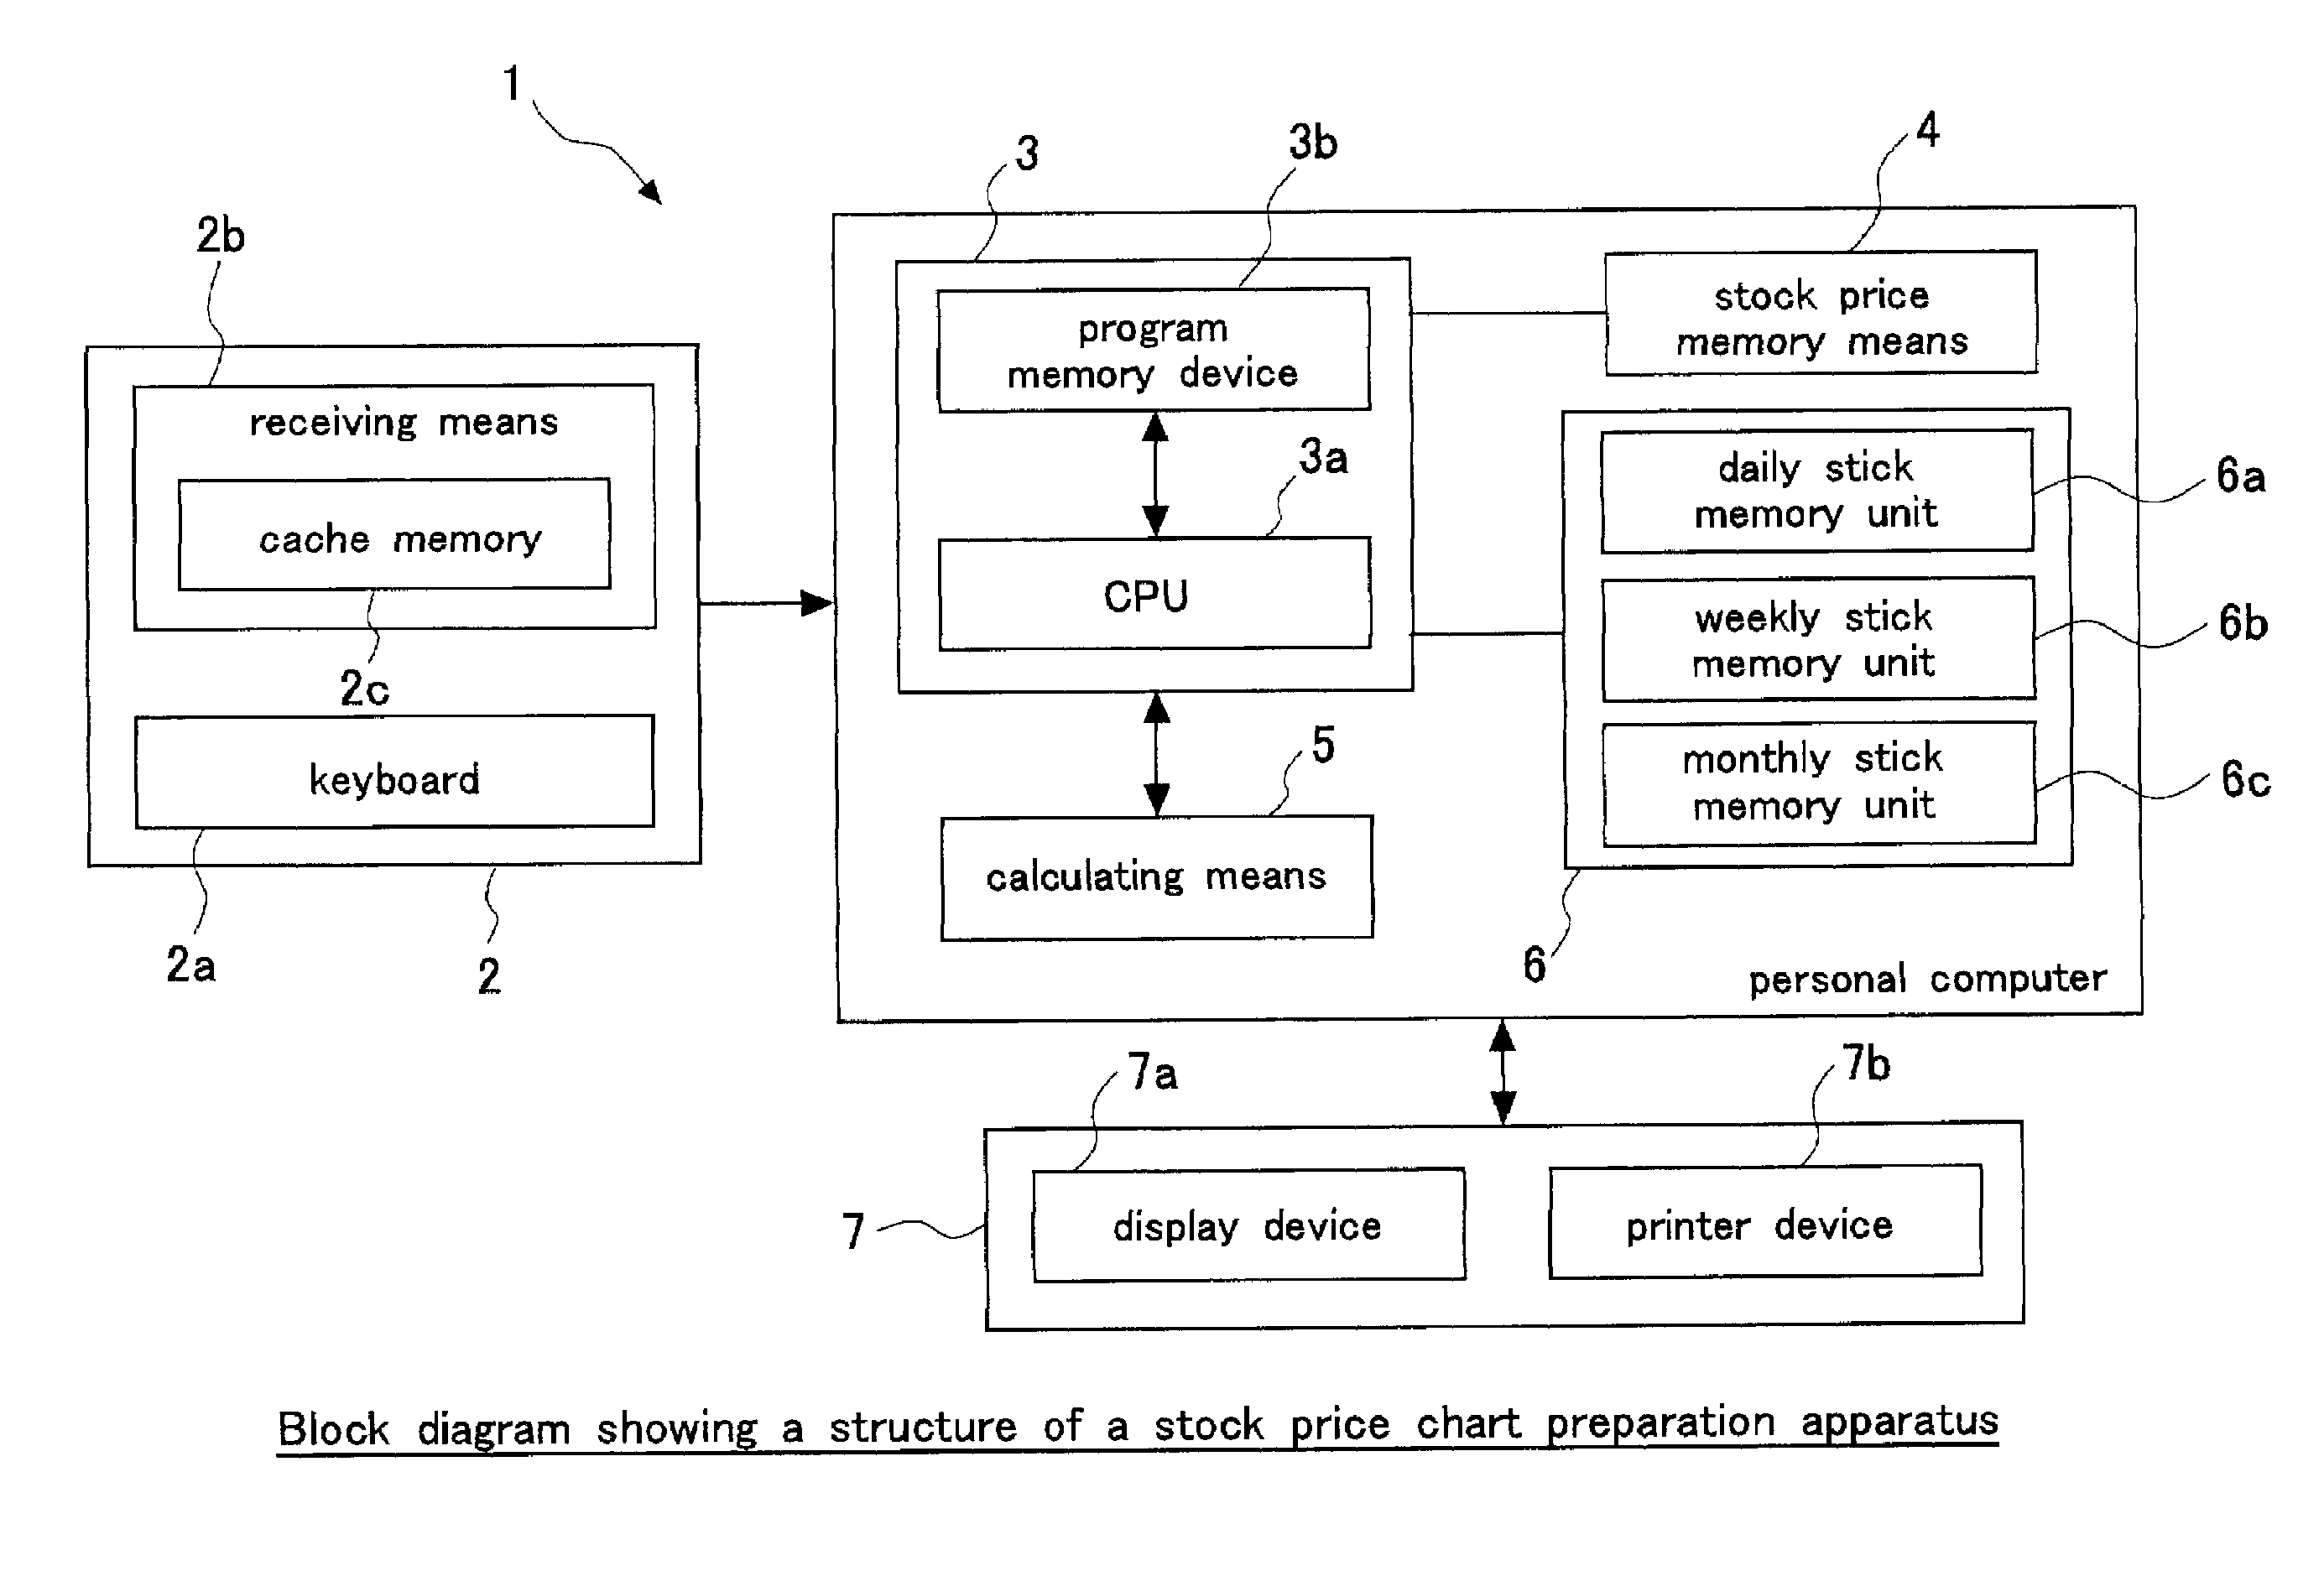
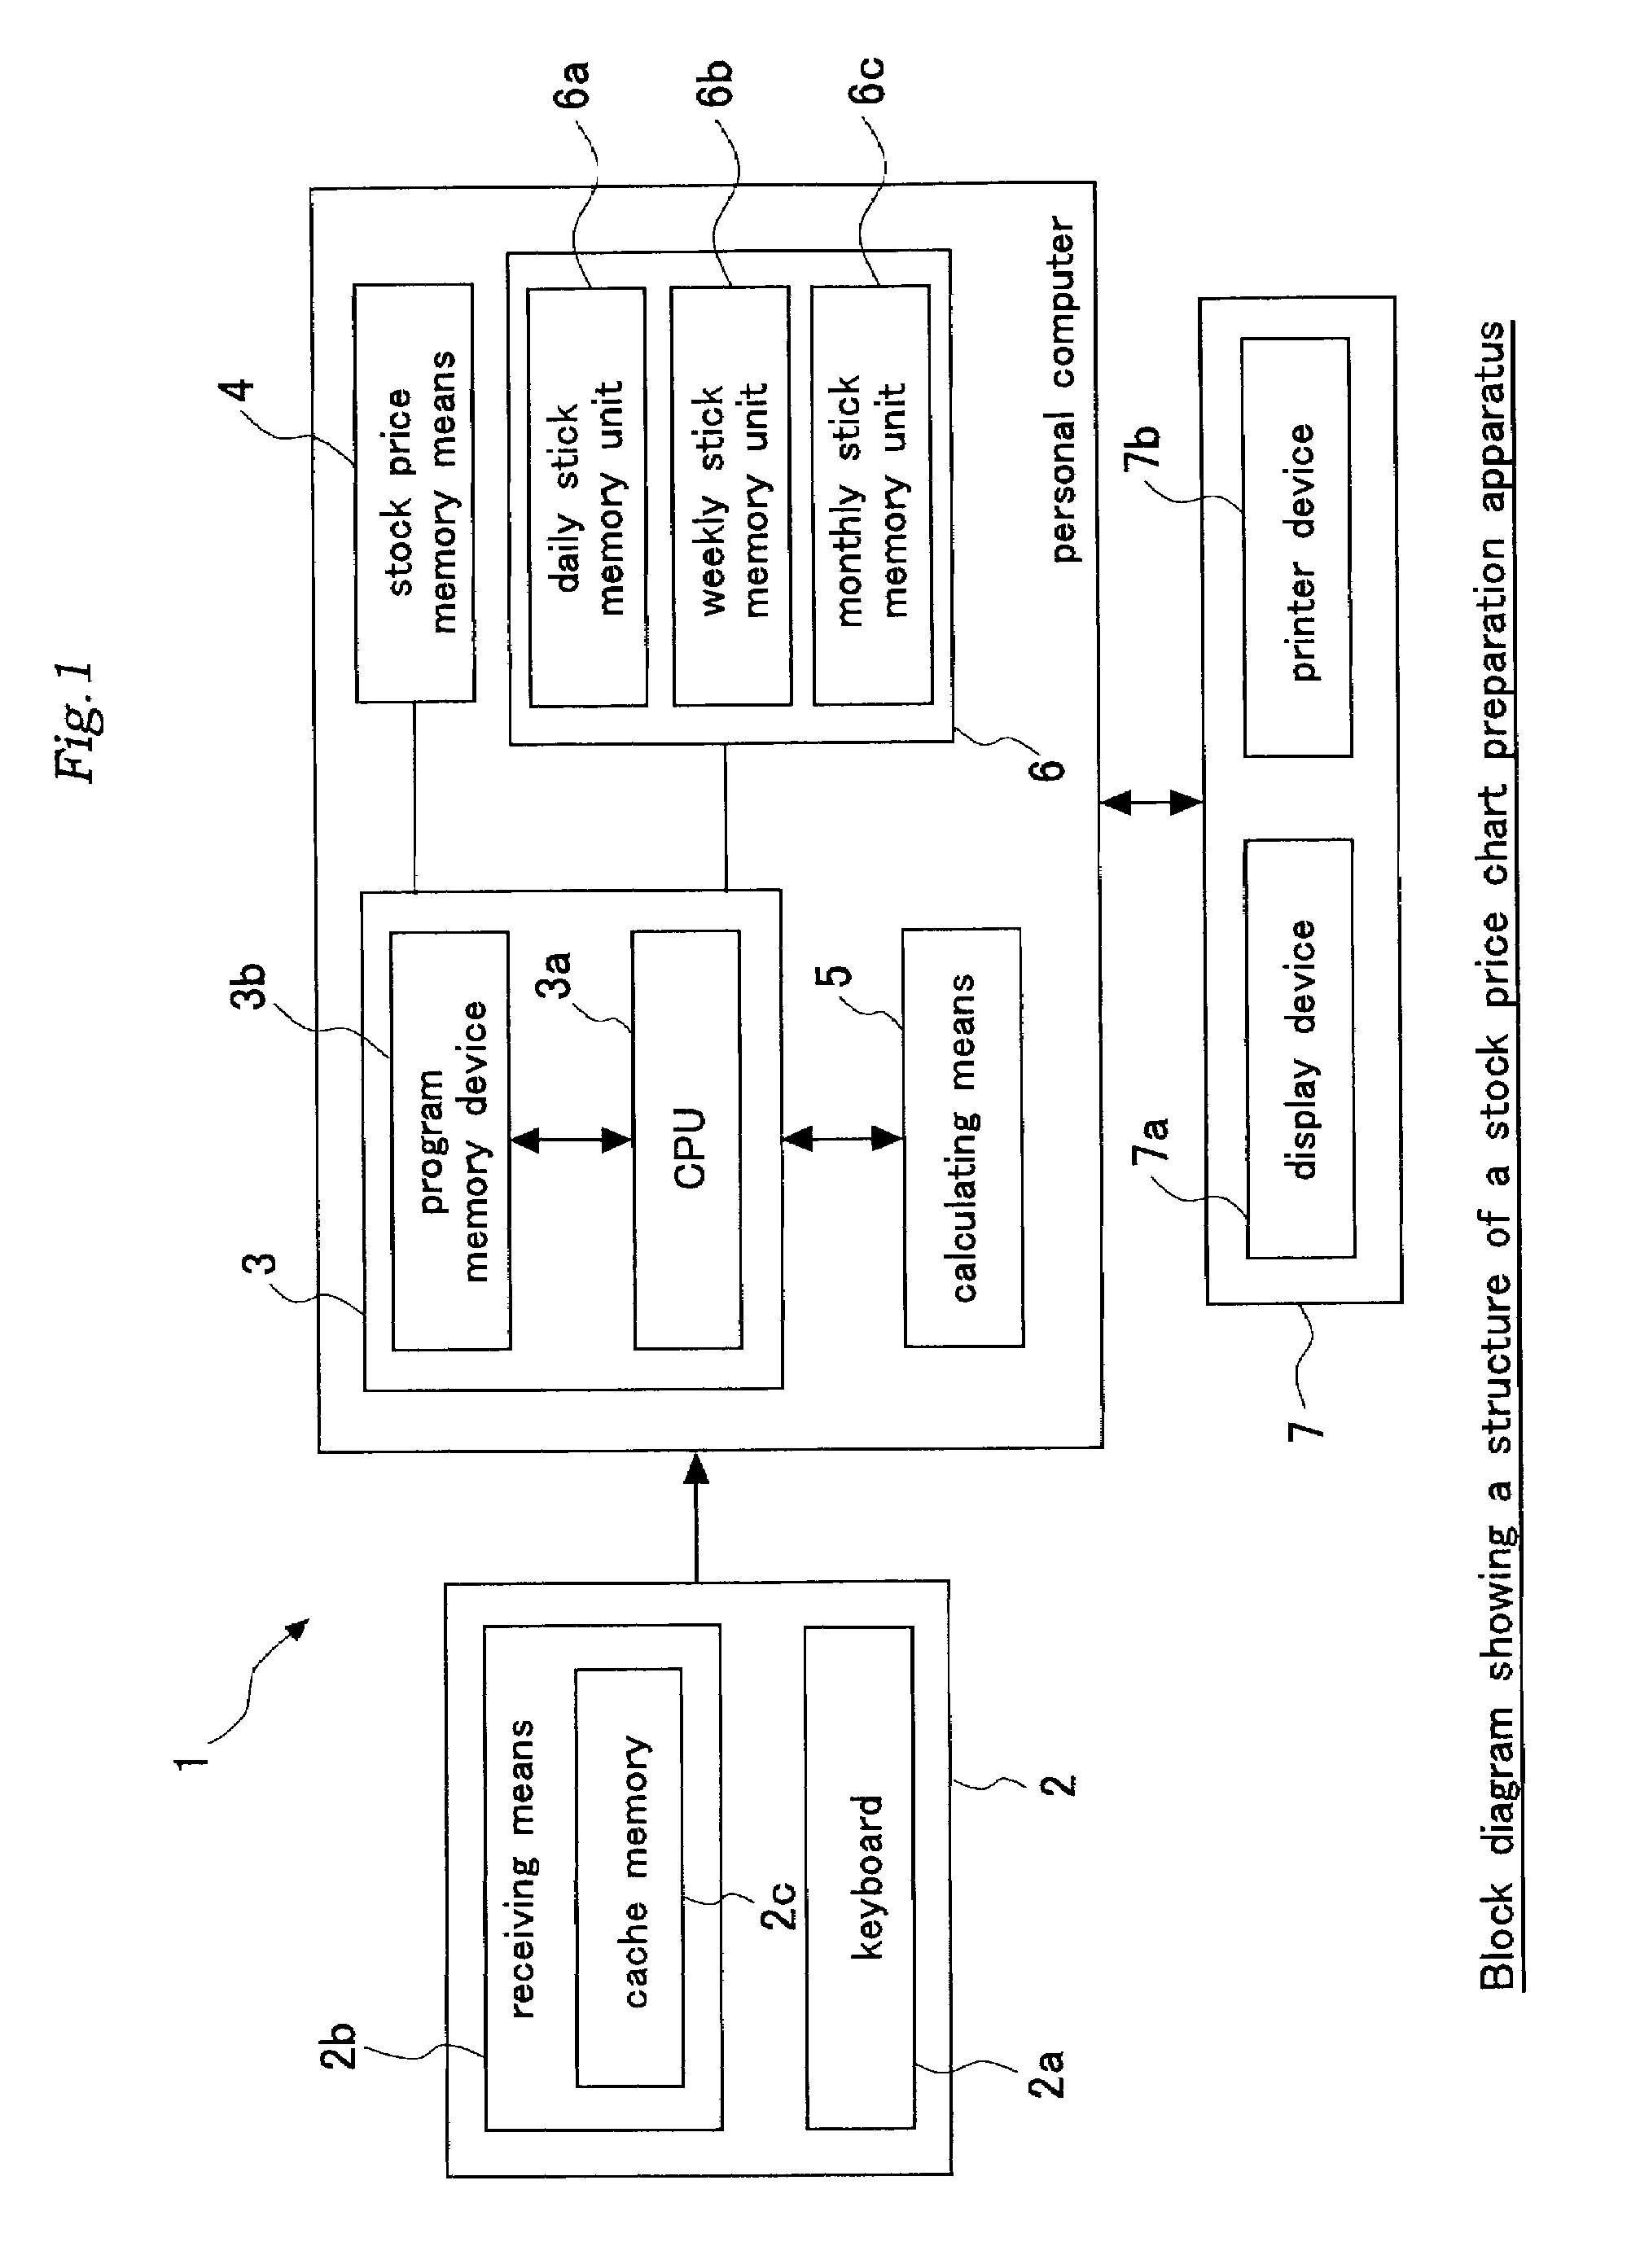
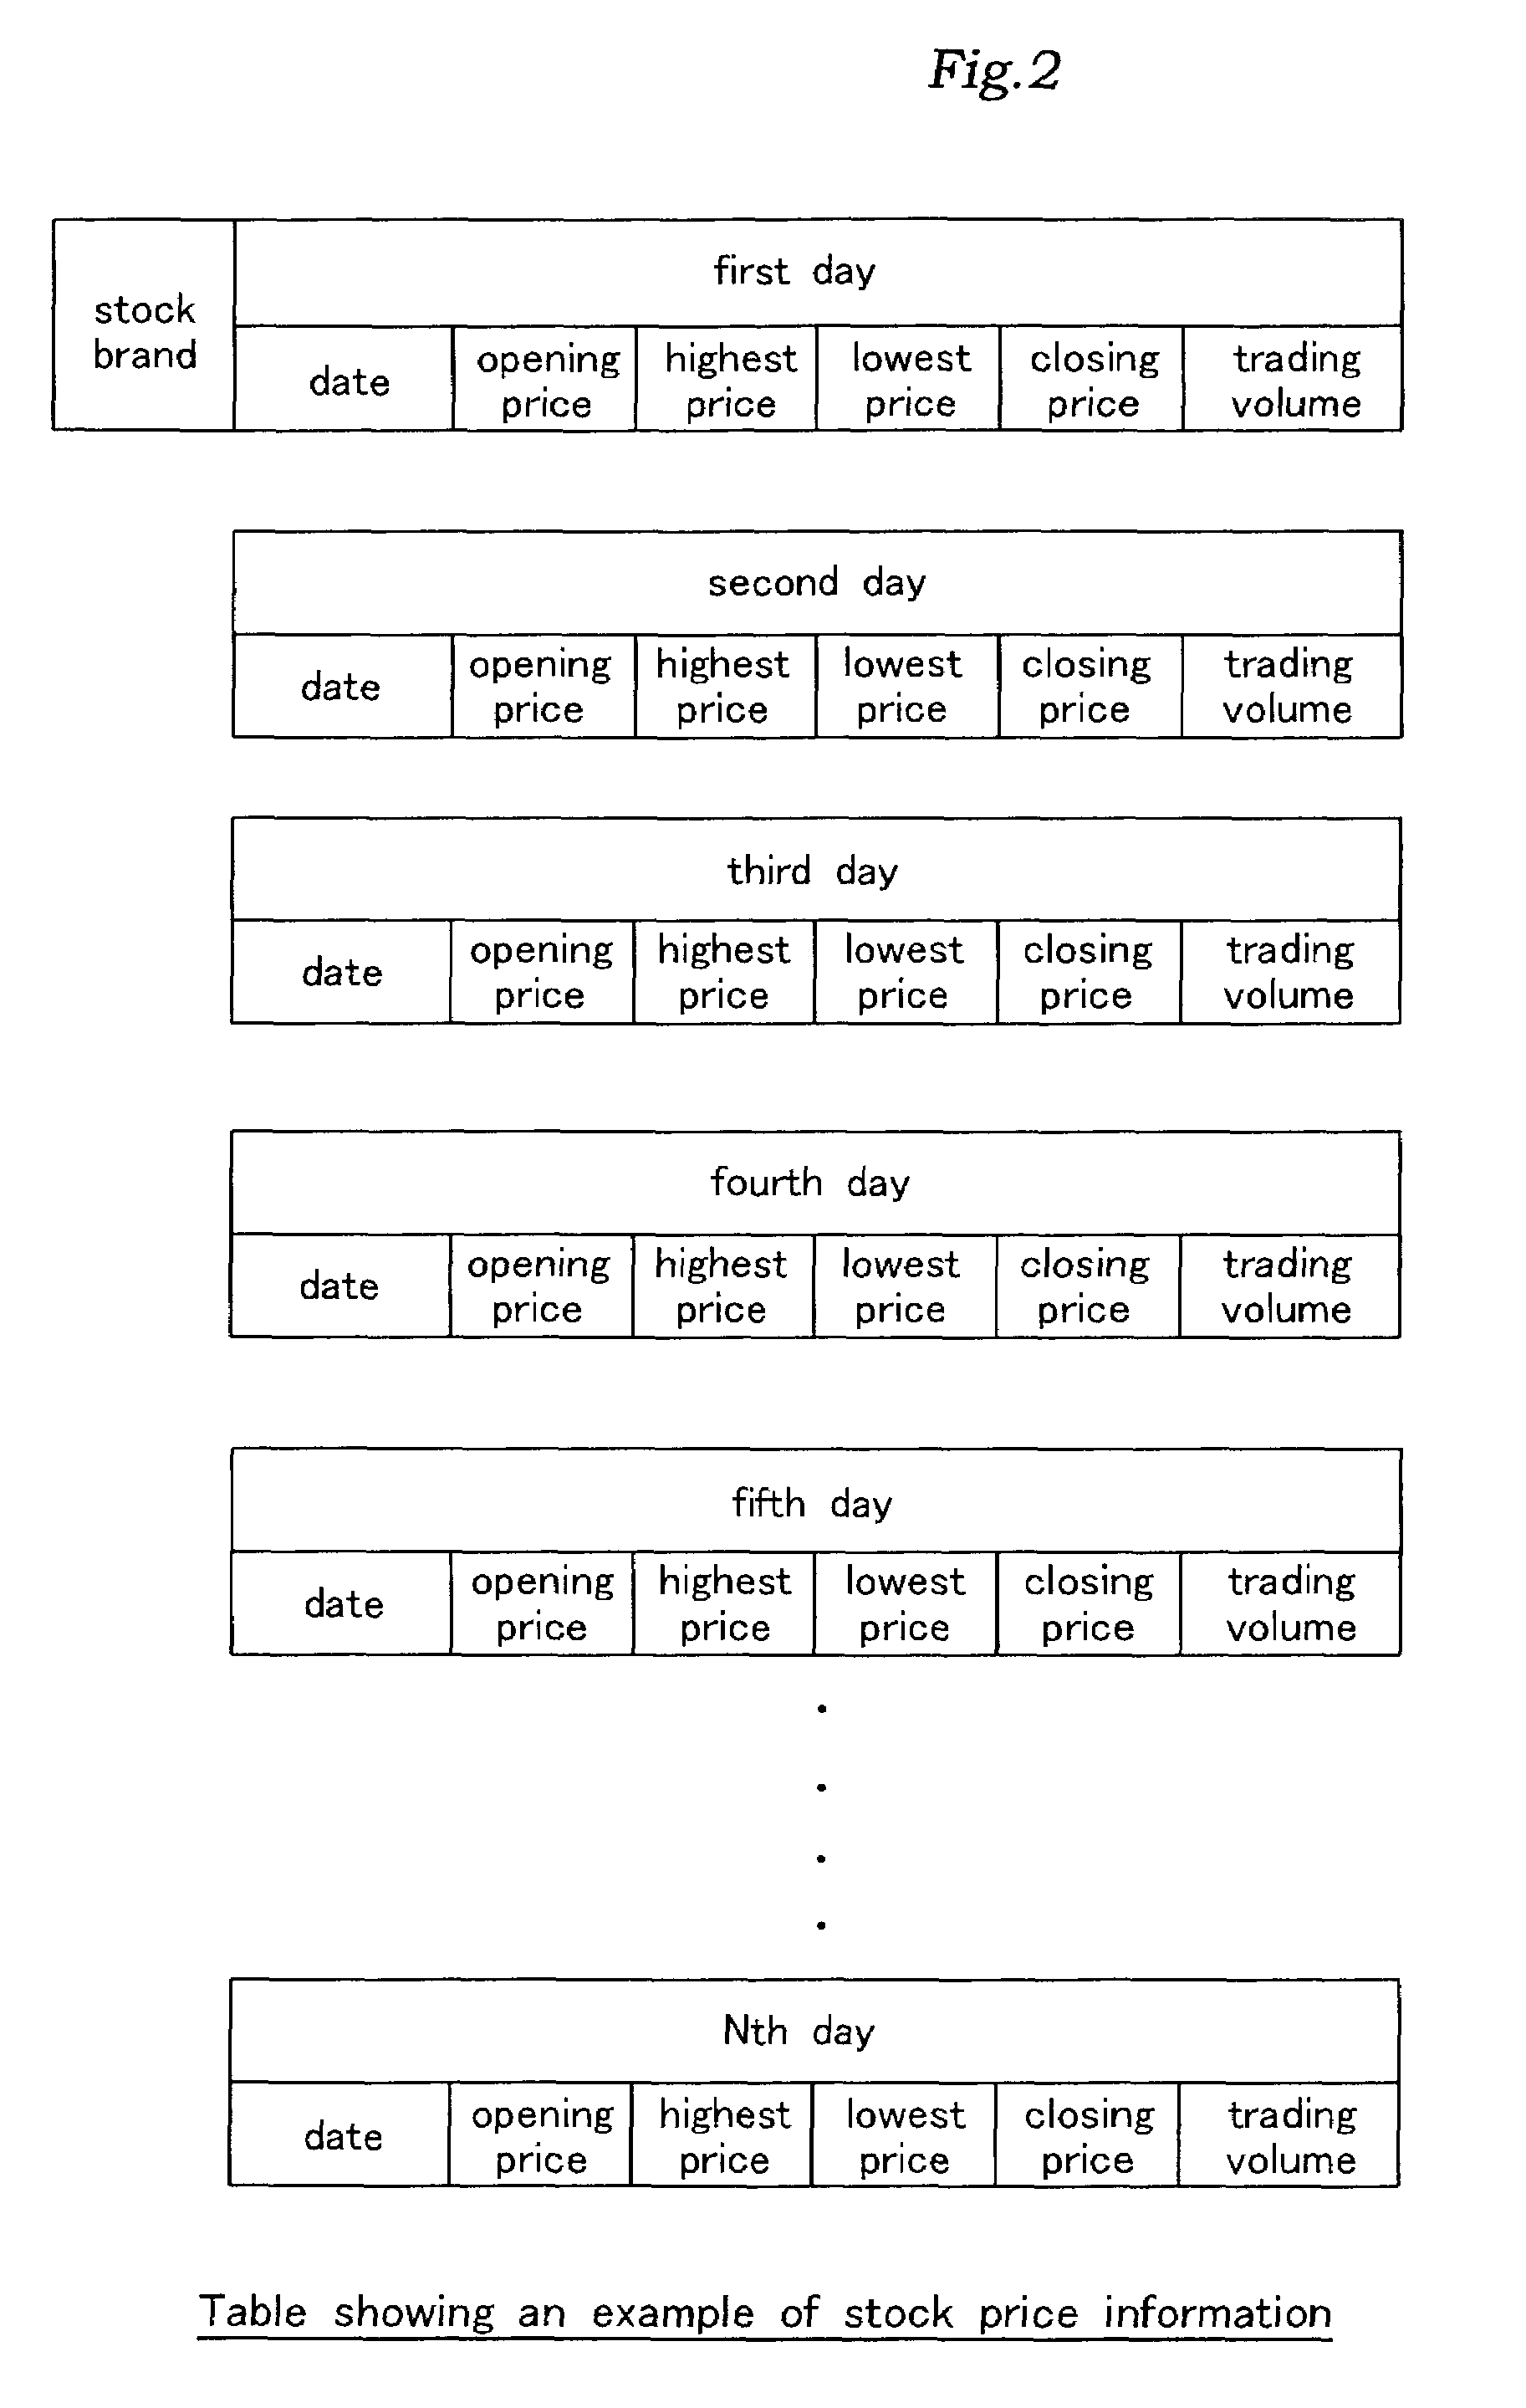
[0061]A stock price chart preparation apparatus according to the present invention comprising, means for storing closing price data for an inputted predetermined stock brand in time series; calculating means for calculating, for each of a plurality of specified days for which “sticks” should be displayed, an average closing prices of the present evaluation period based on a closing price for the present evaluation period and already obtained closing prices for a prescribed period before that and an average closing price for the previous evaluation period based on a closing price for the previous evaluation period and already obtained closing price for a prescribed period before that; first displaying means for displaying a “stick” having an average closing price for the present evaluation period and an average closing price for the previous evaluation period at either its upper end or lower end in time series on coordinates consisting of a price axis and a time axis together with an...


PUM


Abstract

In a stock price chart in which “sticks” for a predetermined stock brand are arranged in time series on coordinates consisting of a price axis and a time axis, wherein the “sticks” are arranged such that an upper end and a lower end of the “stick” show one of an average closing price for the present evaluation period and an average closing price for the previous evaluation period, respectively, an indication showing a magnitude relationship between an average closing price for the previous evaluation period and an average closing price for the present evaluation period, and a “line” connecting a coordinate point showing a closing price of the present evaluation period and an upper end or a lower end of a “stick” showing an average closing price for the present evaluation period and an indication showing a magnitude relationship between them are added to the “line”.

Description

BACKGROUND OF THE INVENTION[0001]1. Field of the Invention[0002]The present invention relates to a stock price chart in which “sticks” for a predetermined stock brand are arranged in time series on coordinates consisting of a price axis and a time axis and, in particular, to a stock price chart in which “sticks” and “lines” are drawn using only closing price data as stock price information.[0003]2. Description of the Related Art[0004]Appropriate decision of timing for selling or buying a stock is a subject common to people participating in stock trading. For this purpose, habitual analysis of a trend of a stock price is indispensable. As an example of most popular means with which people can learn a trend of a stock price, there is a stock price chart that is drawn based on various “sticks” (a candlestick, the Sakata Method of stick analysis, a method of representing stick added in the chart when the price moves conversely exceeding the previous three consecutive sticks). Among them...

Claims


Application Information

Patent Timeline
IPC IPC(8): G06Q40/00B42D15/00G06F3/048G06Q40/04
CPCG06Q40/00G06Q10/10
Inventor MASUDA, TOKUTARO
Owner MASUDA ECONOMIC RES INST
Why Eureka
Try Eureka