Cognitive spectrum analysis and information display techniques

a spectrum analysis and information display technology, applied in the direction of transmission, transmission monitoring, electrical equipment, etc., can solve the problems of interference with the operation of the wlan, the overall wireless utility (and user satisfaction) will collapse, and the signaling protocols used by devices in the unlicensed band are not designed to coopera

Active Publication Date: 2008-12-16
CISCO TECH INC
View PDF39 Cites 99 Cited by
  • Summary
  • Abstract
  • Description
  • Claims
  • Application Information

AI Technical Summary

Problems solved by technology

It is well recognized that as unlicensed band devices become more popular and their density in a given area increases, a “tragedy of the commons” effect will often become apparent and overall wireless utility (and user satisfaction) will collapse.
The types of signaling protocols used by devices in the unlicensed bands are not designed to cooperate with signals of other types also operating in the bands.
For example, a frequency hopping signal (e.g., a signal emitted from a device that uses the Bluetooth™ communication protocol or a signal emitted from certain cordless phones) may hop into the frequency channel of an IEEE 802.11 wireless local area network (WLAN), causing interference with operation of the WLAN.
In addition, other non-communication devices or systems, such as microwave ovens, may emit energy in these unlicensed bands.
This solution, however, is not workable for much longer, due to spectrum scarcity and to the less attractive technical characteristics of the higher bands (decreased signal propagation and the inability to penetrate surfaces).
WLANs can complicate existing network management schemes because they introduce the additional requirement of efficiently managing radio spectrum.
Current WLAN systems and management technology are focused on monitoring and managing activity at the network level of the WLAN, but provide little or no capability to monitor the frequency band where signals of multiple types (e.g., communication protocol / network types, device types, etc.) are present.
However, currently available spectrum analyzer devices only display plots or waveforms, with little or no additional information about the received or detected (via an antenna) over-the-air energy.

Method used


Image

  • Cognitive spectrum analysis and information display techniques
  • Cognitive spectrum analysis and information display techniques
  • Cognitive spectrum analysis and information display techniques

Examples


Embodiment Construction

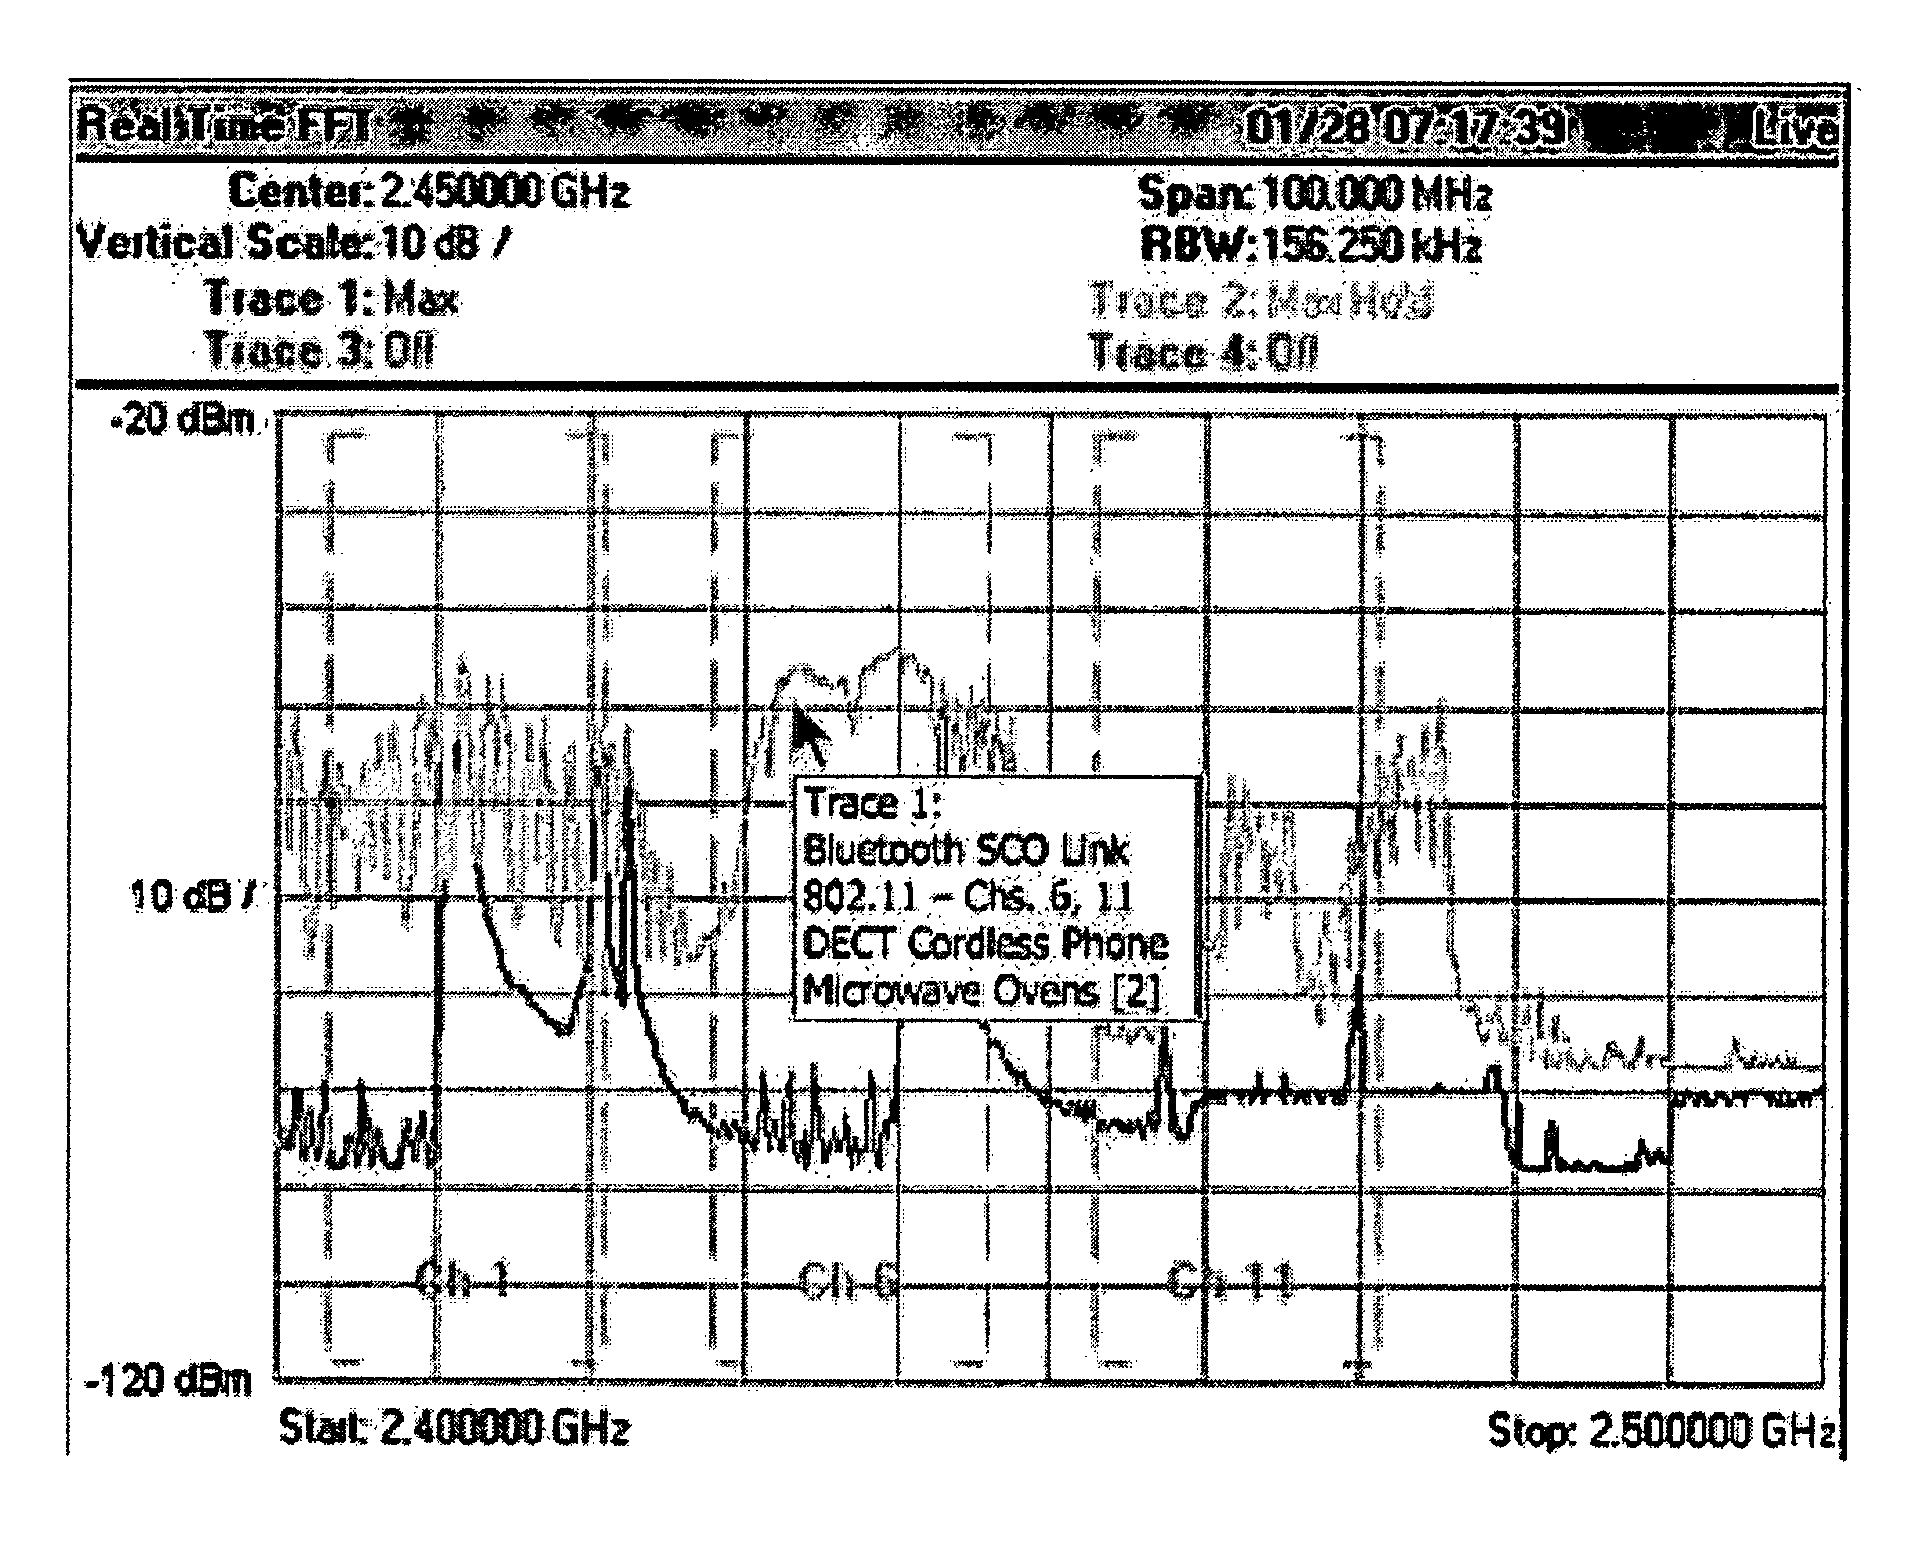
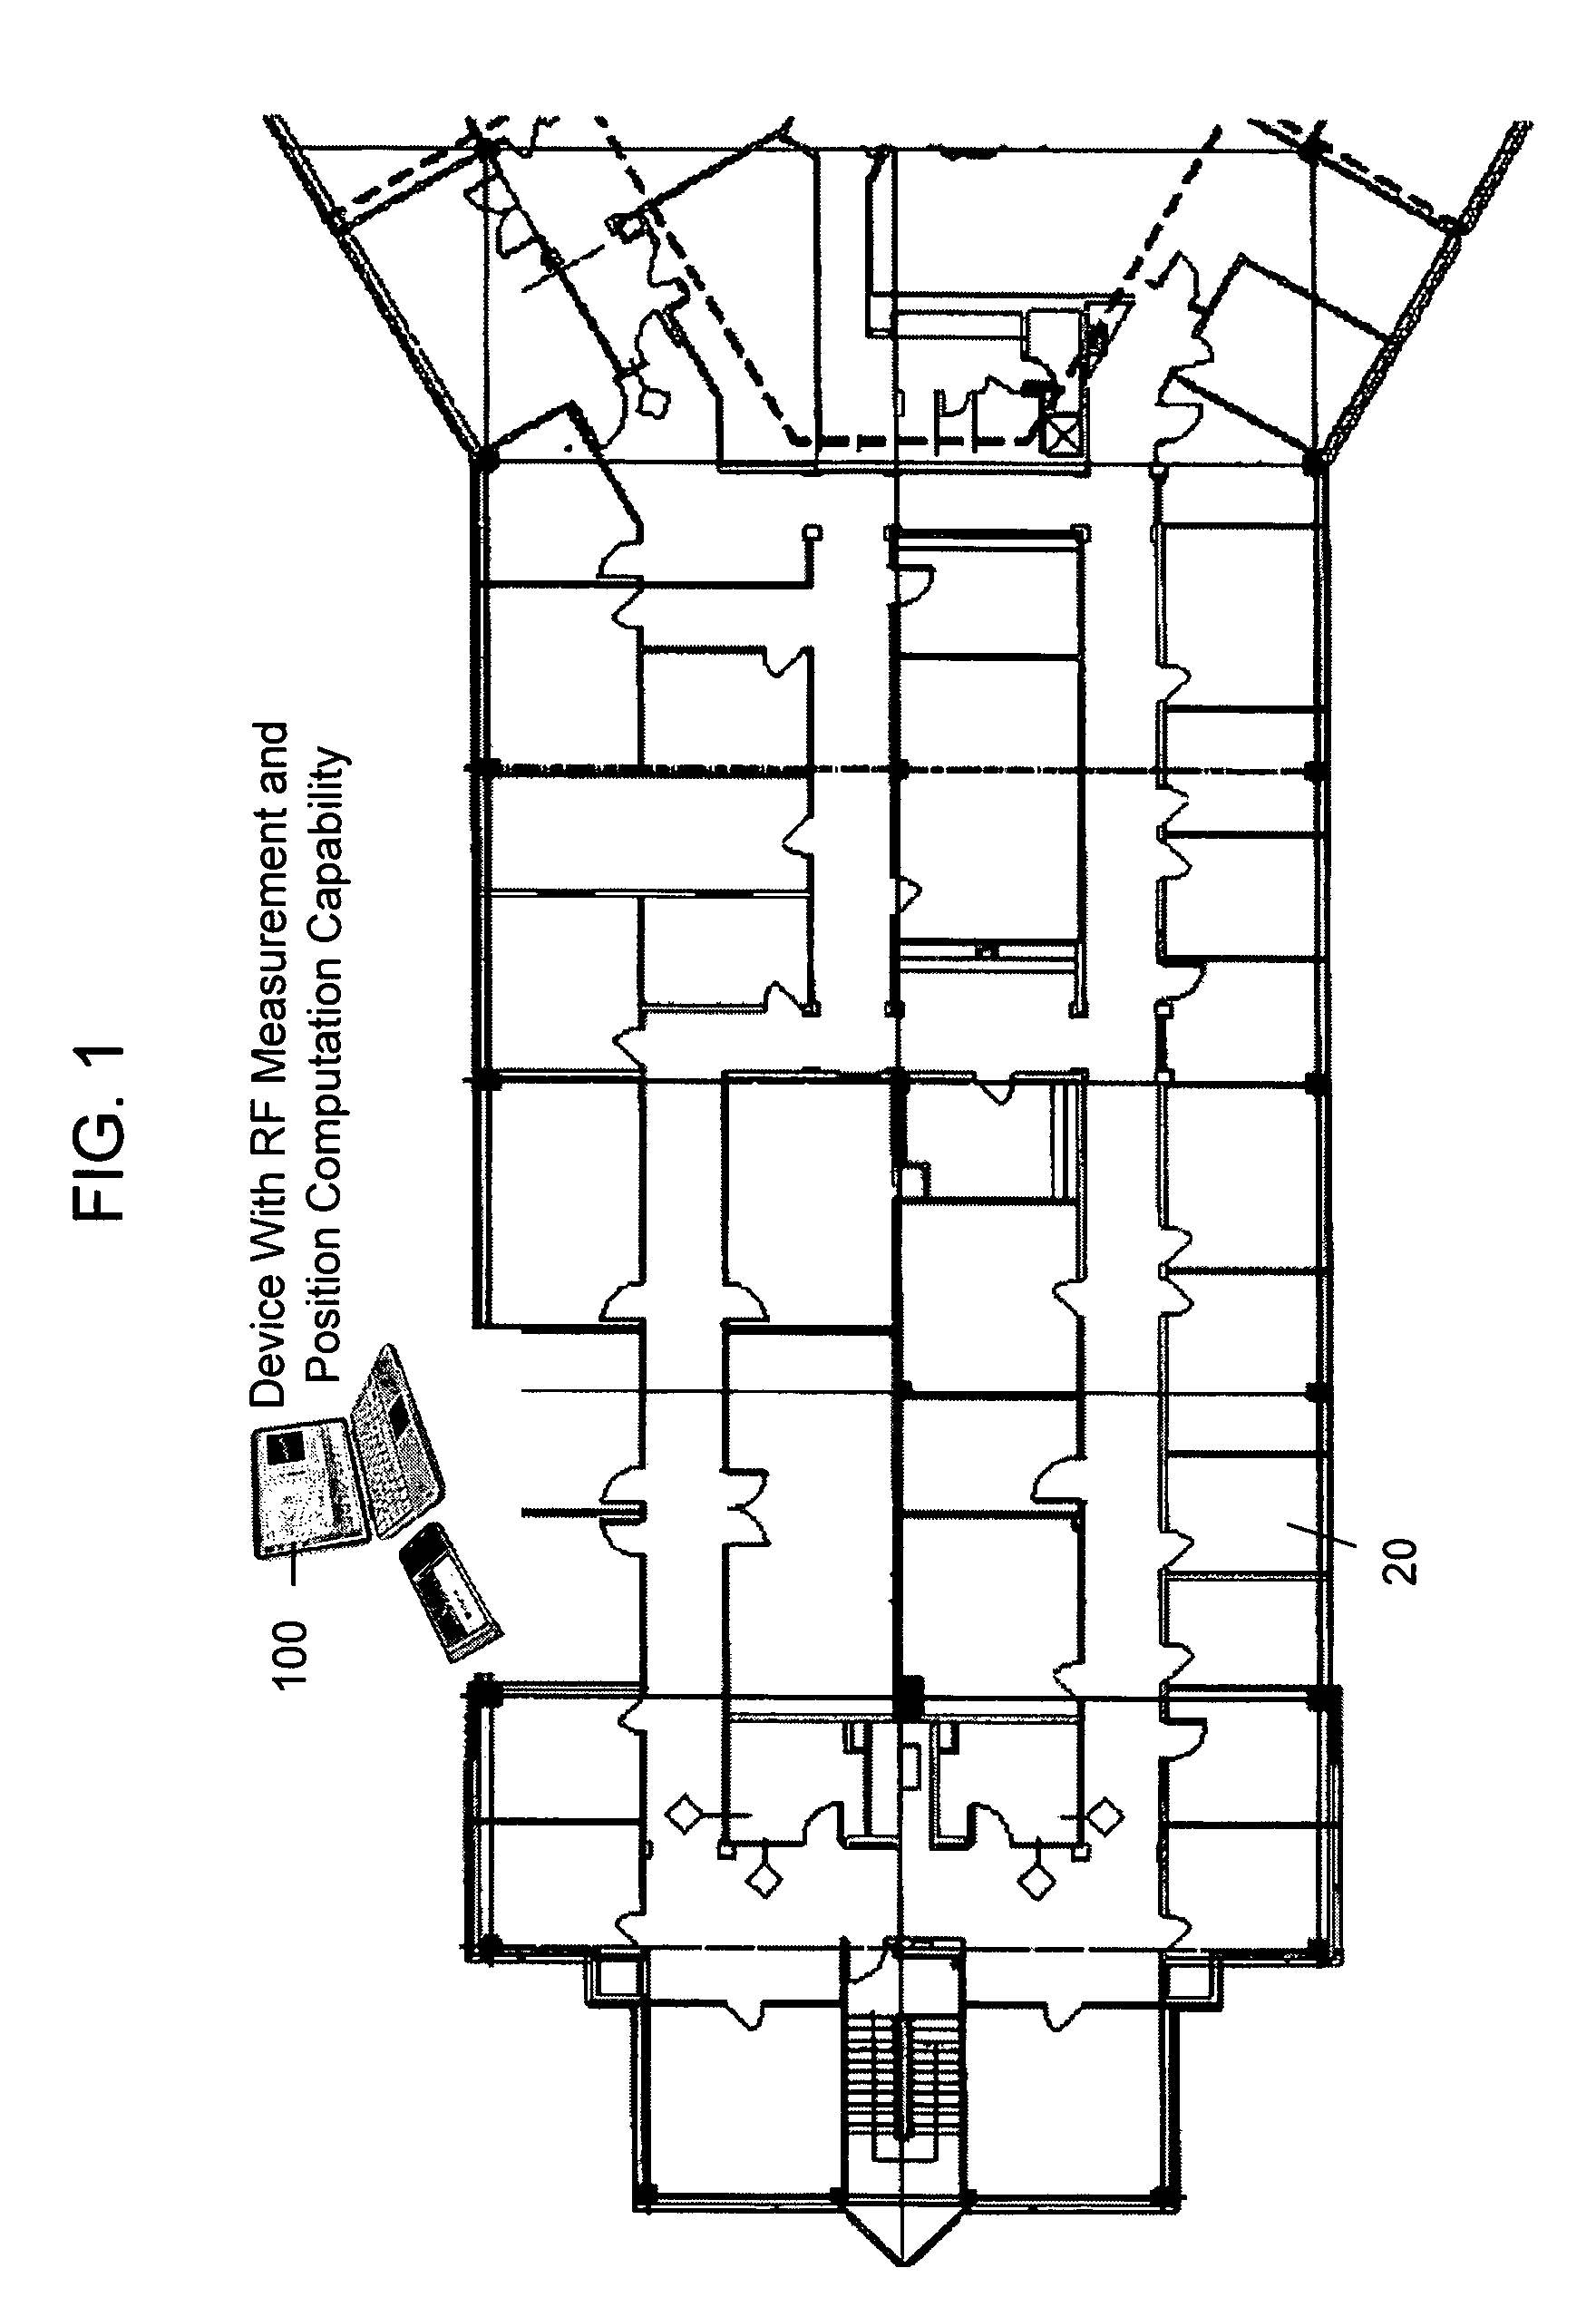
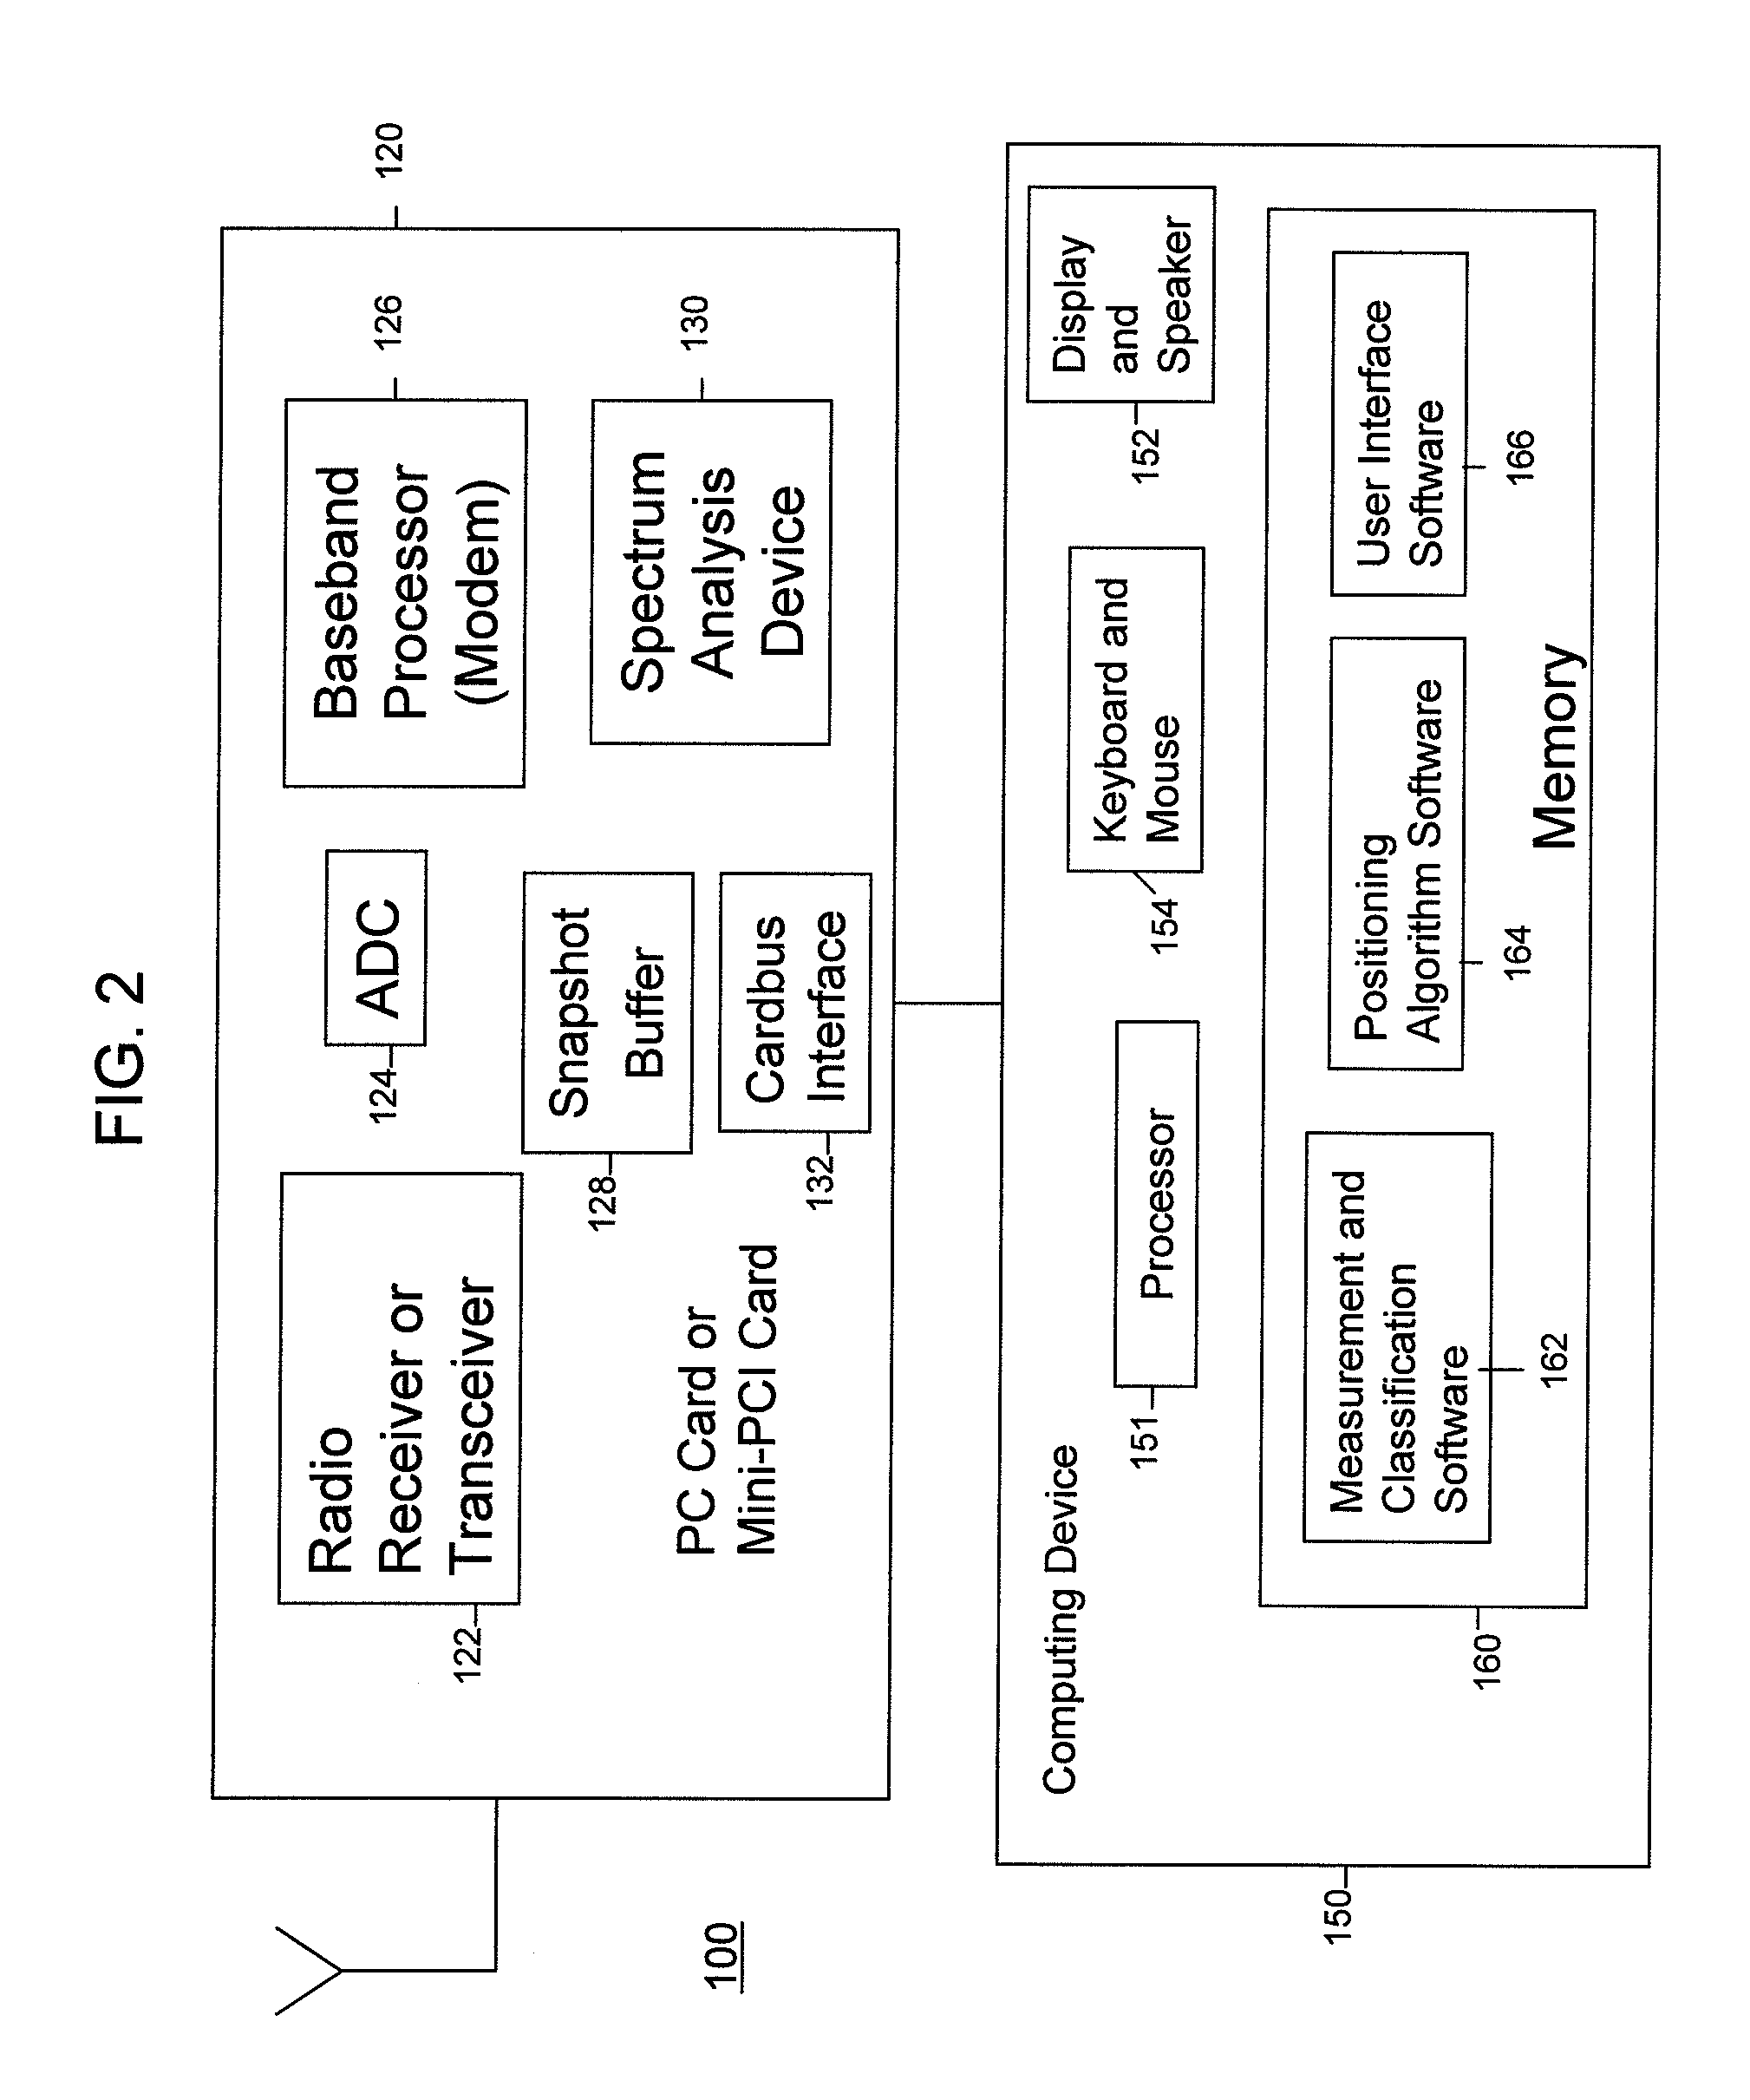
[0022]Referring first to FIG. 1, a radio sensor device 100 is shown that makes spectrum measurements of energy received in a frequency band or bands with respect to a region of interest represented by the map 20 of a region of interest. The radio sensor device 100 also has the capability of determining a position of one or more sources of energy that it receives. The radio sensor device 100 is described in more detail hereinafter in connection with FIG. 2. The term “interferer” is meant to include RF energy that may conflict in time and frequency with RF signal traffic of a certain communication standard or type. An example of the RF signal traffic is IEEE 802.11 wireless local area network (WLAN) traffic in the 2.4 GHz or 5 GHz bands. Examples of RF energy that would be considered interference to the WLAN traffic include microwave ovens, DECT cordless phone devices, Bluetooth™ devices, wireless video camera devices, infant (video or audio) monitor devices, etc.

[0023]An exemplary bl...


PUM


Abstract

A device and method are provided for monitoring and analyzing received over-the-air energy. According to one aspect, a device and method are provided for performing spectrum analysis on the received energy, generating data for displaying one or more plots associated with the analyzed received energy; determining a type of one or more signals occurring from the received energy; and generating data for displaying on the same display screen as said one or more plots, a name for the one or more signals determined to be occurring. Thus, unlike traditional spectrum analyzer devices that show plots or waveforms, the method and device described herein shows plots or waveforms and on the same screen a list of the devices causing those plots or waveforms. In addition, a filter may be applied to the plots or traces whereby plots are displayed for a particular user-specified device determined to be occurring, or a user-specified type or class of devices determined to be occurring. According to another aspect, the monitoring method and device involves performing spectrum analysis on the received energy, displaying one or more plots associated with the receive energy, and in response to determining a graphical user interface element is positioned over or near a display plot, generating data to display the name for the signal or signals causing that plot or waveform.

Description

RELATED APPLICATIONS[0001]This application claims priority to U.S. Provisional Application No. 60 / 651,141, filed Feb. 8, 2005, to U.S. Patent Application No. 60 / 684,975, filed on May 27, 2005, the entirety of each of which is incorporated herein by reference.BACKGROUND OF THE INVENTION[0002]The explosive growth in wireless applications and devices over the past few years has produced tremendous public interest benefits. Wireless networks and devices have been deployed in millions of offices, homes, and more recently, in increasing numbers of public areas. These wireless deployments are forecast to continue at an exciting pace and offer the promise of increased convenience and productivity.[0003]This growth, which is taking place mostly in the unlicensed bands, is not without its downsides. In the United States, the unlicensed bands established by the FCC consist of large portions of spectrum at 2.4 GHz and at 5 GHz, which are free to use. The FCC currently sets requirements for the ...

Claims


Application Information

Patent Timeline
Patent Type & Authority Patents(United States)
IPC IPC(8): H04B17/00H04Q7/20
CPCH04B17/327
Inventor SUGAR, GARY L.
Owner CISCO TECH INC
Why Eureka
Try Eureka