Quantifying graphics image difference

a technology of image difference and quantification, applied in the field of quantification of graphics image difference, can solve the problems of insufficiently representing the difference between image 1 and image 2, and the difference image, while easily calculated, may not be adequate, and the traditional technique of computing image difference fails to take into account the perceptual effects that may be related to the locality of image differences to other images. the effect of improving

Active Publication Date: 2009-06-09
NVIDIA CORP
View PDF5 Cites 37 Cited by
  • Summary
  • Abstract
  • Description
  • Claims
  • Application Information

AI Technical Summary

Benefits of technology

[0014]According to one embodiment of the invention, the composite difference image may be used in selecting an appropriate level of anisotropic filtering. The first graphic image may result from applying a lower level of anisotropic filtering, the second grap...

Problems solved by technology

A significant challenge in computing image differences relates to the fact that often, the computation must take into account differences between images as perceived by the human eye.
In other words, the simplistic pixel-by-pixel mathematical difference between two images may not be adequate.
Such a difference image, while easily calculated, may not adequately represent the difference between Image 1 and Image 2 as perceived by human vision.
However, these and o...

Method used


Image

  • Quantifying graphics image difference
  • Quantifying graphics image difference
  • Quantifying graphics image difference

Examples


example application i

Use of Difference Image to Select Anisotropic Filtering Level

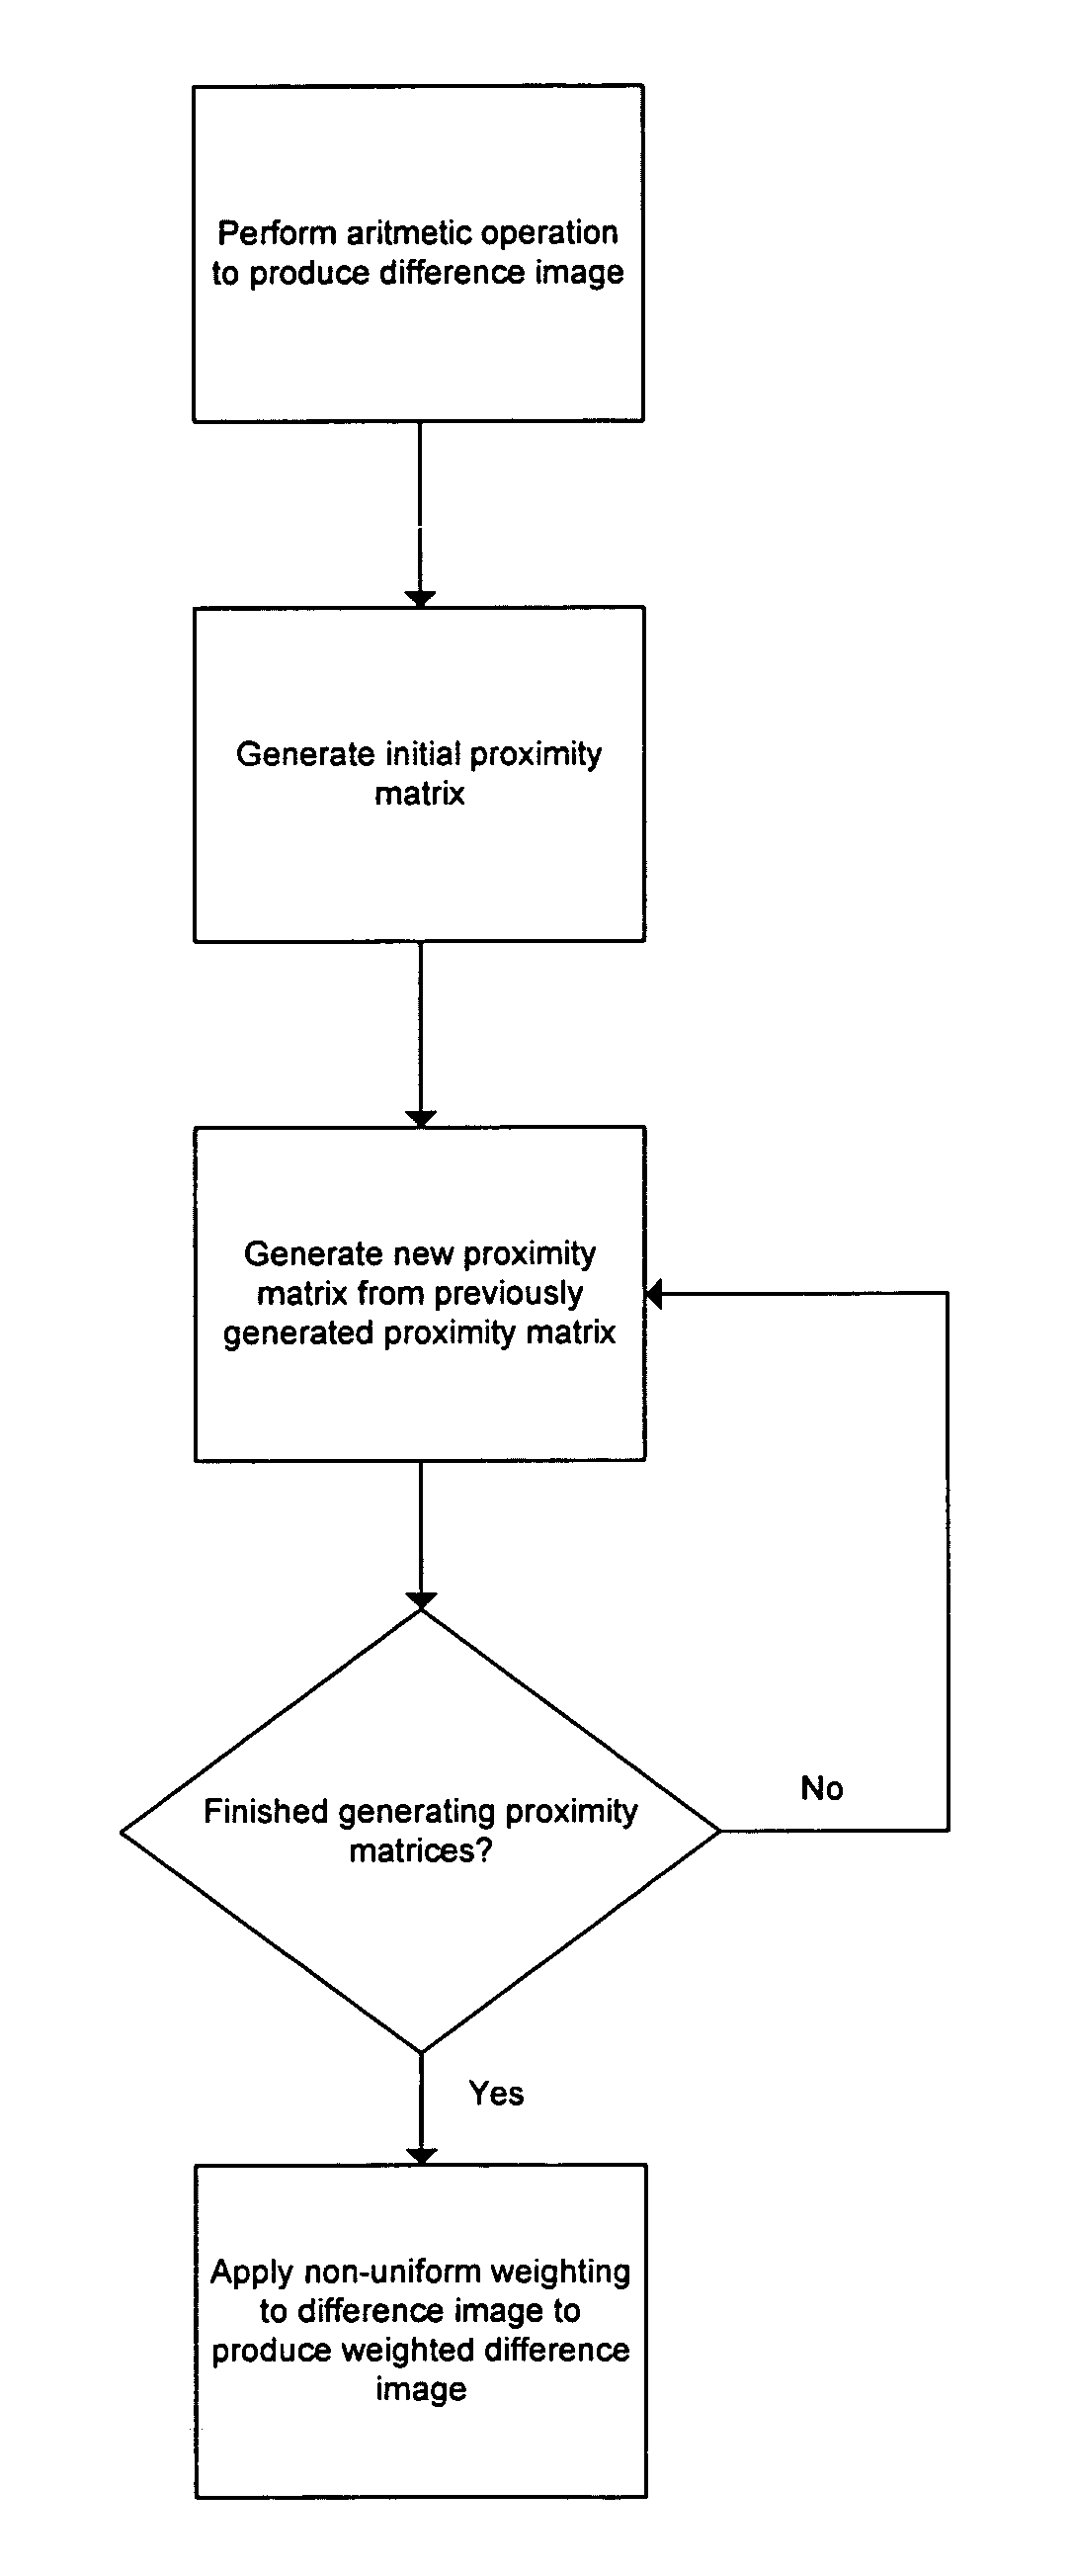
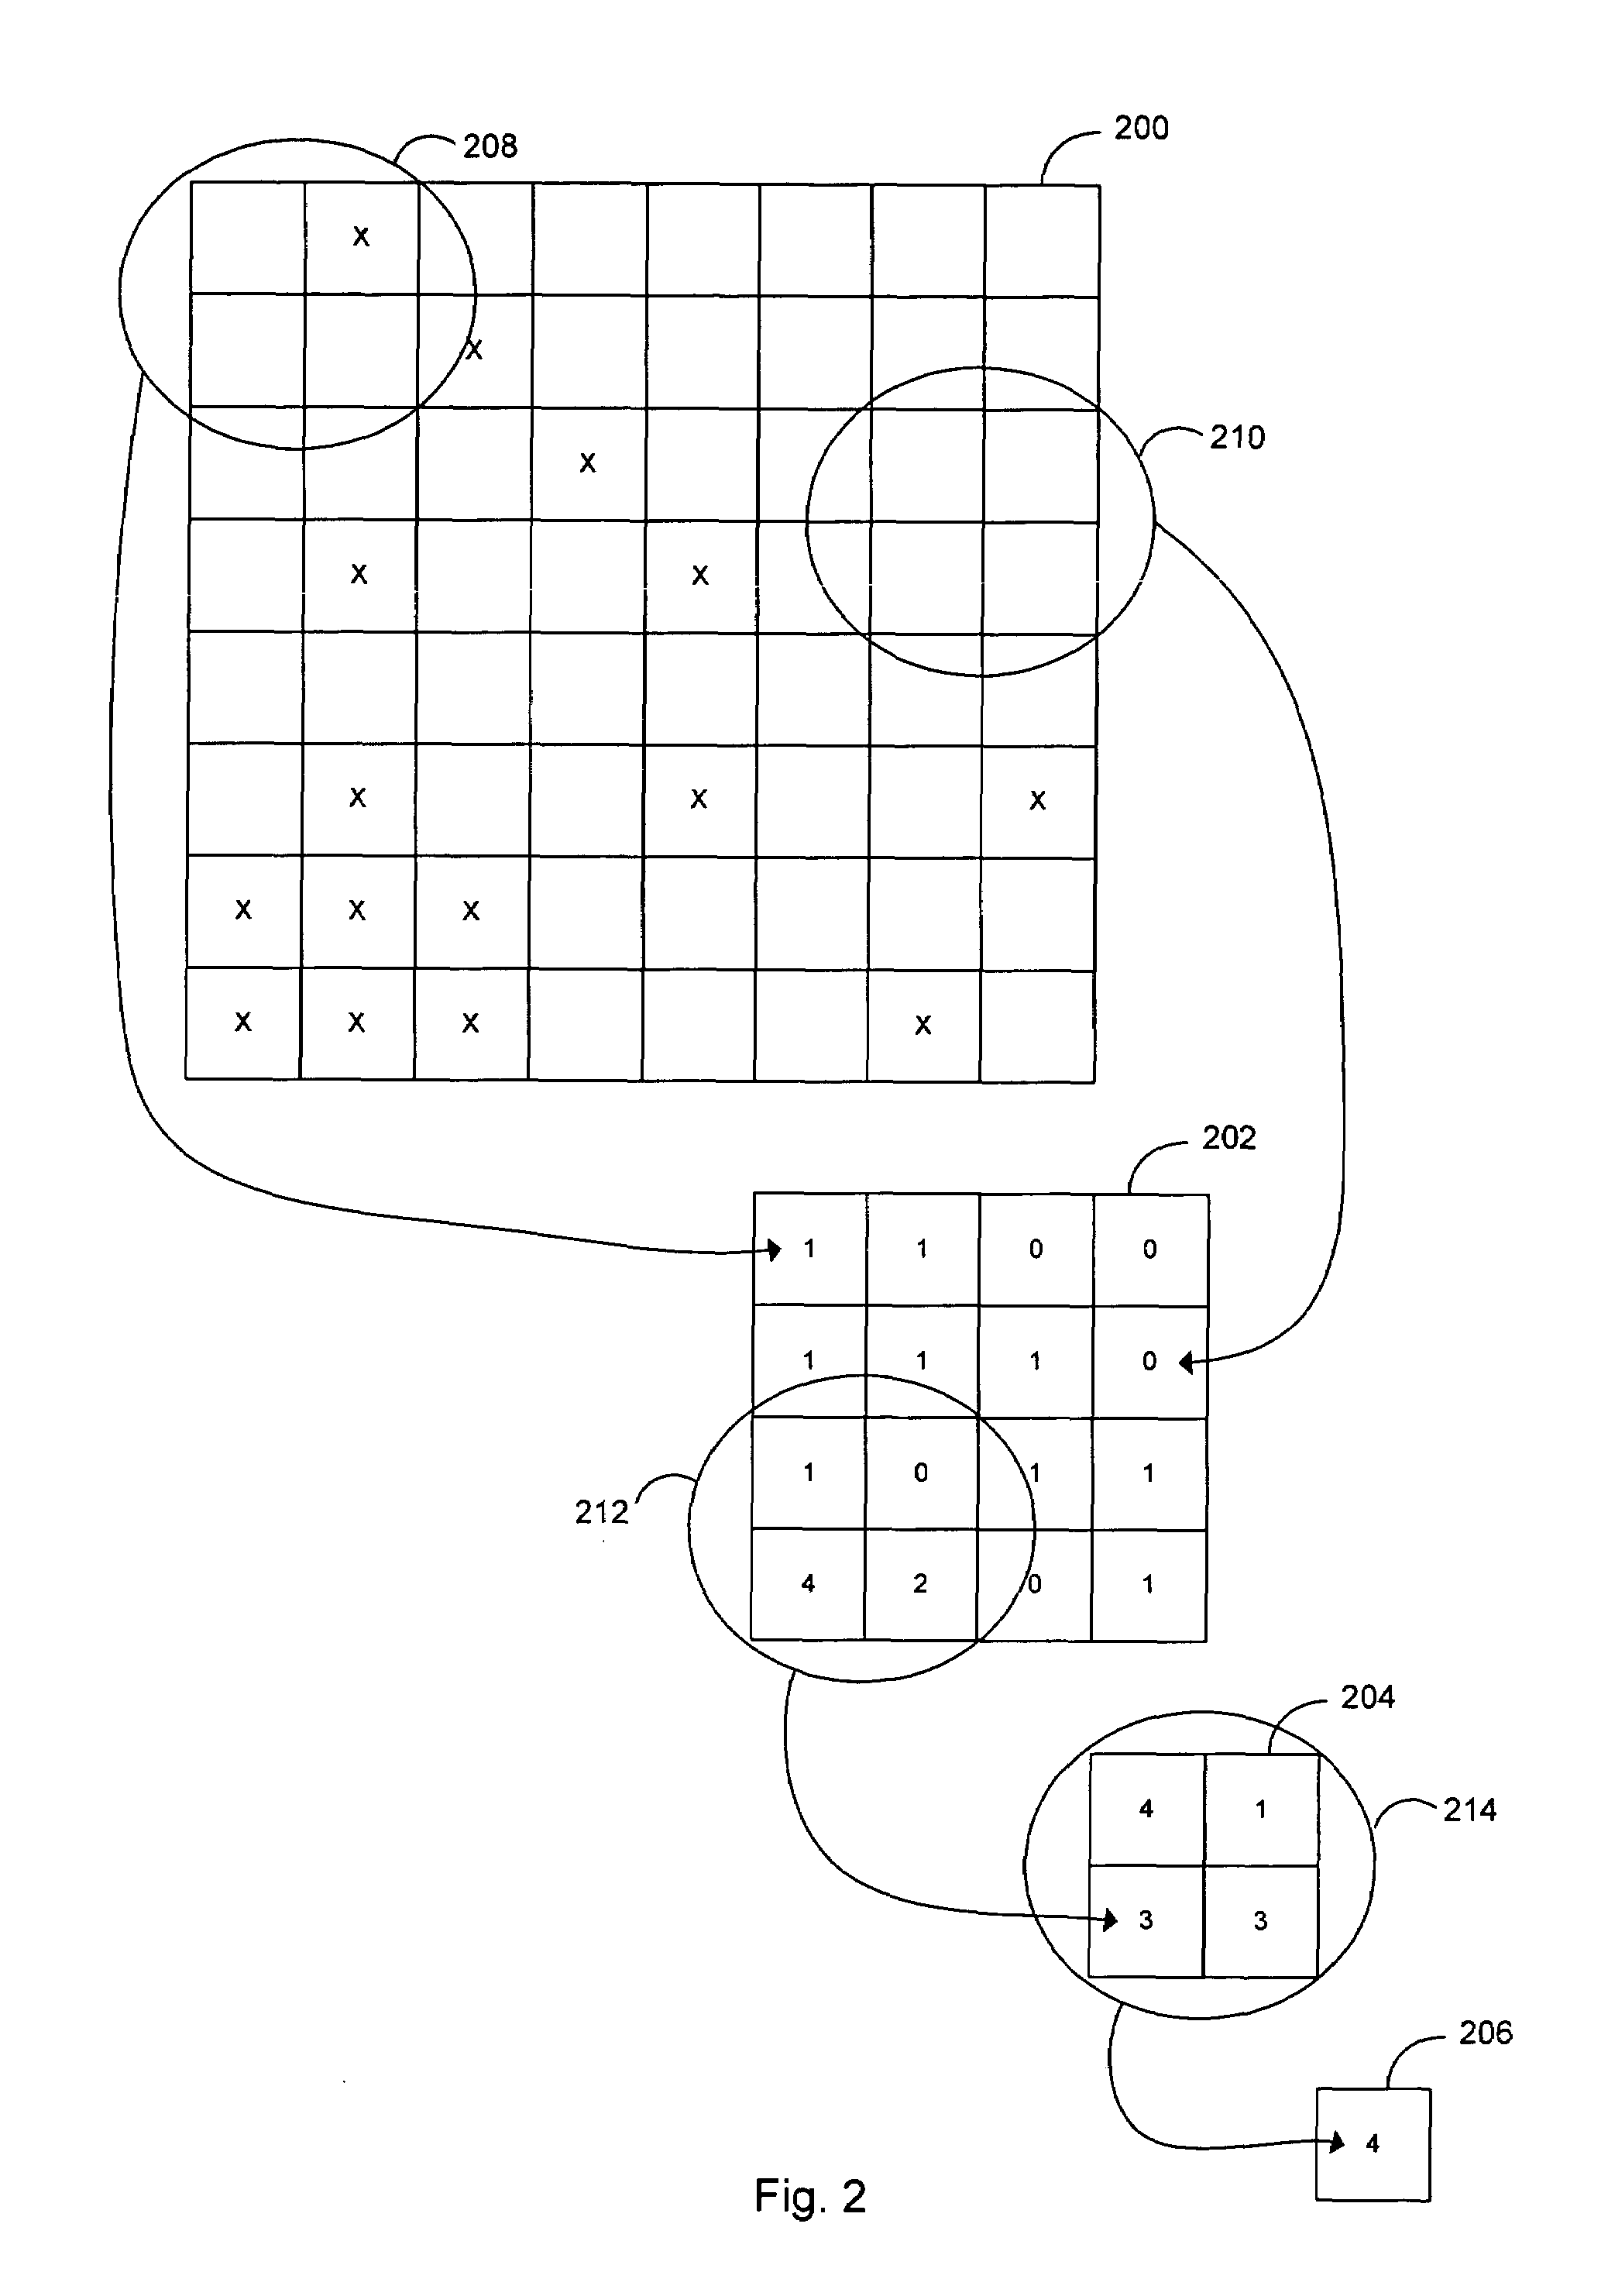
[0057]The techniques described above for computing difference between images may be utilized in a wide variety of applications. Some of these applications exist in the field of anisotropic filtering. Previously mentioned U.S. patent application Ser. No. 10 / 936,150, describes anisotropic filtering in further detail, but a brief explanation is also provided below. Anisotropic filtering is a filtering method that is often used to achieve improved texture mapping in graphics processing systems. Texture mapping involves the application of a two-dimensional surface onto a three-dimensional object. This process may be analogized as “wallpapering” or “tiling” the two-dimensional surface onto the three-dimensional object, in order to give the object the appearance of having an outer surface similar to that of the two-dimensional surface. The two-dimensional surface is composed of units commonly referred to as “texels,” and the coll...

example application ii

Use of Difference Image to Tune Fourier-Transform-Based Selection of Anisotropic Filtering Level

[0062]Previously mentioned U.S. patent application Ser. No. 10 / 936,150, also describes techniques for selecting an appropriate level of anisotropic filtering by utilizing a Fourier transform. Such a Fourier-transform-based technique may require significantly less computational resources, in comparison to a technique based on computation of differences between successive anisotropic filtering levels. To select an anisotropic filtering level for an image (which may be a texture bitmap), the image may first be transformed into frequency space representation by taking a Fourier transform, which can be accomplished by using a fast Fourier transform (FFT). Tne level of anisotropic filtering is selected according to an evaluation of where the transformed image is distributed in the frequency space representation. The principles of this technique are based on the recognition that an image that tr...


PUM


Abstract

Methods, apparatuses, and systems are presented for measuring difference between graphics images relating to performing an arithmetic operation involving a first graphics image comprising a plurality of first pixels and a second graphics image comprising a plurality of second pixels to produce a difference image comprising a plurality of difference pixels, generating measures of proximity from a plurality of ranges of observation within the difference image, wherein the measures of proximity represent spatial proximity of difference pixels to other difference pixels within the difference image, and applying non-uniform weighting to the difference pixels to produce a weighted difference image, wherein the non-uniform weighting depends on the measures of proximity generated from the plurality of ranges of observation.

Description

CROSS-REFERENCES TO RELATED APPLICATIONS[0001]This application is related to U.S. patent application Ser. No. 10 / 936,150, filed Sep. 7, 2004, entitled “Fourier Transform Optimized Anisotropic Filtering,” the entire disclosure of which is hereby incorporated by reference for all purposes.BACKGROUND OF THE INVENTION[0002]There exists a wide range of applications requiring the computation of differences between images. For example, differential image encoding algorithms may involve representation of a particular image in a series of images as simply the difference between the image and a preceding image. As another example, certain image processing techniques may incorporate computation of differences between pre-process and post-process images to the quantify the effects of a particular image processing procedure. These are just two simple examples. There may be many other present and future applications for the computation of image differences.[0003]FIG. 1 is a block diagram of an il...

Claims


Application Information

Patent Timeline
IPC IPC(8): G06K9/68G06V10/40
CPCG06K9/46G06K9/6215G06V10/40G06V10/761G06F18/22
Inventor KIEL, JEFFREY T.LARSEN, ELDON S.
Owner NVIDIA CORP
Why Eureka
Try Eureka