
System and method for presenting statistics

a statistical system and statistical technology, applied in the field of data processing, can solve the problems of reducing the ability to convey any but the most obvious changes, and difficult to assimilate through direct study, so as to eliminate or reduce disadvantages and problems associated

Inactive Publication Date: 2010-04-06
VERSATA DEV GROUP
View PDF30 Cites 114 Cited by
  • Summary
  • Abstract
  • Description
  • Claims
  • Application Information

AI Technical Summary

Benefits of technology

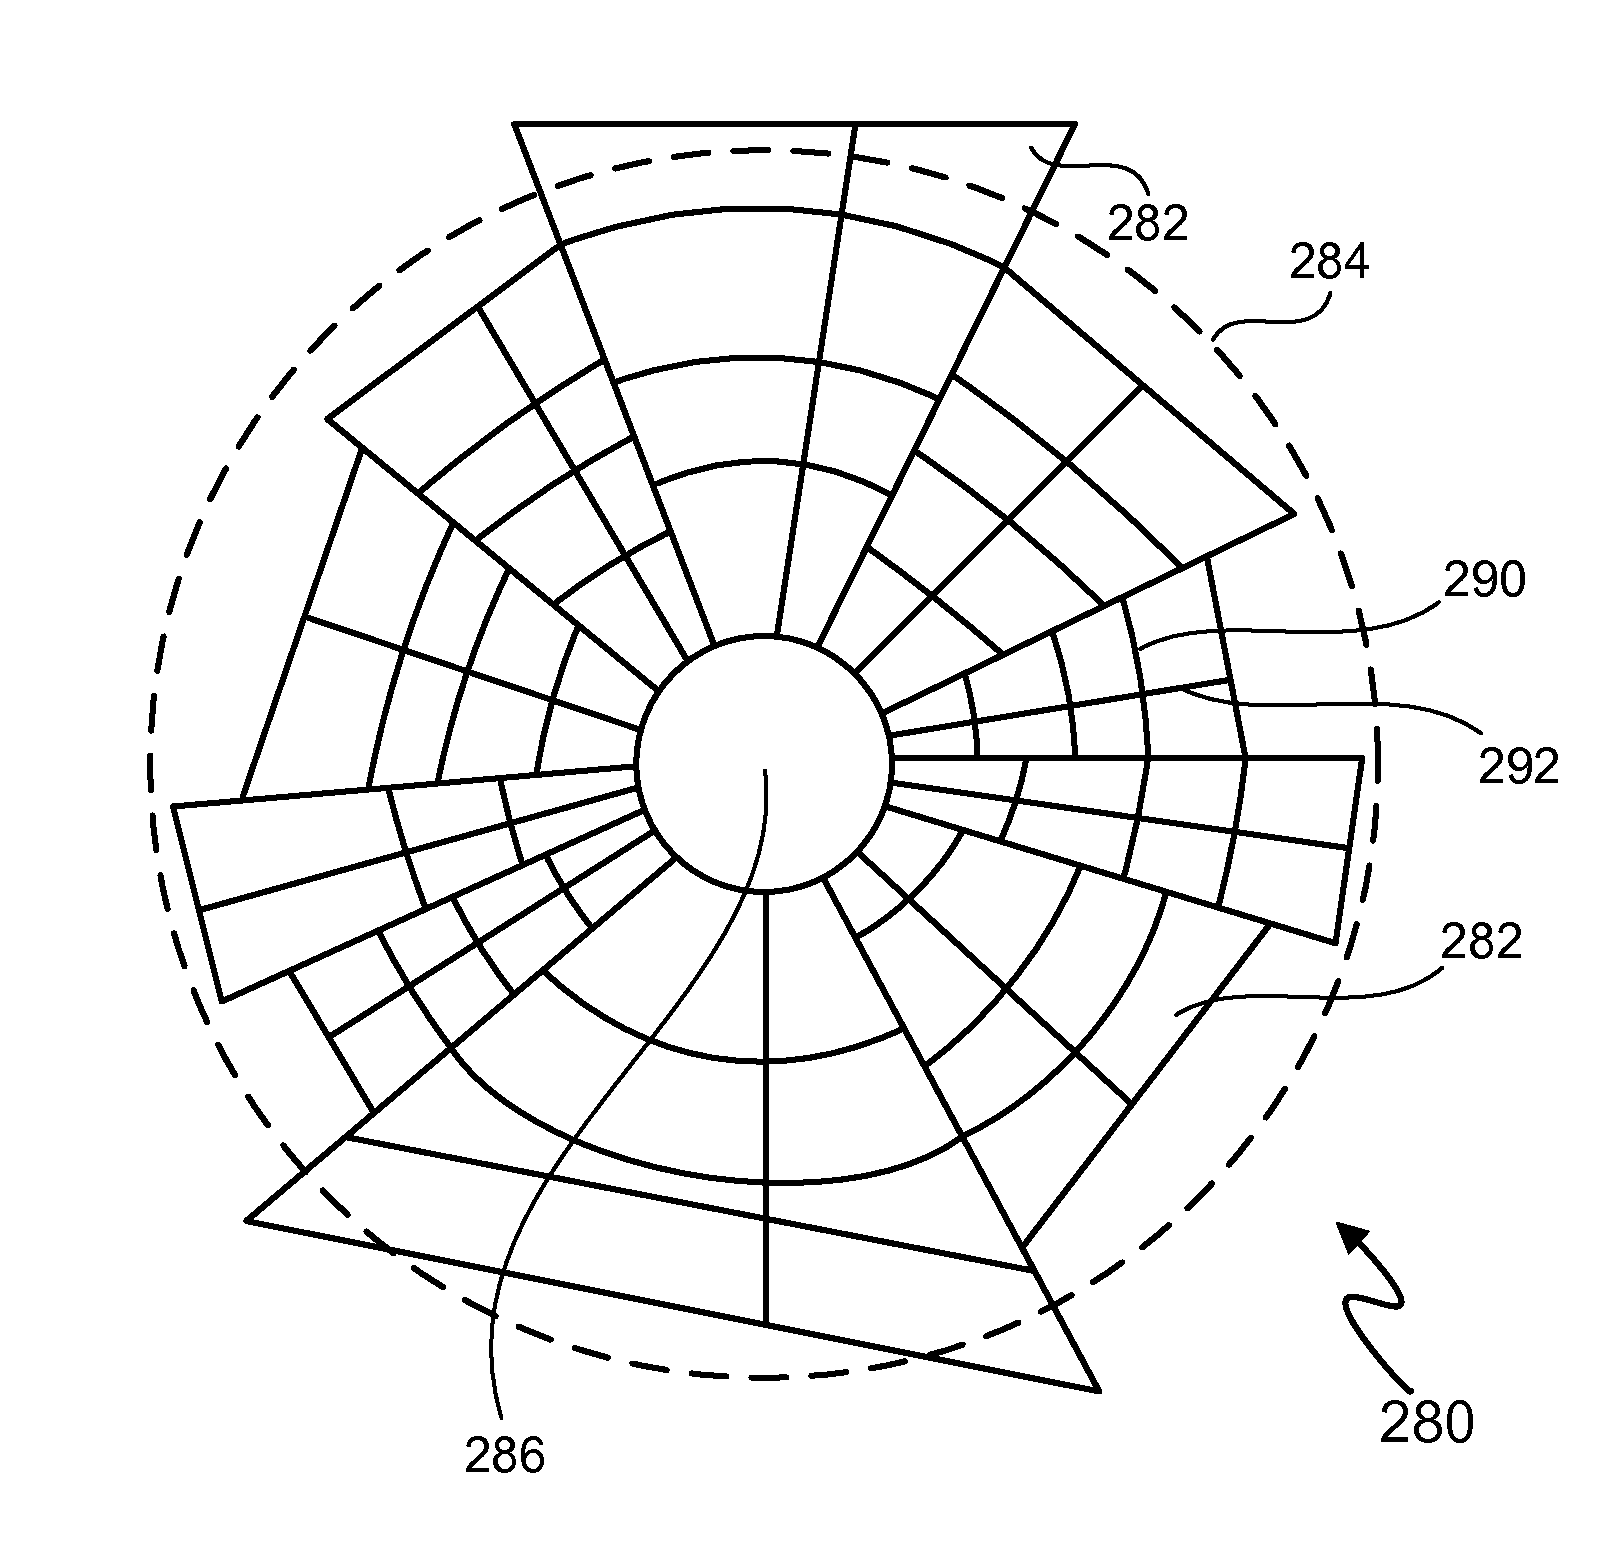
[0007]In accordance with the present invention, a system and method are provided that substantially eliminate or reduce disadvantages and problems associated with previously developed systems and methods for presenting statistics. In an example embodiment, the system produces a plane figure such as a radial graph to depict statistics for a set of data items. Multiple wedges or slices are displayed in the plane figure to categorize the set of data items into base subsets. A ring with a ring radius is also displayed, and the ring radius represents a first measure, such as an average quantity of data items, for at least one of the wedges. In addition, that wedge has a wedge radius which differs from the ring radius in proportion to a difference between a second measure and the first measure.

Problems solved by technology

However, standard pie charts are not designed to present results that include different values for three or more parameters.
Moreover, as the number of charts to be presented within a given presentation space increases, the size of each chart must decrease, which further reduces the ability to convey any but the most obvious of changes.
However, such statistics are difficult to assimilate through direct study, and conventional data presentation facilities lack effective means for presenting summaries of such data.

Method used


Image

  • System and method for presenting statistics
  • System and method for presenting statistics
  • System and method for presenting statistics

Examples


example embodiment (

Example Embodiment(s)

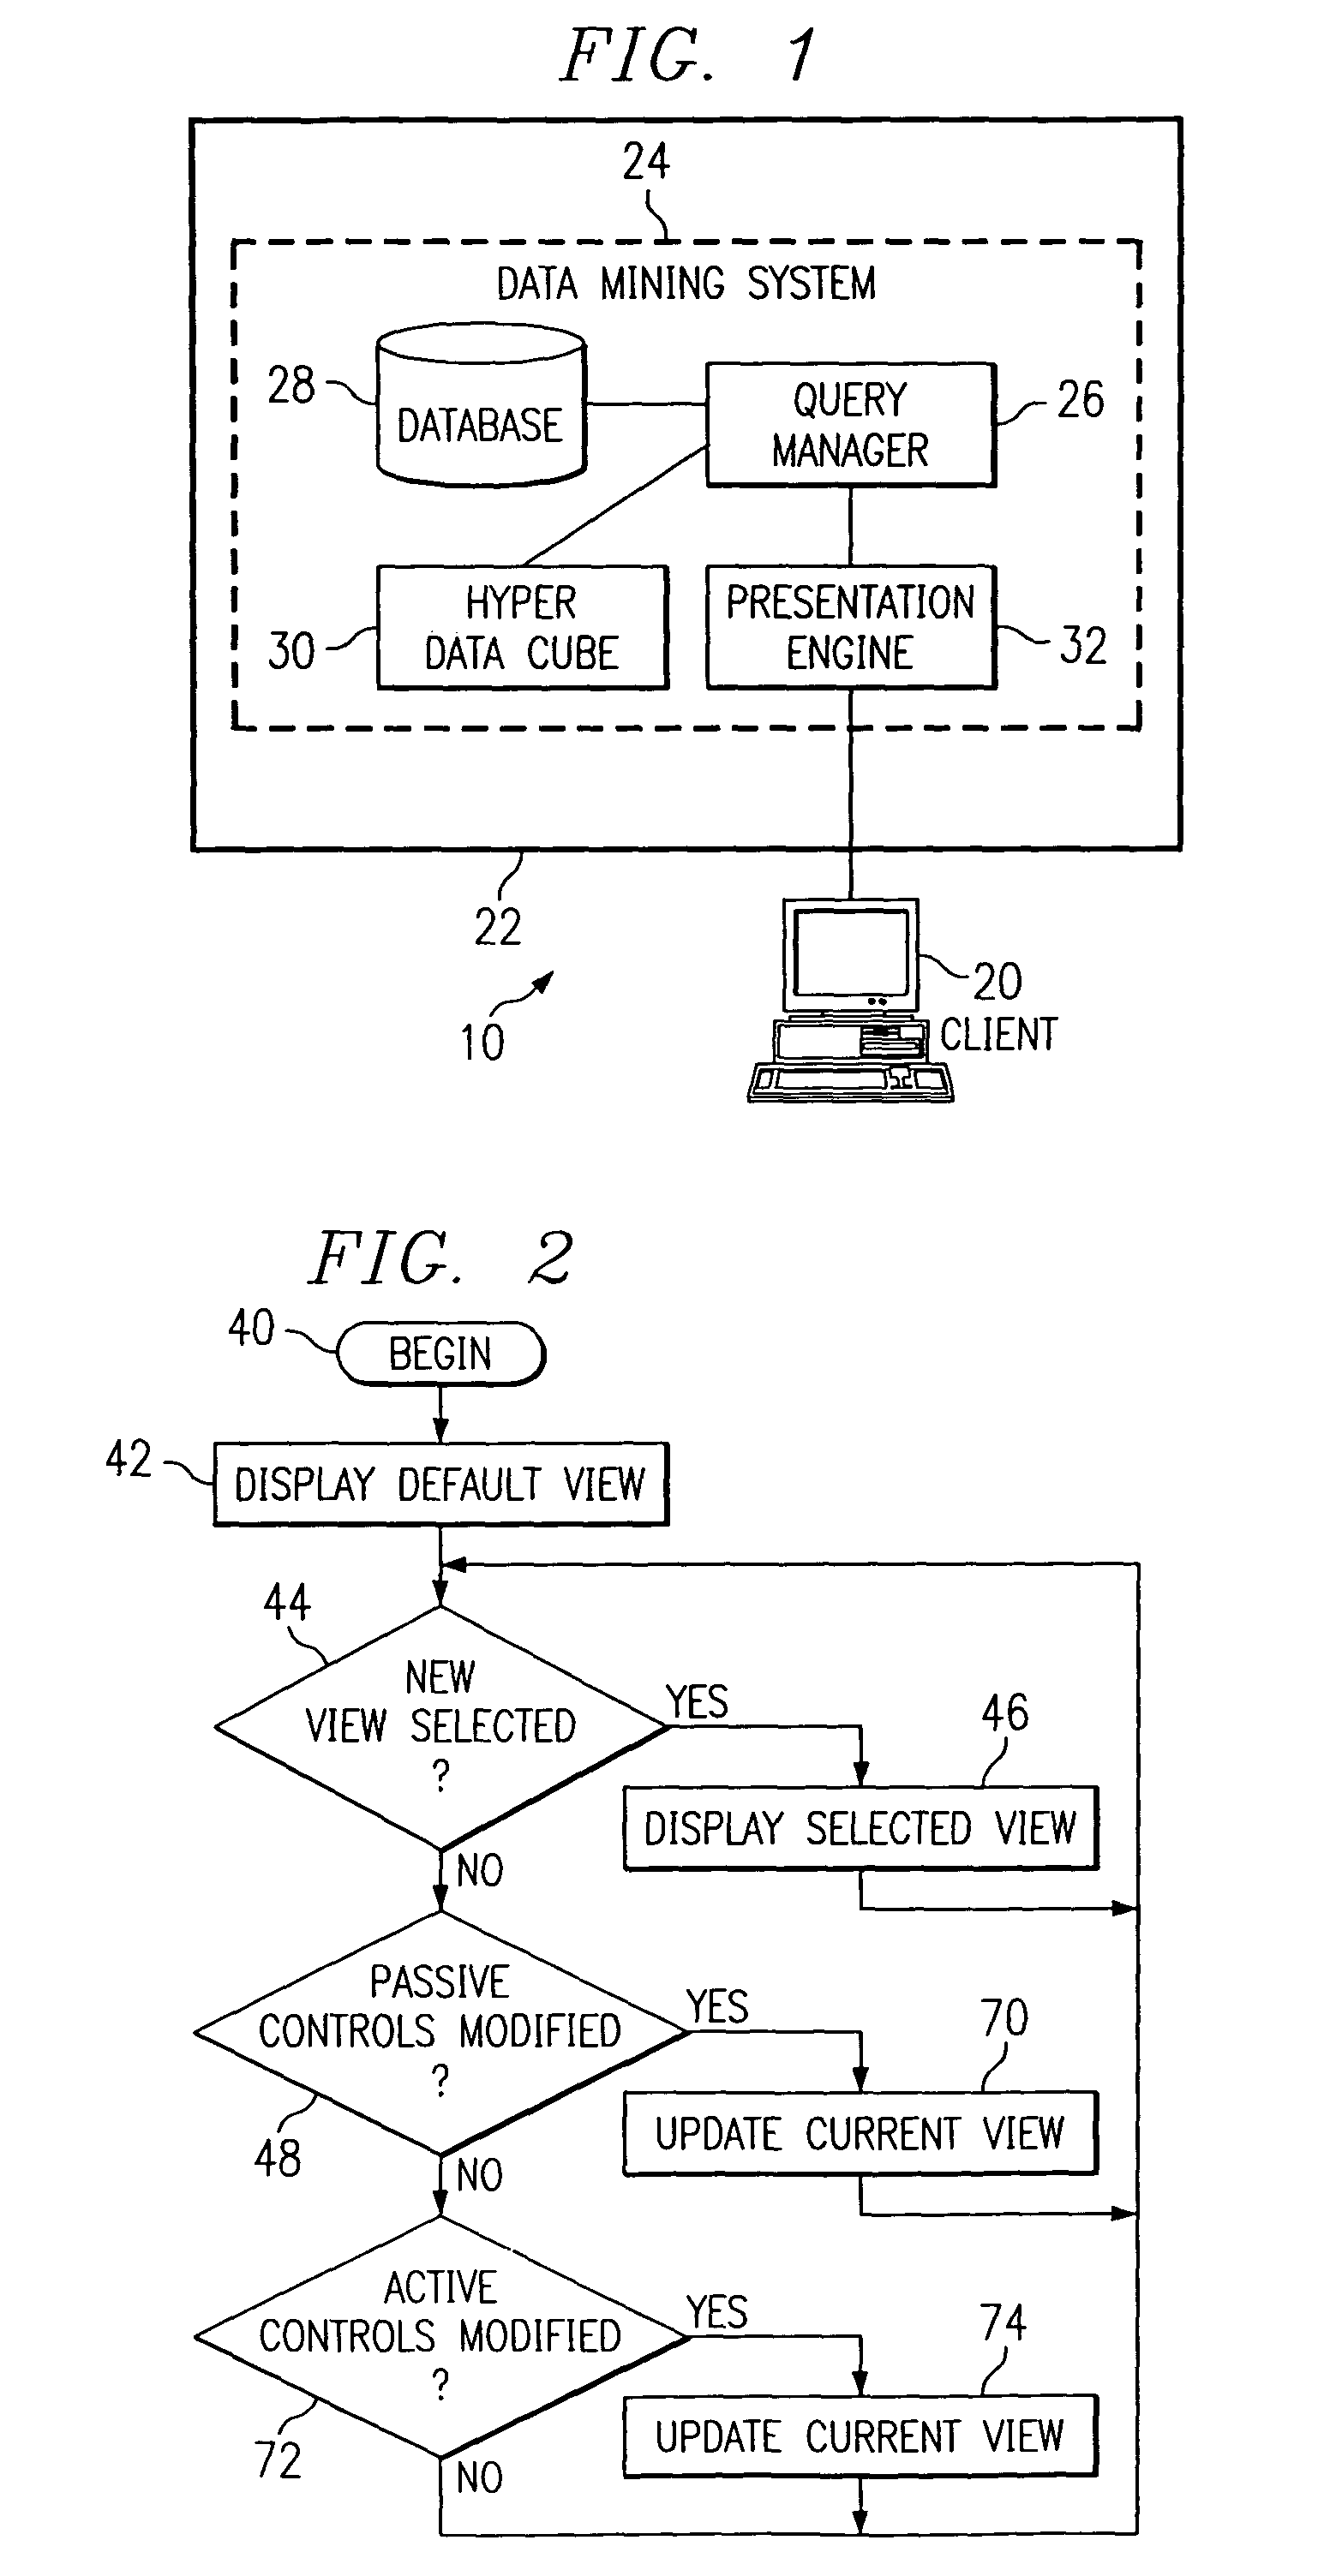
[0034]Referring now to FIG. 1, a collaborative data processing environment 10 provides facilities for presenting visualizations in a GUI. In the example embodiment, the GUI is displayed in a display device of a client data processing system 20, which communicates with a server data processing system 22 via a presentation engine 32. Specifically, in the example embodiment, presentation engine 32 is part of a data mining system 24, such as that described in the 0110 Application, and presentation engine 32 uses a query manager 26 to generate the visualizations based on data / statistics obtained from a database 28 and / or a hyper data cube 30. Presentation engine 32 transmits views that include those visualizations to client 20 for display. Client 20 uses a Web browser to display those views. In response to user interaction with the views, the web browser returns user input to presentation engine 32.

[0035]Data mining system 24 may be implemented, for example, in the J...


PUM


Abstract

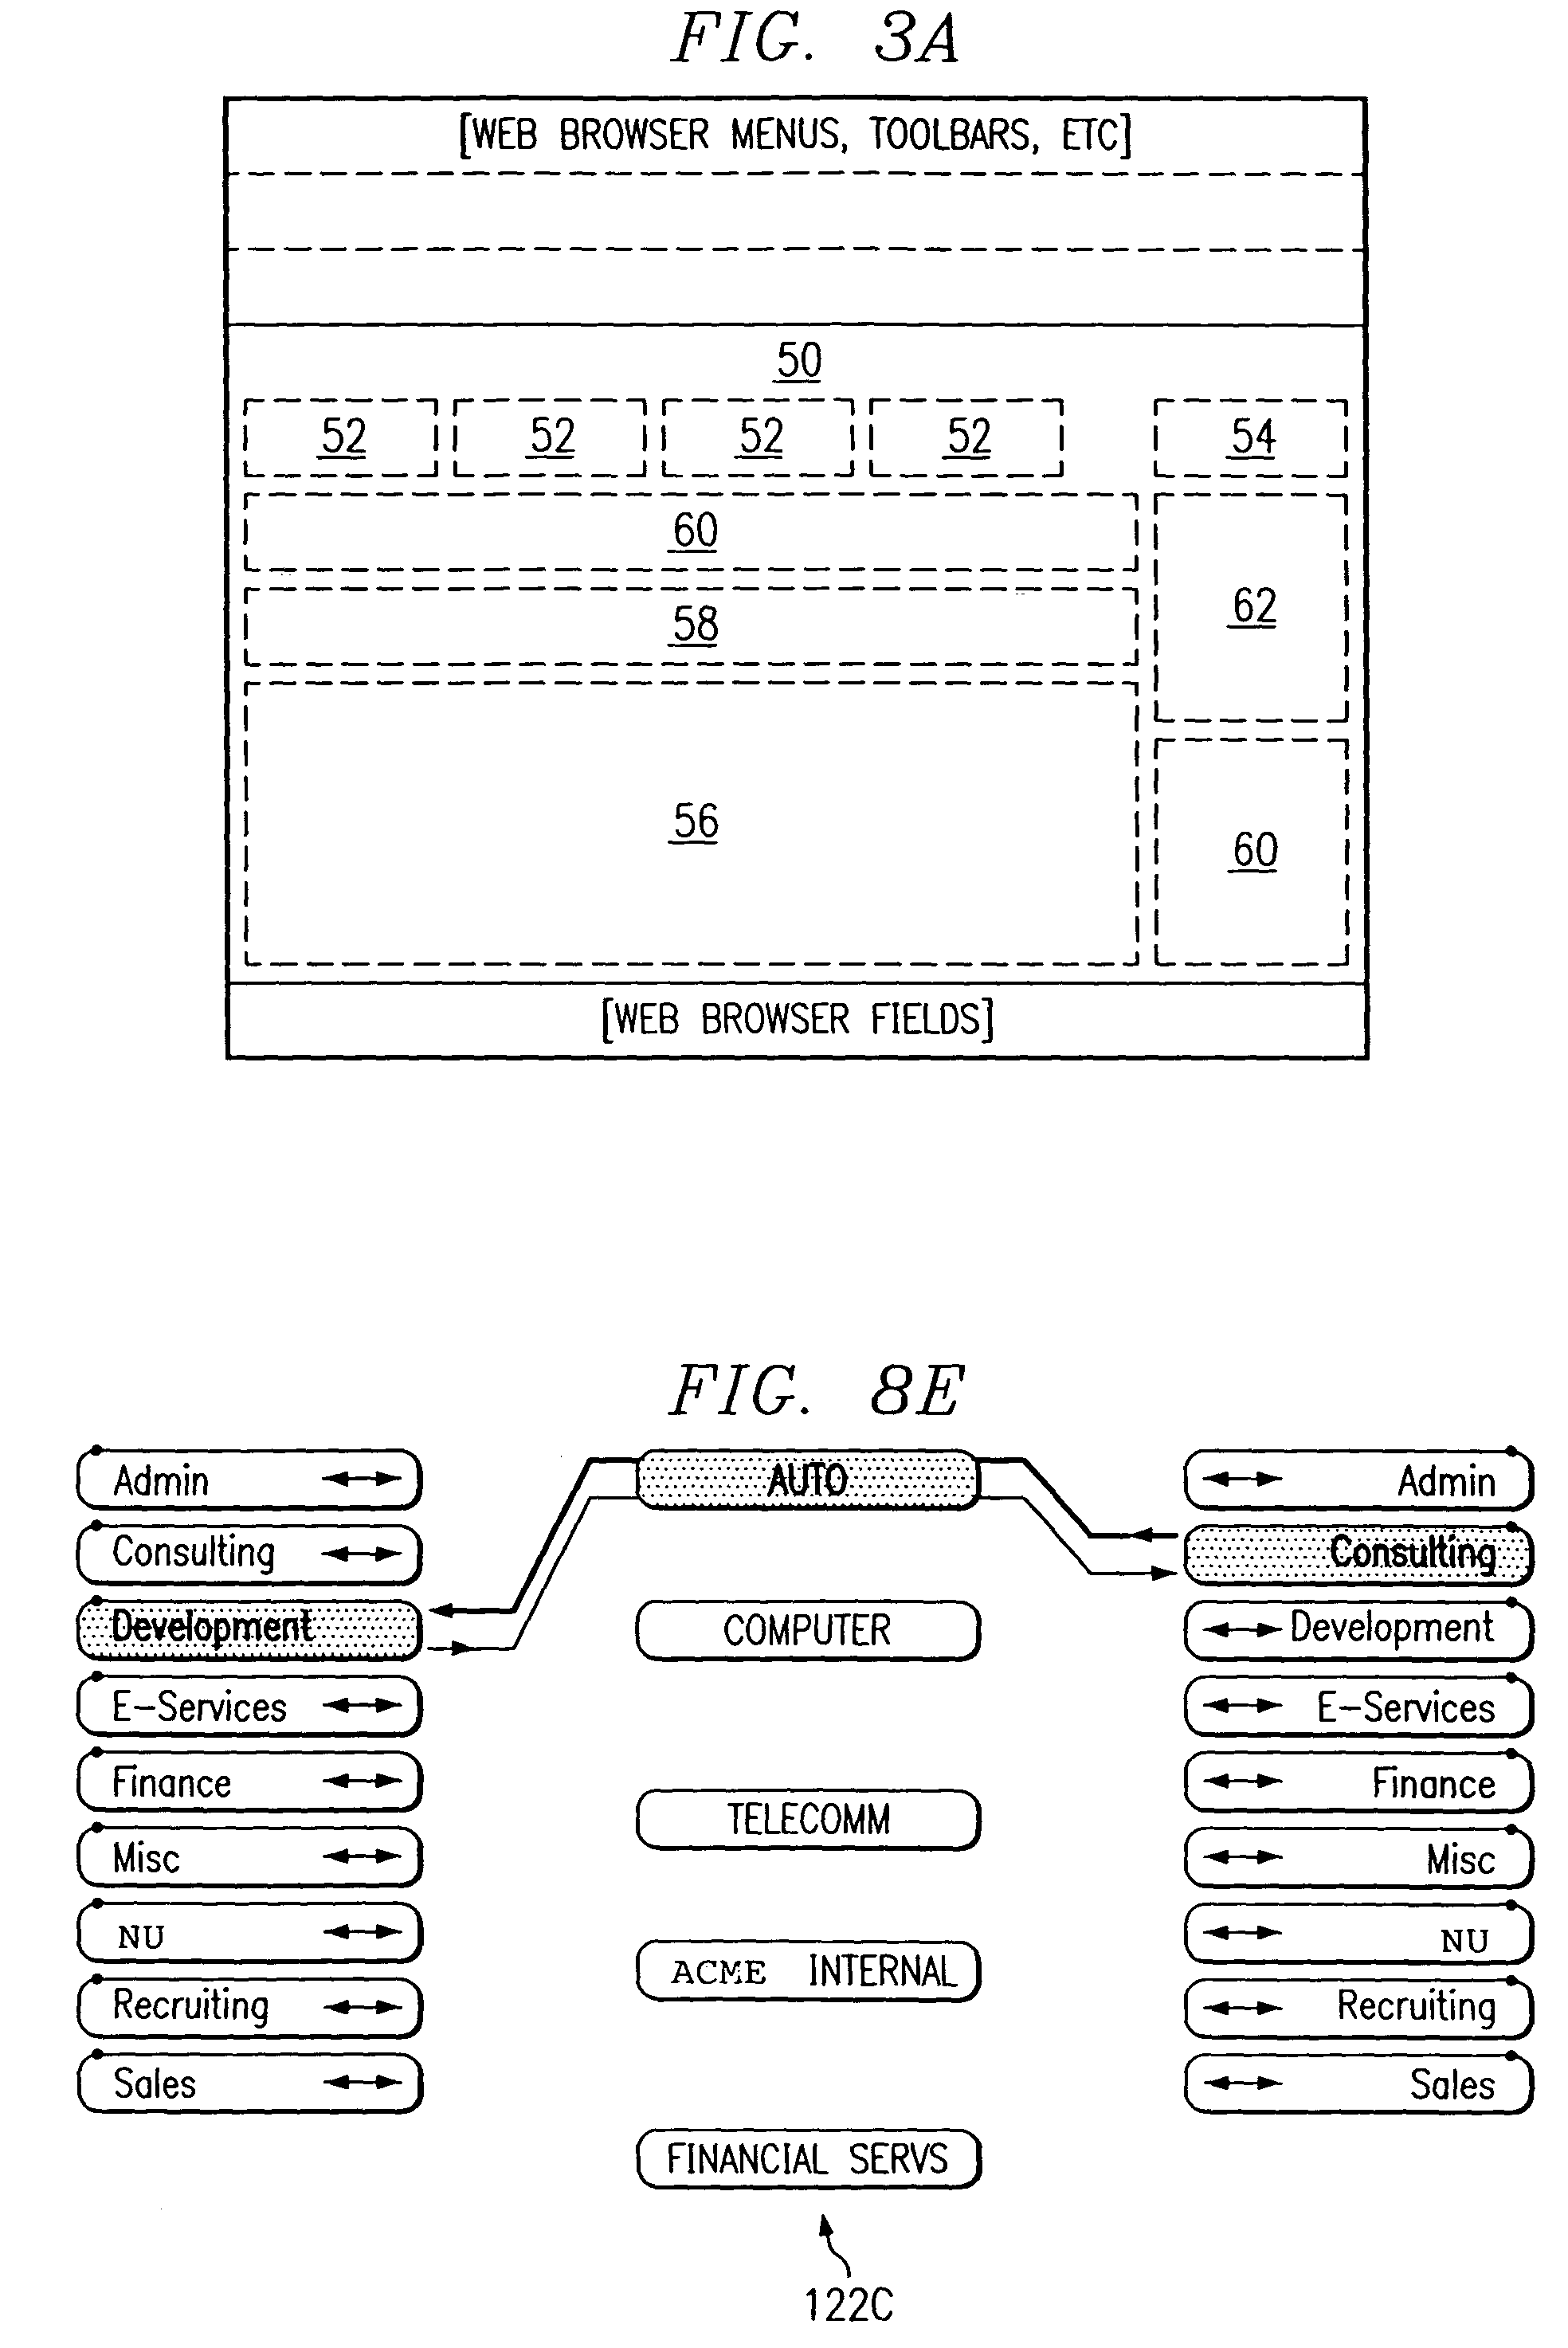
A plane figure presents statistics relating to data items. The plane figure includes multiple wedges which categorize a set of data items into base subsets of data items. A ring with a ring radius is displayed, and the ring radius represents a measure for at least one base subset. A corresponding wedge has a wedge radius which differs from the ring radius in proportion to a difference between the measure for that base subset and a measure for a subsidiary subset of that base subset. For example, the subsidiary subset may relate to data items for a predetermined timeframe. Boundaries, such as dividing lines, may be displayed within one or more wedges to define areas that represent additional subsets of data items. In another embodiment, a presentation space include first, second, and third groups of objects, with lines displayed between certain objects to represent flows of information between those objects.

Description

CROSS-REFERENCE TO RELATED APPLICATION[0001]This application is related to U.S. patent application Ser. No. 09 / 968,766, entitled SYSTEM AND METHOD FOR EXTRACTING KNOWLEDGE FROM DOCUMENTS, filed on Oct. 1, 2001, and naming as inventors Michael Kim et al. (hereinafter “the 0110 Application”). The 0110 Application is incorporated herein by reference in its entirety.TECHNICAL FIELD OF THE INVENTION[0002]This invention relates in general to the field of data processing, and in particular to a system and method for presenting statistics.BACKGROUND OF THE INVENTION[0003]An enormous amount of information now resides in data processing systems around the world. A single large business organization, for example, typically retains millions of documents in various computer systems. In recent years, data mining systems have been developed to help extract kernels of knowledge from large collections of data. Many of those data mining systems provide important advantages in the field of data analys...

Claims


Application Information

Patent Timeline
Patent Type & Authority Patents(United States)
IPC IPC(8): G06T11/20
CPCG06T11/20
Inventor PETRO, JUSTIN B.SWENSON, SAHALASHAH, AMAN H.
Owner VERSATA DEV GROUP
Learn More