Sequential fixed-point quantile estimation

a quantile estimation and fixed-point technology, applied in the field of statistic analysis of data, can solve the problems of insufficient post-processing and inability to achieve real-time control, and the approach may not always be viabl

Inactive Publication Date: 2011-08-16
AT&T INTPROP I LP
View PDF8 Cites 4 Cited by
  • Summary
  • Abstract
  • Description
  • Claims
  • Application Information

AI Technical Summary

Problems solved by technology

With large data streams, such as those generated in telecommunications networks, this approach may not always be viable because of the large amount of data storage and memory required.
In addition, post-processing may be insufficient for real-time control.

Method used


Image

  • Sequential fixed-point quantile estimation
  • Sequential fixed-point quantile estimation
  • Sequential fixed-point quantile estimation

Examples


Embodiment Construction

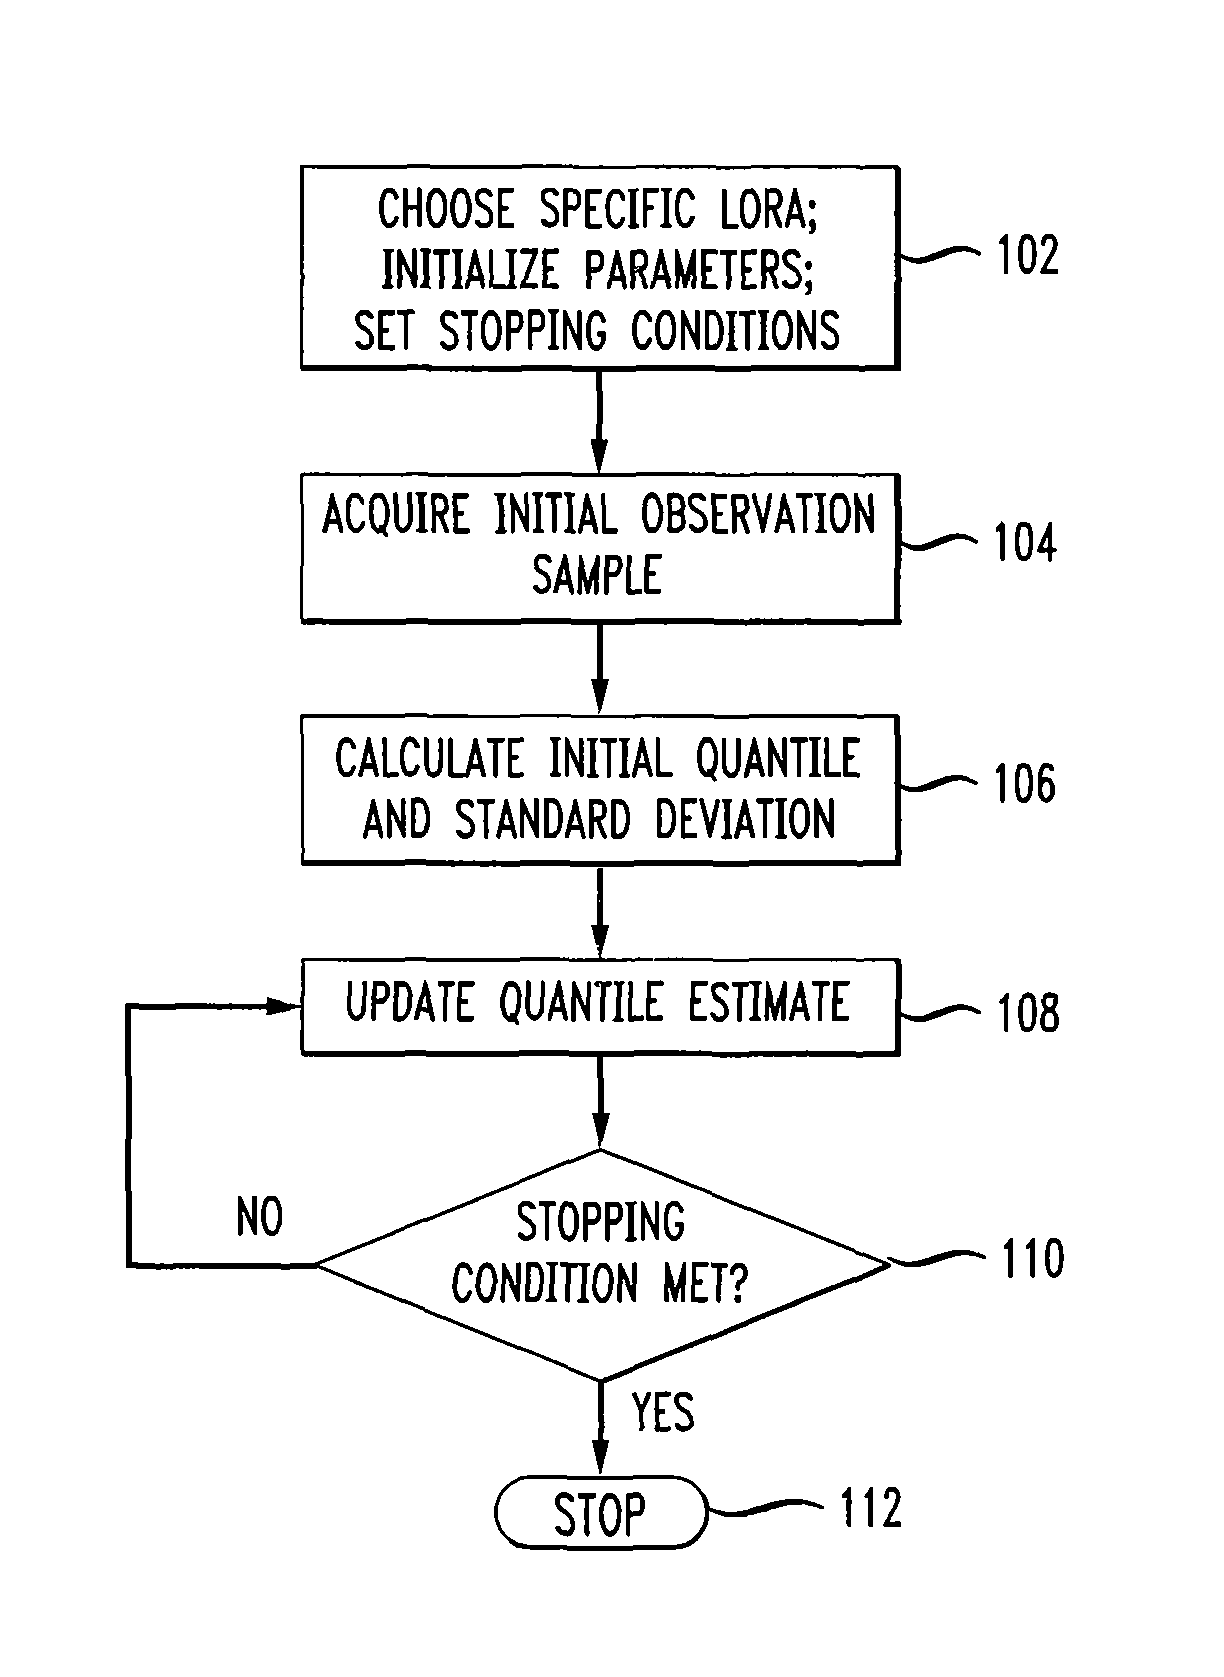
[0009]Characterization of statistical data may be provided by summary values such as mean, median, maximum, and minimum. Finer-grained characterization may be provided by quantiles, commonly reported as percentiles. In telecommunications networks, for example, high percentile values are often used for traffic analysis, such as the 95th percentile for call durations or the 99th percentile for traffic load. In an embodiment, to reduce required computational resources (such as memory, storage space, and processor speed), and to reduce computational time, quantiles are estimated for stationary statistical distributions and estimated and tracked for dynamic statistical distributions. Herein, stationary (also referred to as steady-state) statistical distributions refer to statistical distributions that do not vary over time, and dynamic statistical distributions refer to statistical distributions that do vary over time.

[0010]Herein, a data stream refers to a time series of measured values...


PUM


Abstract

Disclosed are method and apparatus for calculating a quantile estimate of a data stream. A quantile estimate is calculated iteratively by calculating a first quantile estimate and then calculating a second quantile estimate by adding a first update increment to the first estimate. A first observation sample is acquired. A first quantile estimate and a first standard deviation estimate are set to the sample quantile and the sample standard deviation of the first observation sample. A second observation sample is then acquired. A second standard deviation estimate is calculated based at least in part on the first standard deviation estimate and the sample standard deviation of the second observation sample. A first update increment is calculated based at least in part on the second observation sample and based at least in part on the product of the second standard deviation estimate times a log odds ratio function.

Description

[0001]This application claims the benefit of U.S. Provisional Application No. 61 / 004,487 filed Nov. 28, 2007, which is incorporated herein by reference.BACKGROUND OF THE INVENTION[0002]The present invention relates generally to statistical analysis of data, and more particularly to quantile estimation.[0003]Statistical analysis of data is a core process for characterizing, analyzing, and controlling systems. In some applications, data may be captured, statically stored in a database, and post-processed. In other applications, however, real-time (or near real-time) analysis of data streams may be required. In a manufacturing process, for example, sensors may monitor process variables (such as temperature, pressure, speed, and chemical concentration) and transmit the values to a control system. The control system may then analyze the data and transmit feedback signals to servo systems to maintain the desired values of the process variables. As another example, operations, administrati...

Claims


Application Information

Patent Timeline
Patent Type & Authority Patents(United States)
IPC IPC(8): G06F17/18
CPCG06F17/18
Inventor BAKSHI, YURYHOEFLIN, DAVID ARTHUR
Owner AT&T INTPROP I LP
Why Eureka
Try Eureka