Method for analyzing function of the brain and other complex systems

a brain and complex system technology, applied in the field of detection of signal changes in complex systems, can solve the problems of affecting the clinical and research progress of patients,

Active Publication Date: 2013-09-10
HEALTH RES INC +1
View PDF6 Cites 20 Cited by
  • Summary
  • Abstract
  • Description
  • Claims
  • Application Information

AI Technical Summary

Benefits of technology

[0017]Briefly, therefore, methods and systems consistent with the present invention are directed to detecting changes in complex signals by establishing a comprehensive baseline and subsequently searching for statistical deviations from this baseline. This approach can be used with virtually any complex signal to detect a change in state. By creating and using a statistical model for the likelihood of the fluctuation for each feature evaluated for a given baseline condition, even subtle changes can be detected. The techniques described herein can eliminate or minimize the need for extensive data collection and retrospective analysis. These techniques allow one to create a model for event prediction without a priori assumptions or the benefit of extensive retrospective analyses.

Problems solved by technology

This is because the brain signal change that is associated with a specific function or event is either unknown a priori or does not sufficiently generalize to a different individual to permit prospective (i.e., real-time) extraction of that signal with the requisite fidelity.
These serious limitations have prohibited prospective study of many important problems.
The requirement for extensive data collection under defined conditions and subsequent detailed analyses makes it difficult or impossible to use EM methods for a wide variety of important clinical and research purposes.
In contrast, other clinical and experimental uses of EM activity typically require laborious collection of often extensive EM data under defined conditions from each individual, and subsequent elaborate analysis of these data to determine for that individual the relationships between specific aspects of brain function and specific features of EM activity.
ECS is coarse in its ability to delineate regions of motor and speech cortex and carries risks of inducing seizures or misidentifying critical areas.
However, these functional changes often manifest themselves in signal features that differ markedly from individual to individual, which prohibits the real-time detection of these changes by current methods.
As described above, the requirement for extensive data collection under defined conditions and subsequent detailed analyses makes it difficult or impossible to use EM methods for a wide variety of important clinical and research purposes.

Method used


Image

  • Method for analyzing function of the brain and other complex systems
  • Method for analyzing function of the brain and other complex systems
  • Method for analyzing function of the brain and other complex systems

Examples


example 1

Signal Modeling for Real-Time Identification and Event Detection in Epilepsy Patients

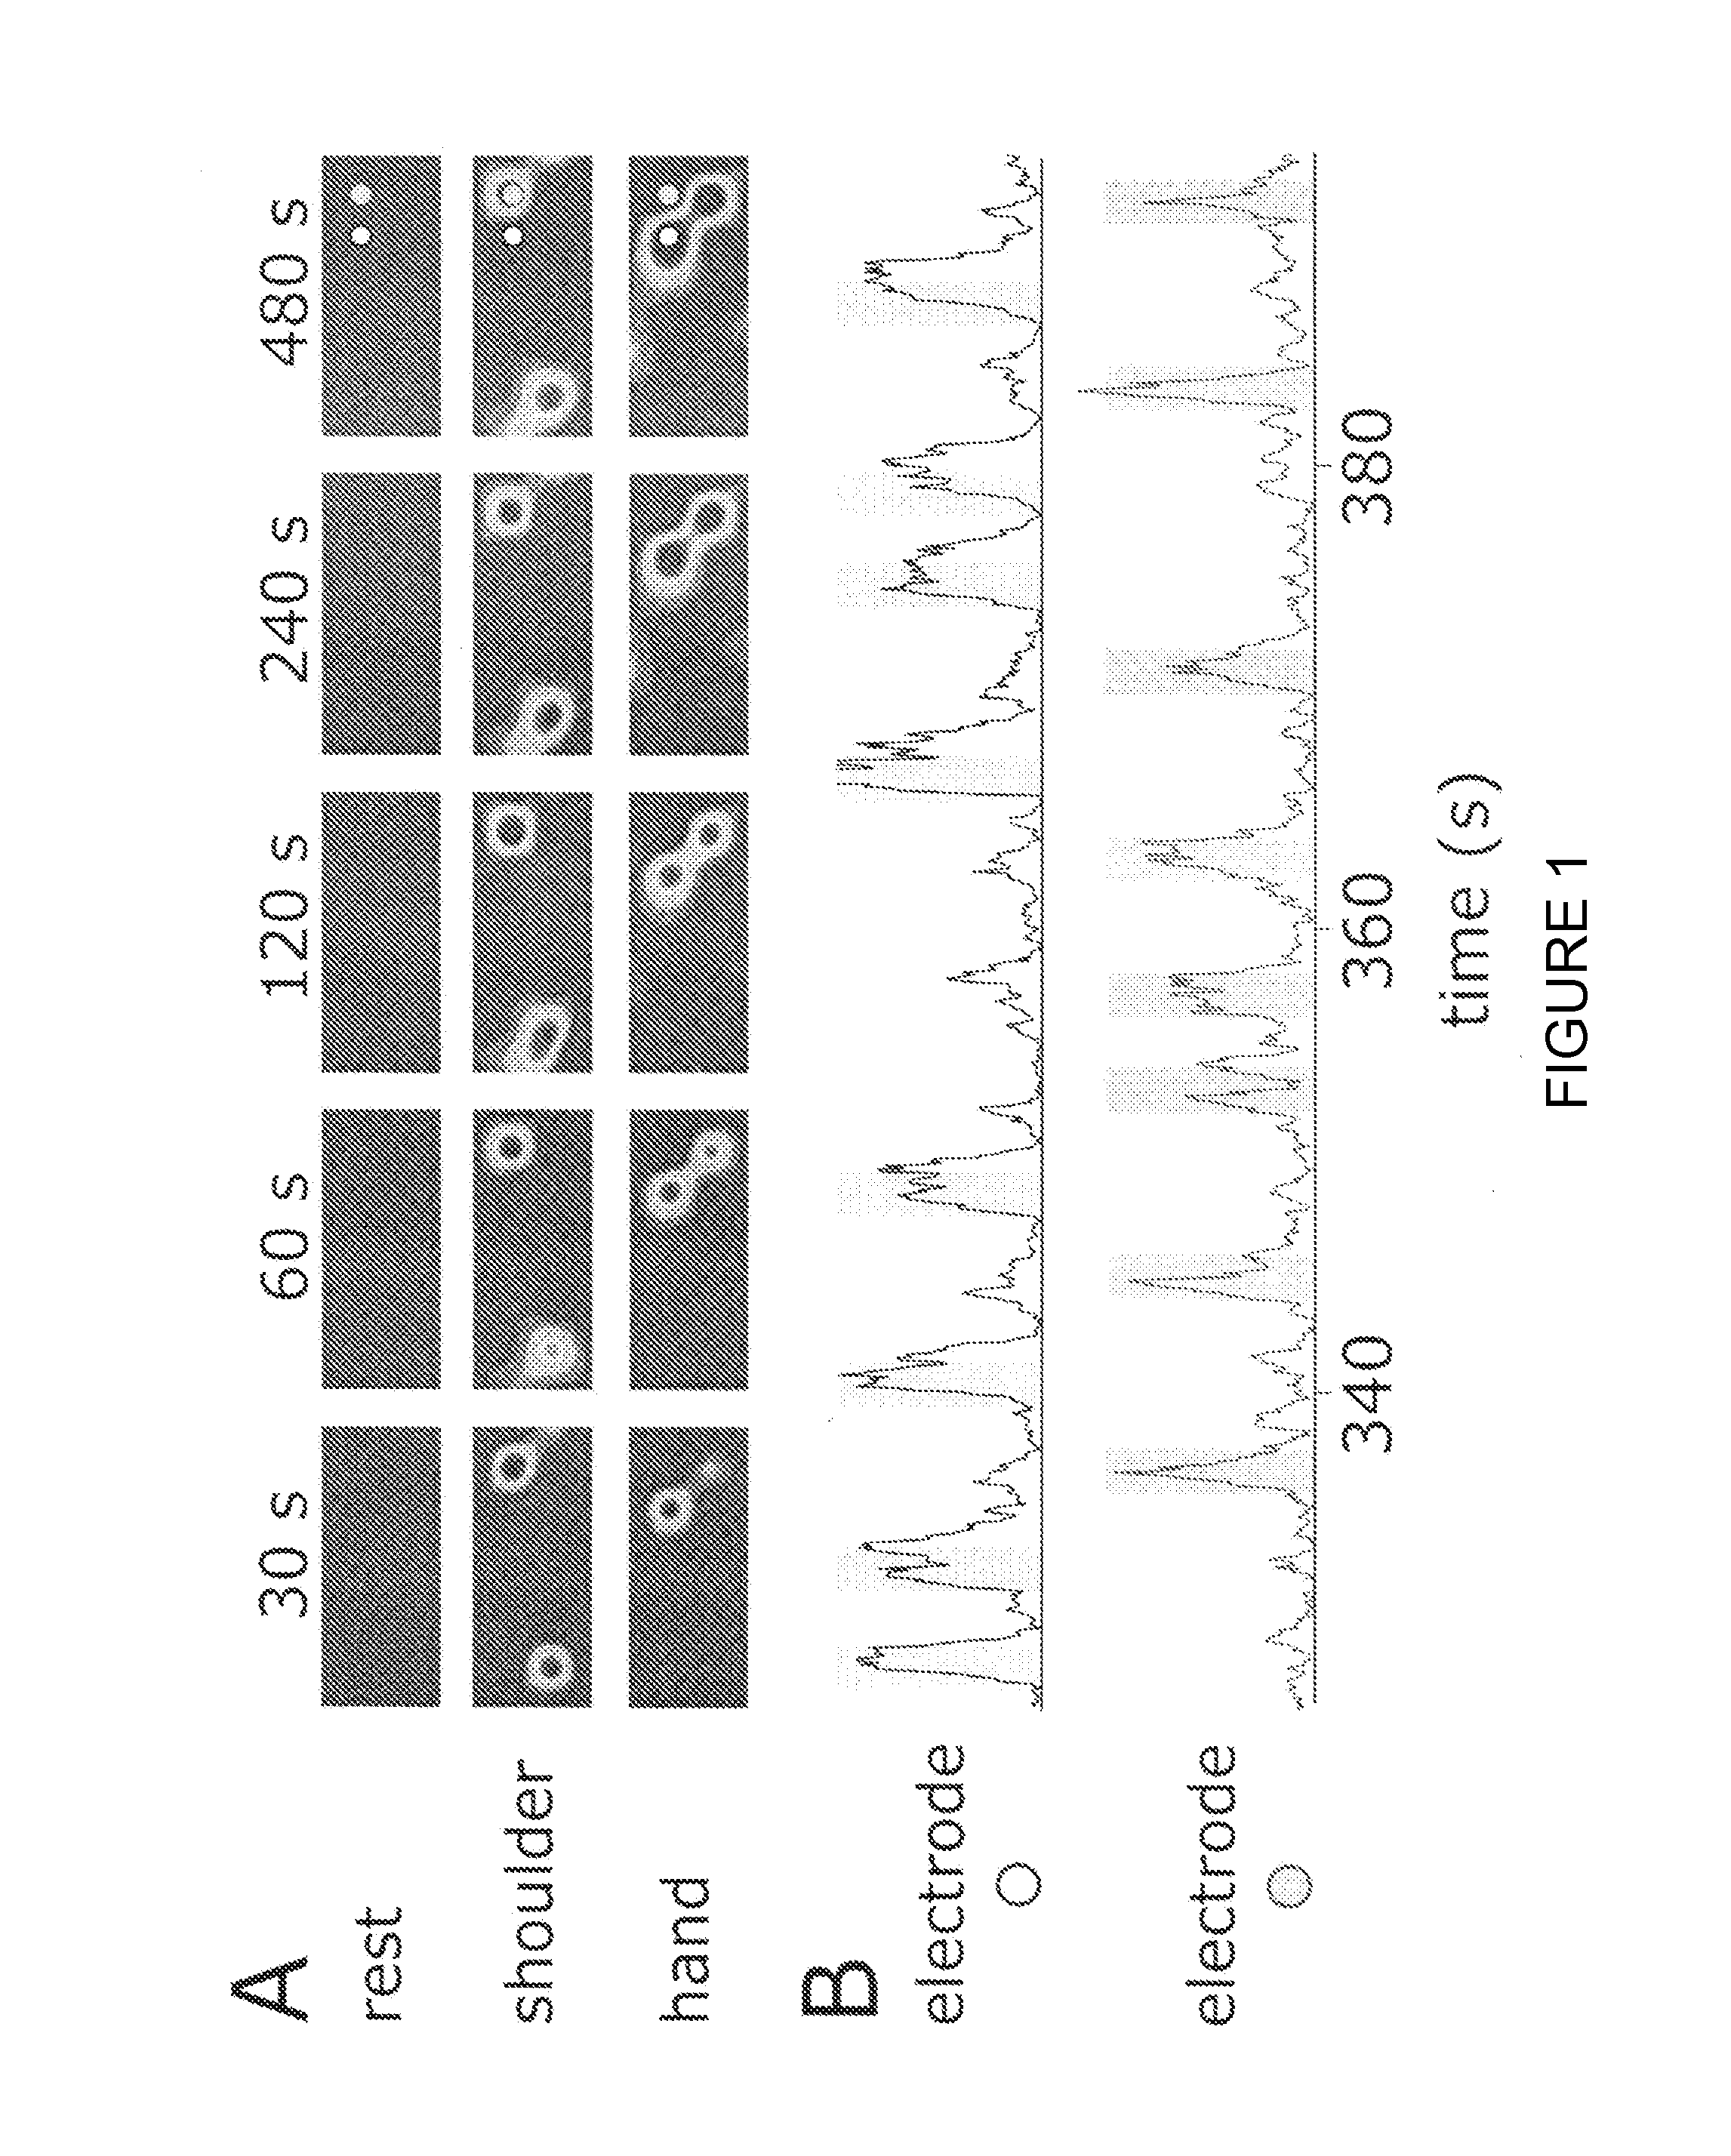
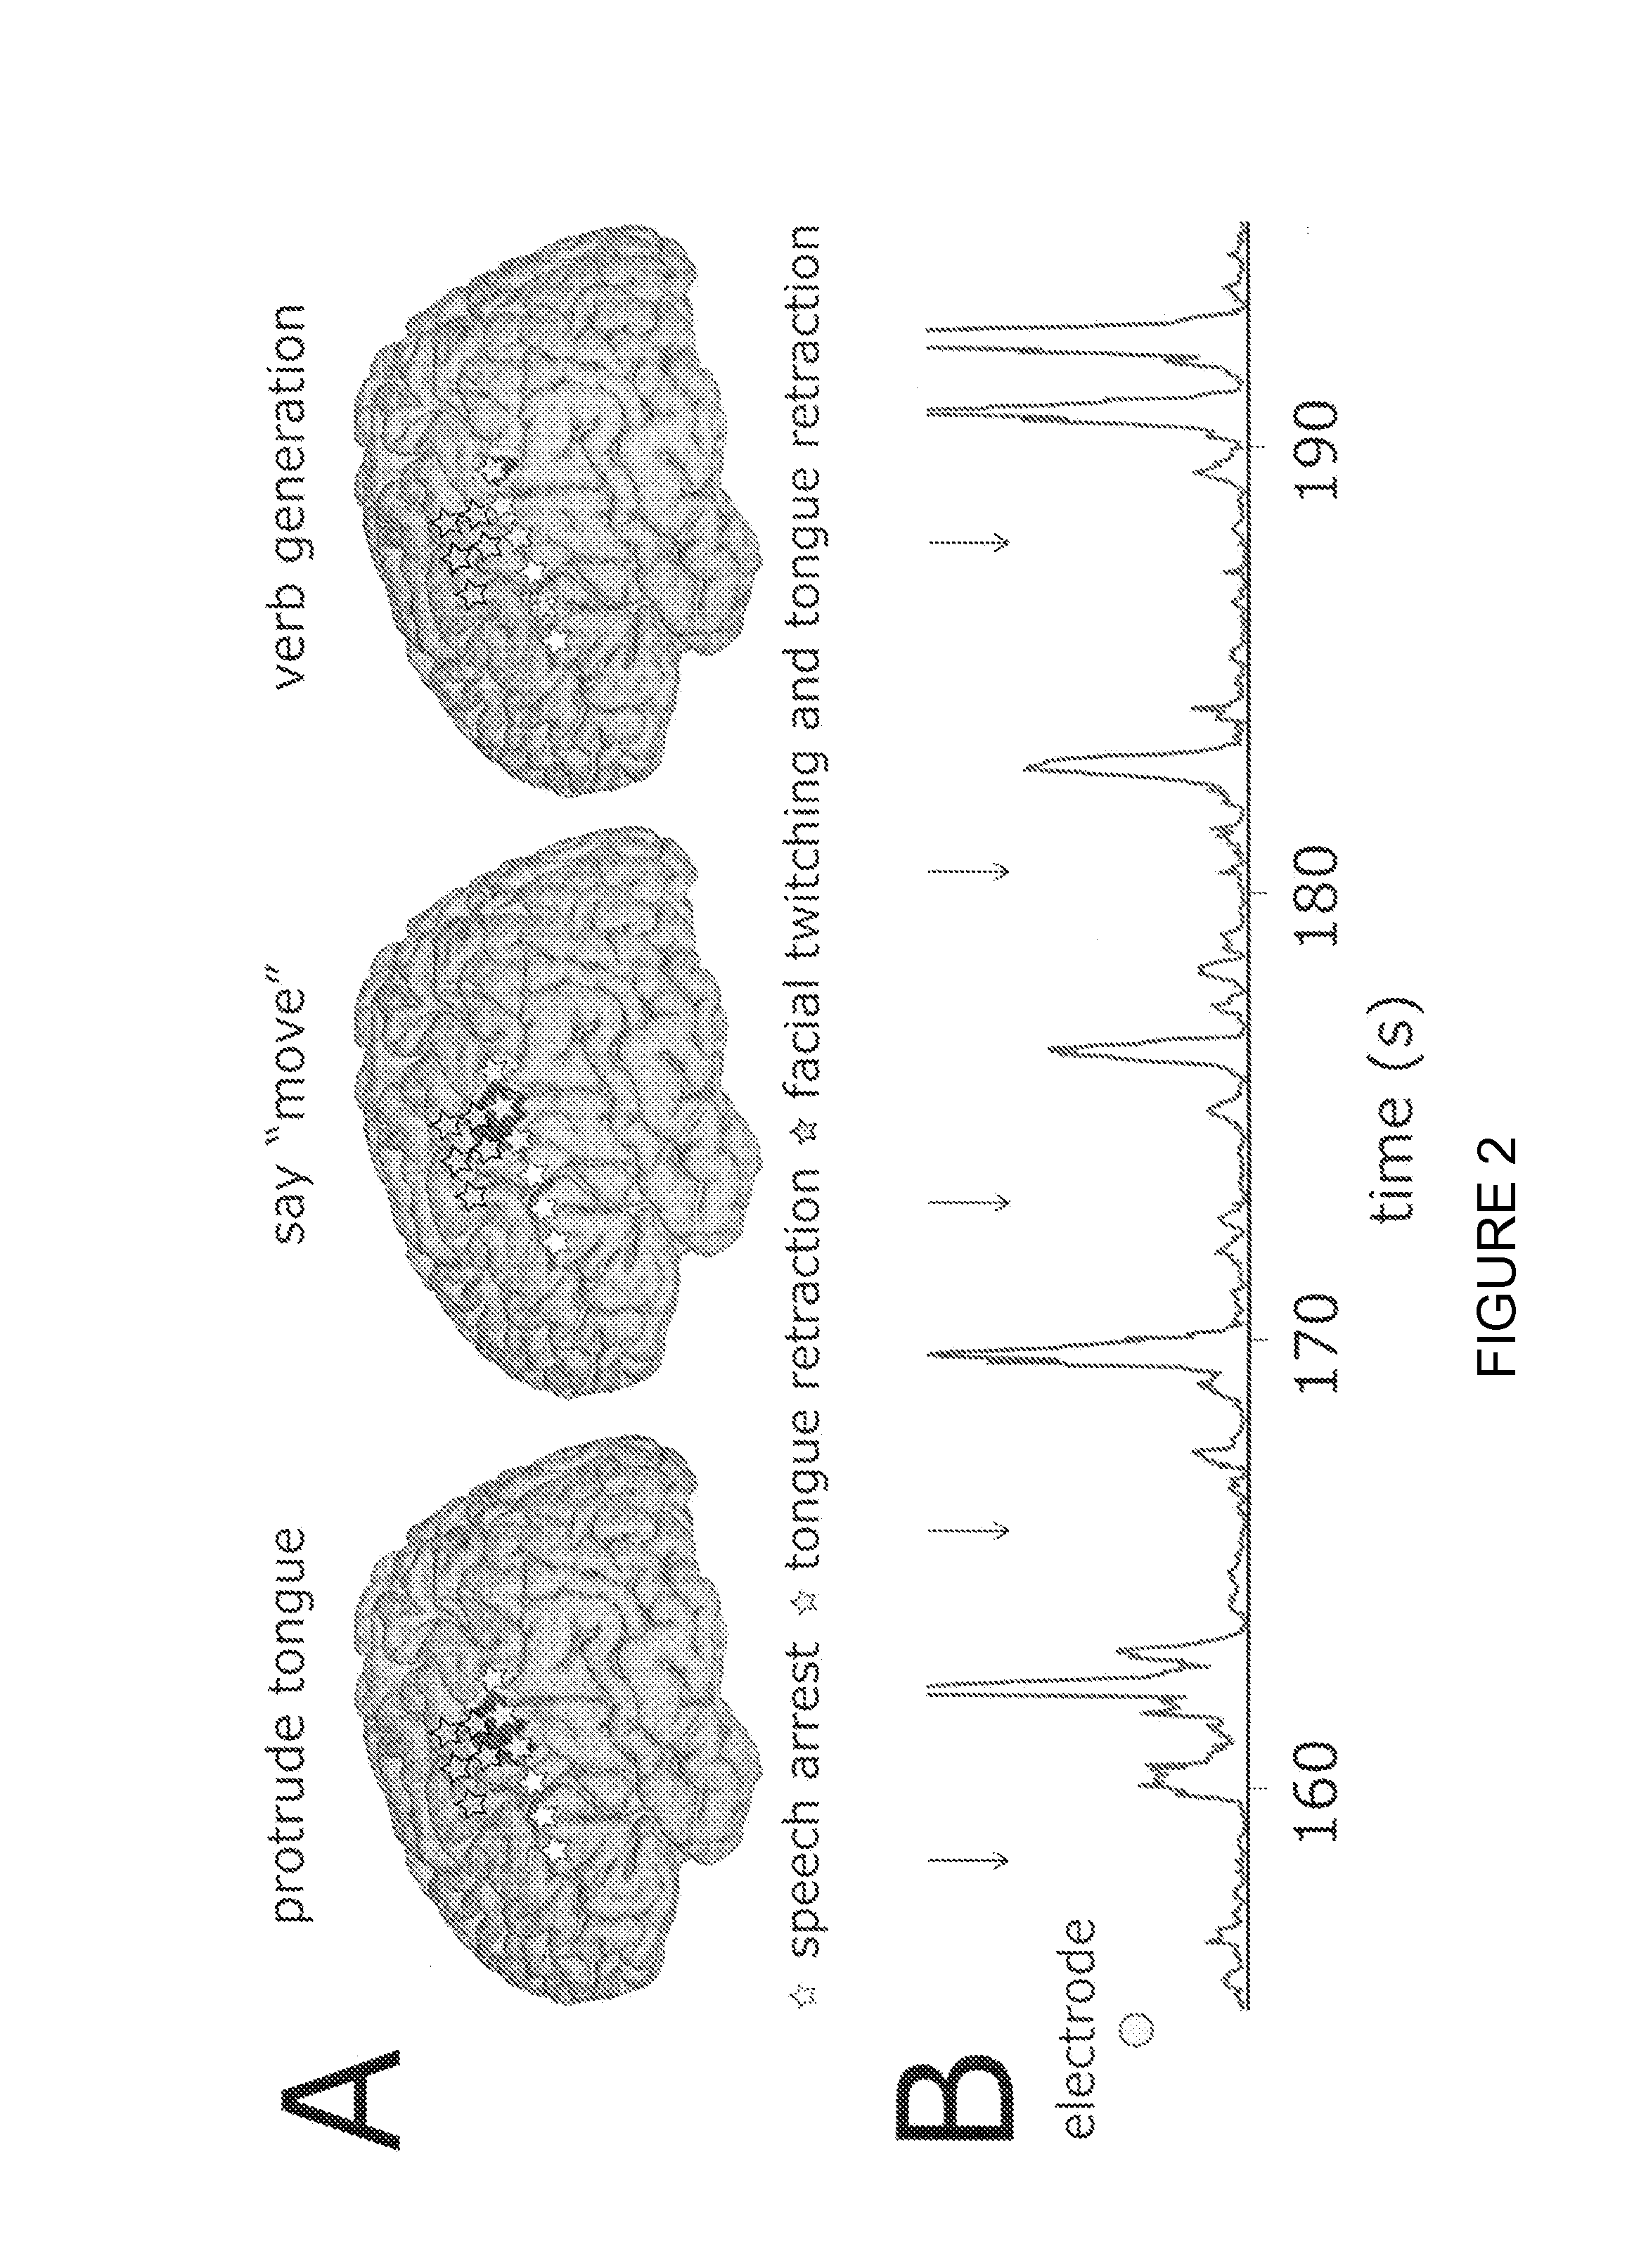
[0062]Electrocorticography (ECoG) activity was recorded in several patients with intractable epilepsy. ECoG is a technique of recording the electrical activity of the cerebral cortex by means of electrodes placed directly on it, either under the dura mater (subdural) or over the dura mater (epidural) but beneath the skull. Collection of ECoG signal activity can be conducted in accordance with the methods of US App. Pub. No. 2005-0131311, incorporated herein by reference. First, ECoG signals were recorded from 32 channels while the subject rested. Subsequently, signals were recorded from the same channels while the subject rested or moved her shoulder or hand in response to visual cues. Also, signals were recorded from the same channels while the patient protruded the tongue and said the word “move” in response to visual cues. In addition, signals were recorded from the same channels while the patien...

example 2

Signal Modeling for Real-Time Identification and Event Detection in Normal Patients Performing Tasks

[0075]In several normal individuals, EEG activity was recorded from 64 scalp locations of subjects during rest. Patients were then asked to perform a number of motor and / or motor imagery tasks and EEG activity was again recorded.

[0076]Data thus collected was processed by a methodology termed Signal Modeling for Real-Time Identification and Event Detection (SIGFRIED), as described in Example 1. SIGFRIED was trained on a 1-min baseline period that was recorded prior to the movement / imagery tasks. Relevant EEG frequencies (i.e., 10-30 Hz in 2-Hz bins) were used in the calculations.

[0077]Results showed that EEG activity at distinct and reproducible locations on the scalp corresponded to specific actual or imagery tasks (see, e.g., FIG. 3). From FIG. 3, different locations that show changes with the different tasks are evident. For example, FIG. 3 depicts differences between actual movemen...

example 3

Seizure Prediction

[0079]Several subjects with intractable epilepsy were monitored using subdural electrodes over a broad range of frequencies (i.e., 5-90 Hz in 5-Hz bins). Data thus collected were processed by a methodology termed Signal Modeling for Real-Time Identification and Event Detection (SIGFRIED), as described in Example 1. SIGFRIED was previously trained on a different dataset using the same range of frequencies (i.e., 5-90 Hz in 5-Hz bins).

[0080]Results showed that seizures were readily detectable and, furthermore, predictable (see, e.g., FIG. 4). For example, from FIG. 4, seizures are detectable around times 3500 and 3000. In addition, several locations show abnormal activity prior to the seizure, thus providing the ability to predict the impending seizure. Because the detection threshold was the same and SIGFRIED was trained on a different dataset using the same broad range of frequencies (i.e., 5-90 Hz in 5-Hz bins), similar results can be expected in other subjects.


PUM


Abstract

A method and system are provided for analyzing electromagnetic brain signals such as EEG and ECoG signals in a subject in real time and which avoids the need for time-intensive retrospective analysis of brain activity in the subject. This can be applied to all complex systems with multiple fluctuating signals to identify and predict significant events.

Description

STATEMENT REGARDING FEDERALLY SPONSORED RESEARCH OR DEVELOPMENT[0001]This invention was made in part with Government support under National Institutes of Health Grants HD30146 and EB00856. The Government has certain rights in the invention.CROSS-REFERENCE TO RELATED APPLICATIONS[0002]The following identified patent applications are relied upon and incorporated by reference in this application:[0003]U.S. Provisional Patent Application No. 60 / 813,062, entitled “METHOD FOR ANALYZING FUNCTION OF THE BRAIN AND OTHER COMPLEX SYSTEMS”, filed on Jun. 13, 2006.[0004]International PCT Patent Application No. PCT / US2007 / 071110, entitled, “METHOD FOR ANALYZING FUNCTION OF THE BRAIN AND OTHER COMPLEX SYSTEMS”, filed on Jun. 13, 2007.INCORPORATION-BY-REFERENCE OF MATERIAL SUBMITTED ON A COMPACT DISC[0005]Not Applicable.FIELD OF THE INVENTION[0006]The present invention generally relates to detection of signal changes in complex systems.BACKGROUND[0007]Many fields, such as clinical neurology, neuros...

Claims


Application Information

Patent Timeline
Patent Type & Authority Patents(United States)
IPC IPC(8): A61B5/04G16H30/20
CPCA61B5/048A61B5/0496A61B5/4094G06F19/321A61B5/0476A61B5/055A61B5/16G16H30/20A61B5/374A61B5/398A61B5/369
Inventor SCHALK, GERWINLEUTHARDT, ERICWOLPAW, JONATHANBRUNNER, PETER
Owner HEALTH RES INC
Why Eureka
Try Eureka