Biomarkers for ovarian cancer
a biomarker and ovarian cancer technology, applied in the field of biomarkers, can solve the problems of poor prognosis of ovarian cancer diagnosed, cost and risk associated with confirmatory diagnostic procedures, and no cost effective screening tests have been developed, and achieve the effect of limiting the number of markers detected
- Summary
- Abstract
- Description
- Claims
- Application Information
AI Technical Summary
Problems solved by technology
Method used
Image

Examples
example 1
Protein Expression Profiling
[0244]Serum Fractionation: Serum samples were thawed on ice and then centrifuged at 20000 g for 10 minutes to remove precipitate. 20 μl of serum were mixed with 30 μl of a denaturing buffer (U9: 9 M urea, 2% CHAPS, 50 mM Tris pH 9.0) and vortexed for twenty minutes at 4 degrees. For each sample, 180 μl of Hyper Q DF anion exchange resin was equilibrated in 200 μl of U1 buffer (U9 that was diluted 1:9 in 50 mM Tris pH 9.0) three times. The denatured serum was applied to the resin and allowed to bind for thirty minutes. The unbound material was collected and then 100 μl of 50 mM Tris 9.0 containing 0.1% OGP was added to the resin. This wash was collected and combined with the unbound material (flow through; fraction 1). Fractions were then collected in a stepwise pH gradient using two times 100 ul each aliquots of wash buffers at pH 7, 5, 4, 3, and organic solvent). This led to the collection of a total of six fractions. Fractionation was performed on a Bio...
example 2
Statistical Analysis
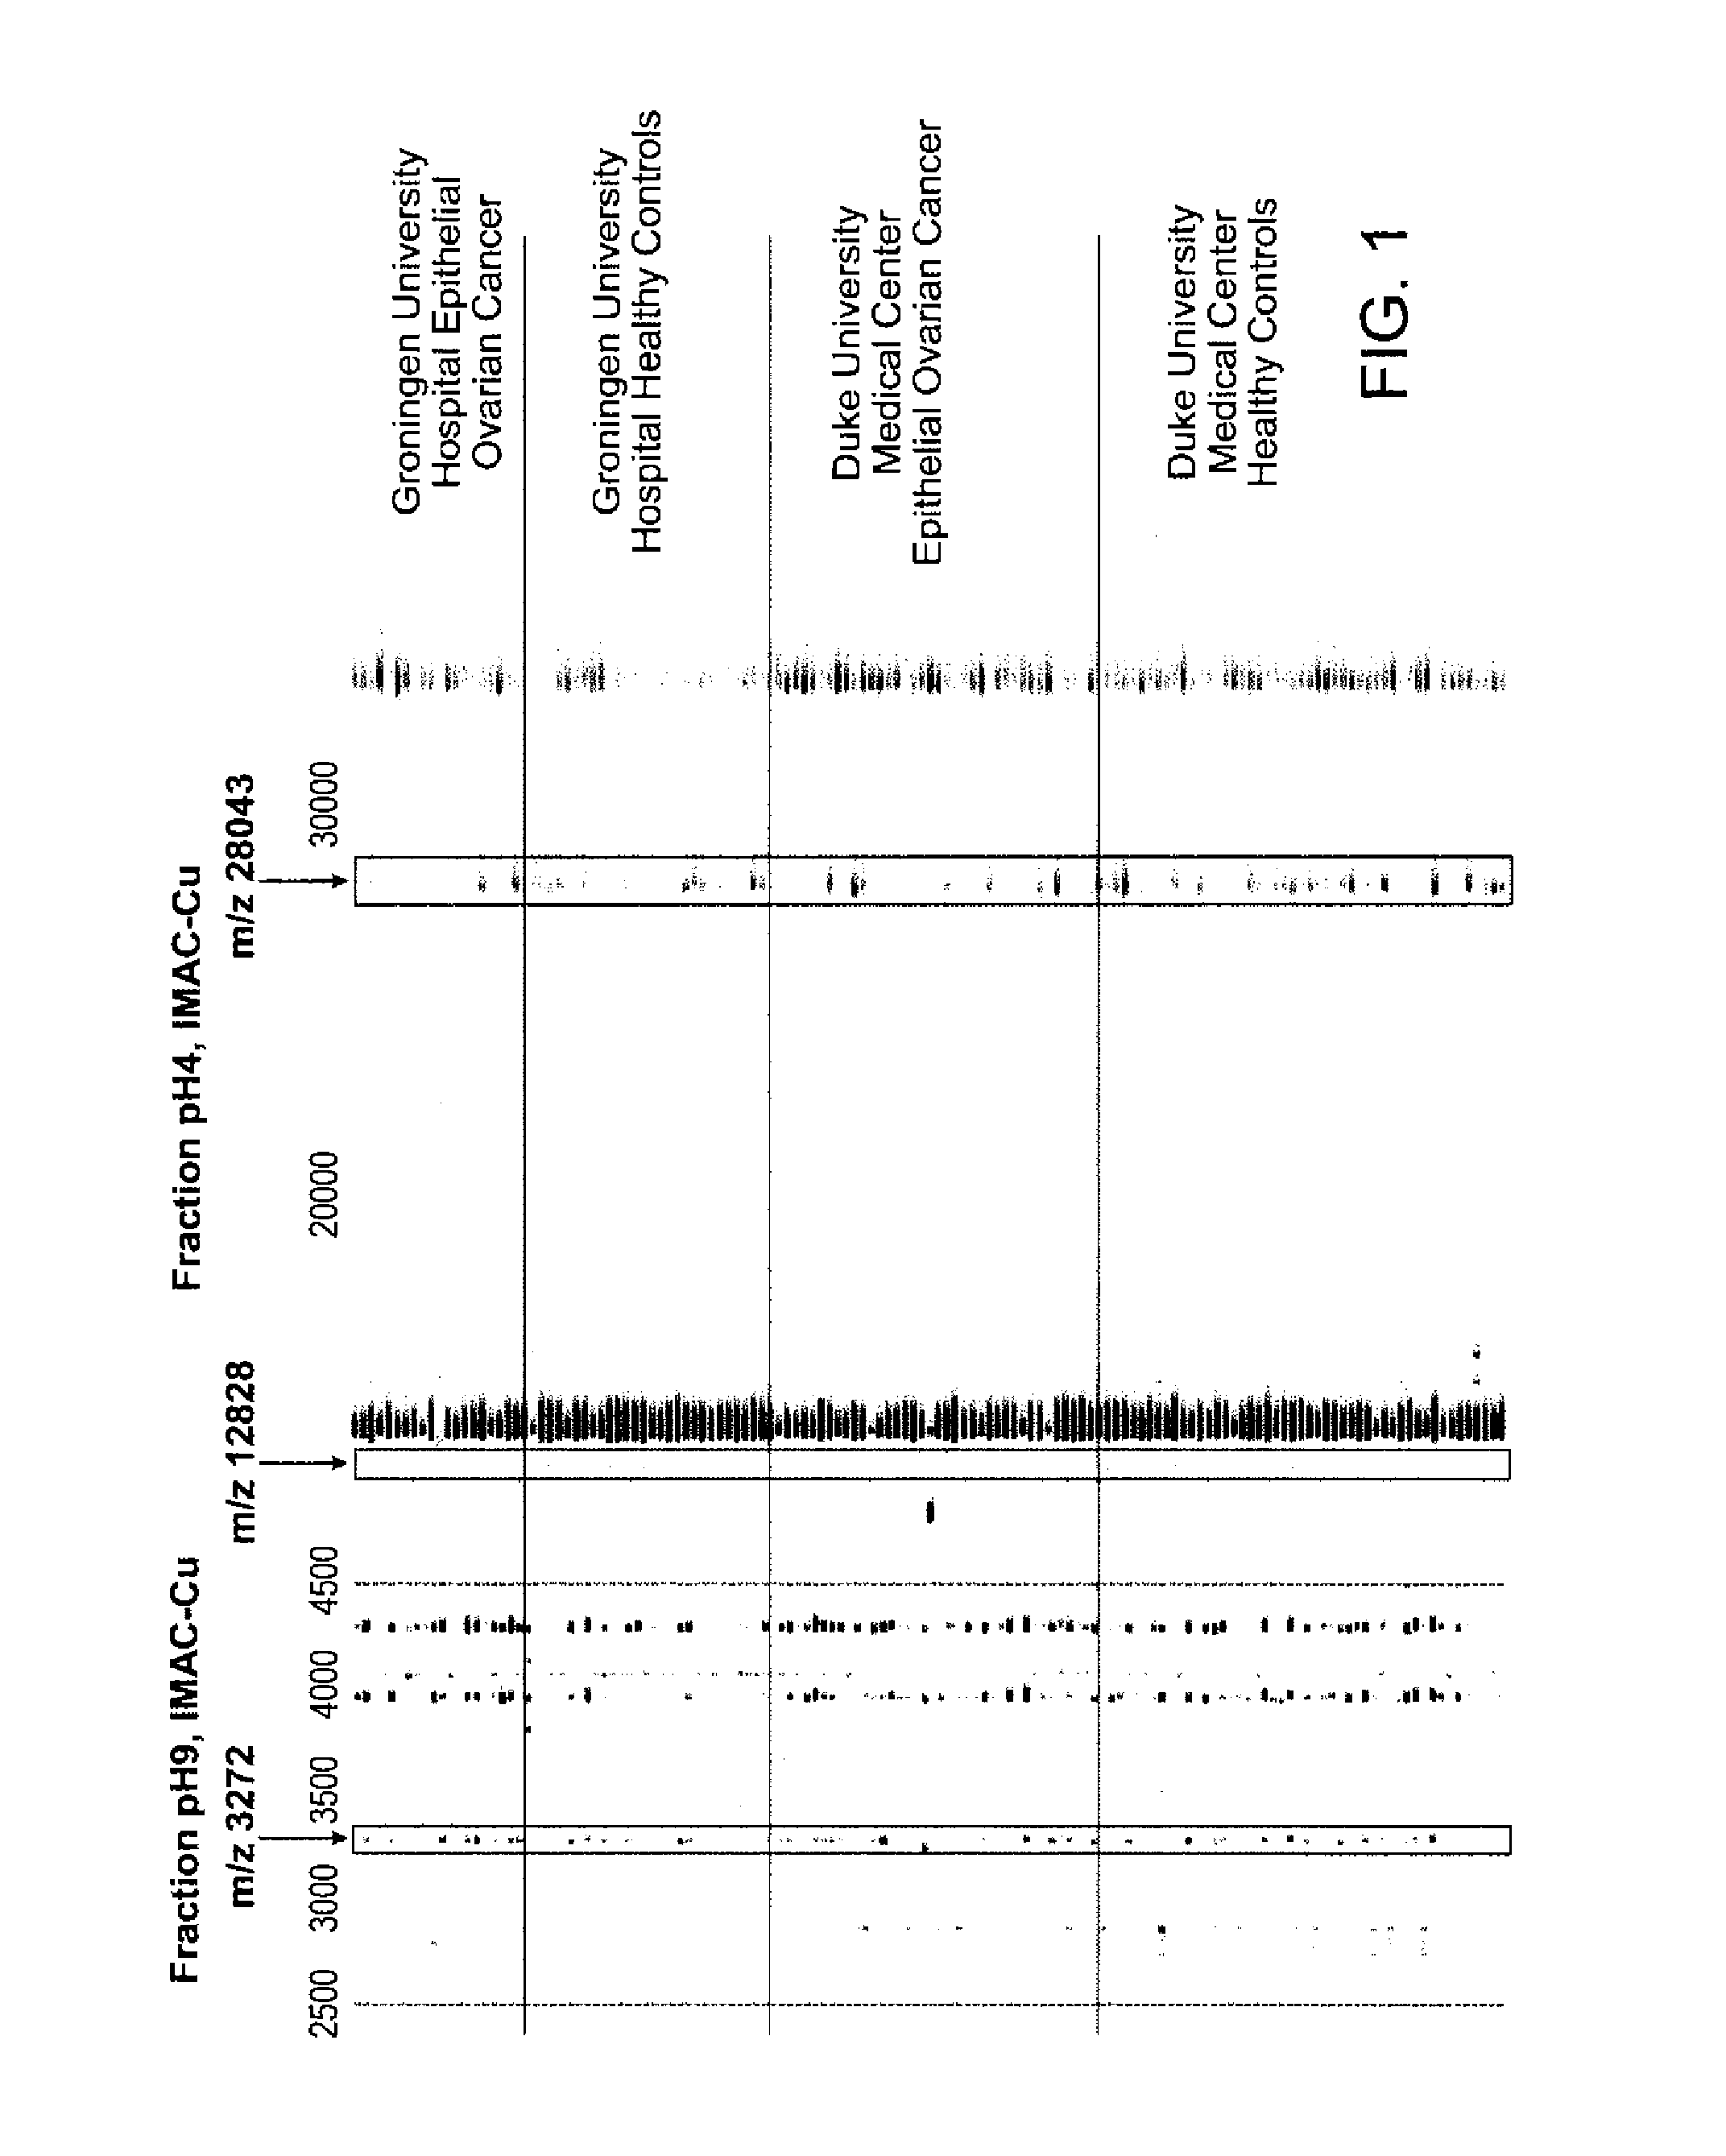
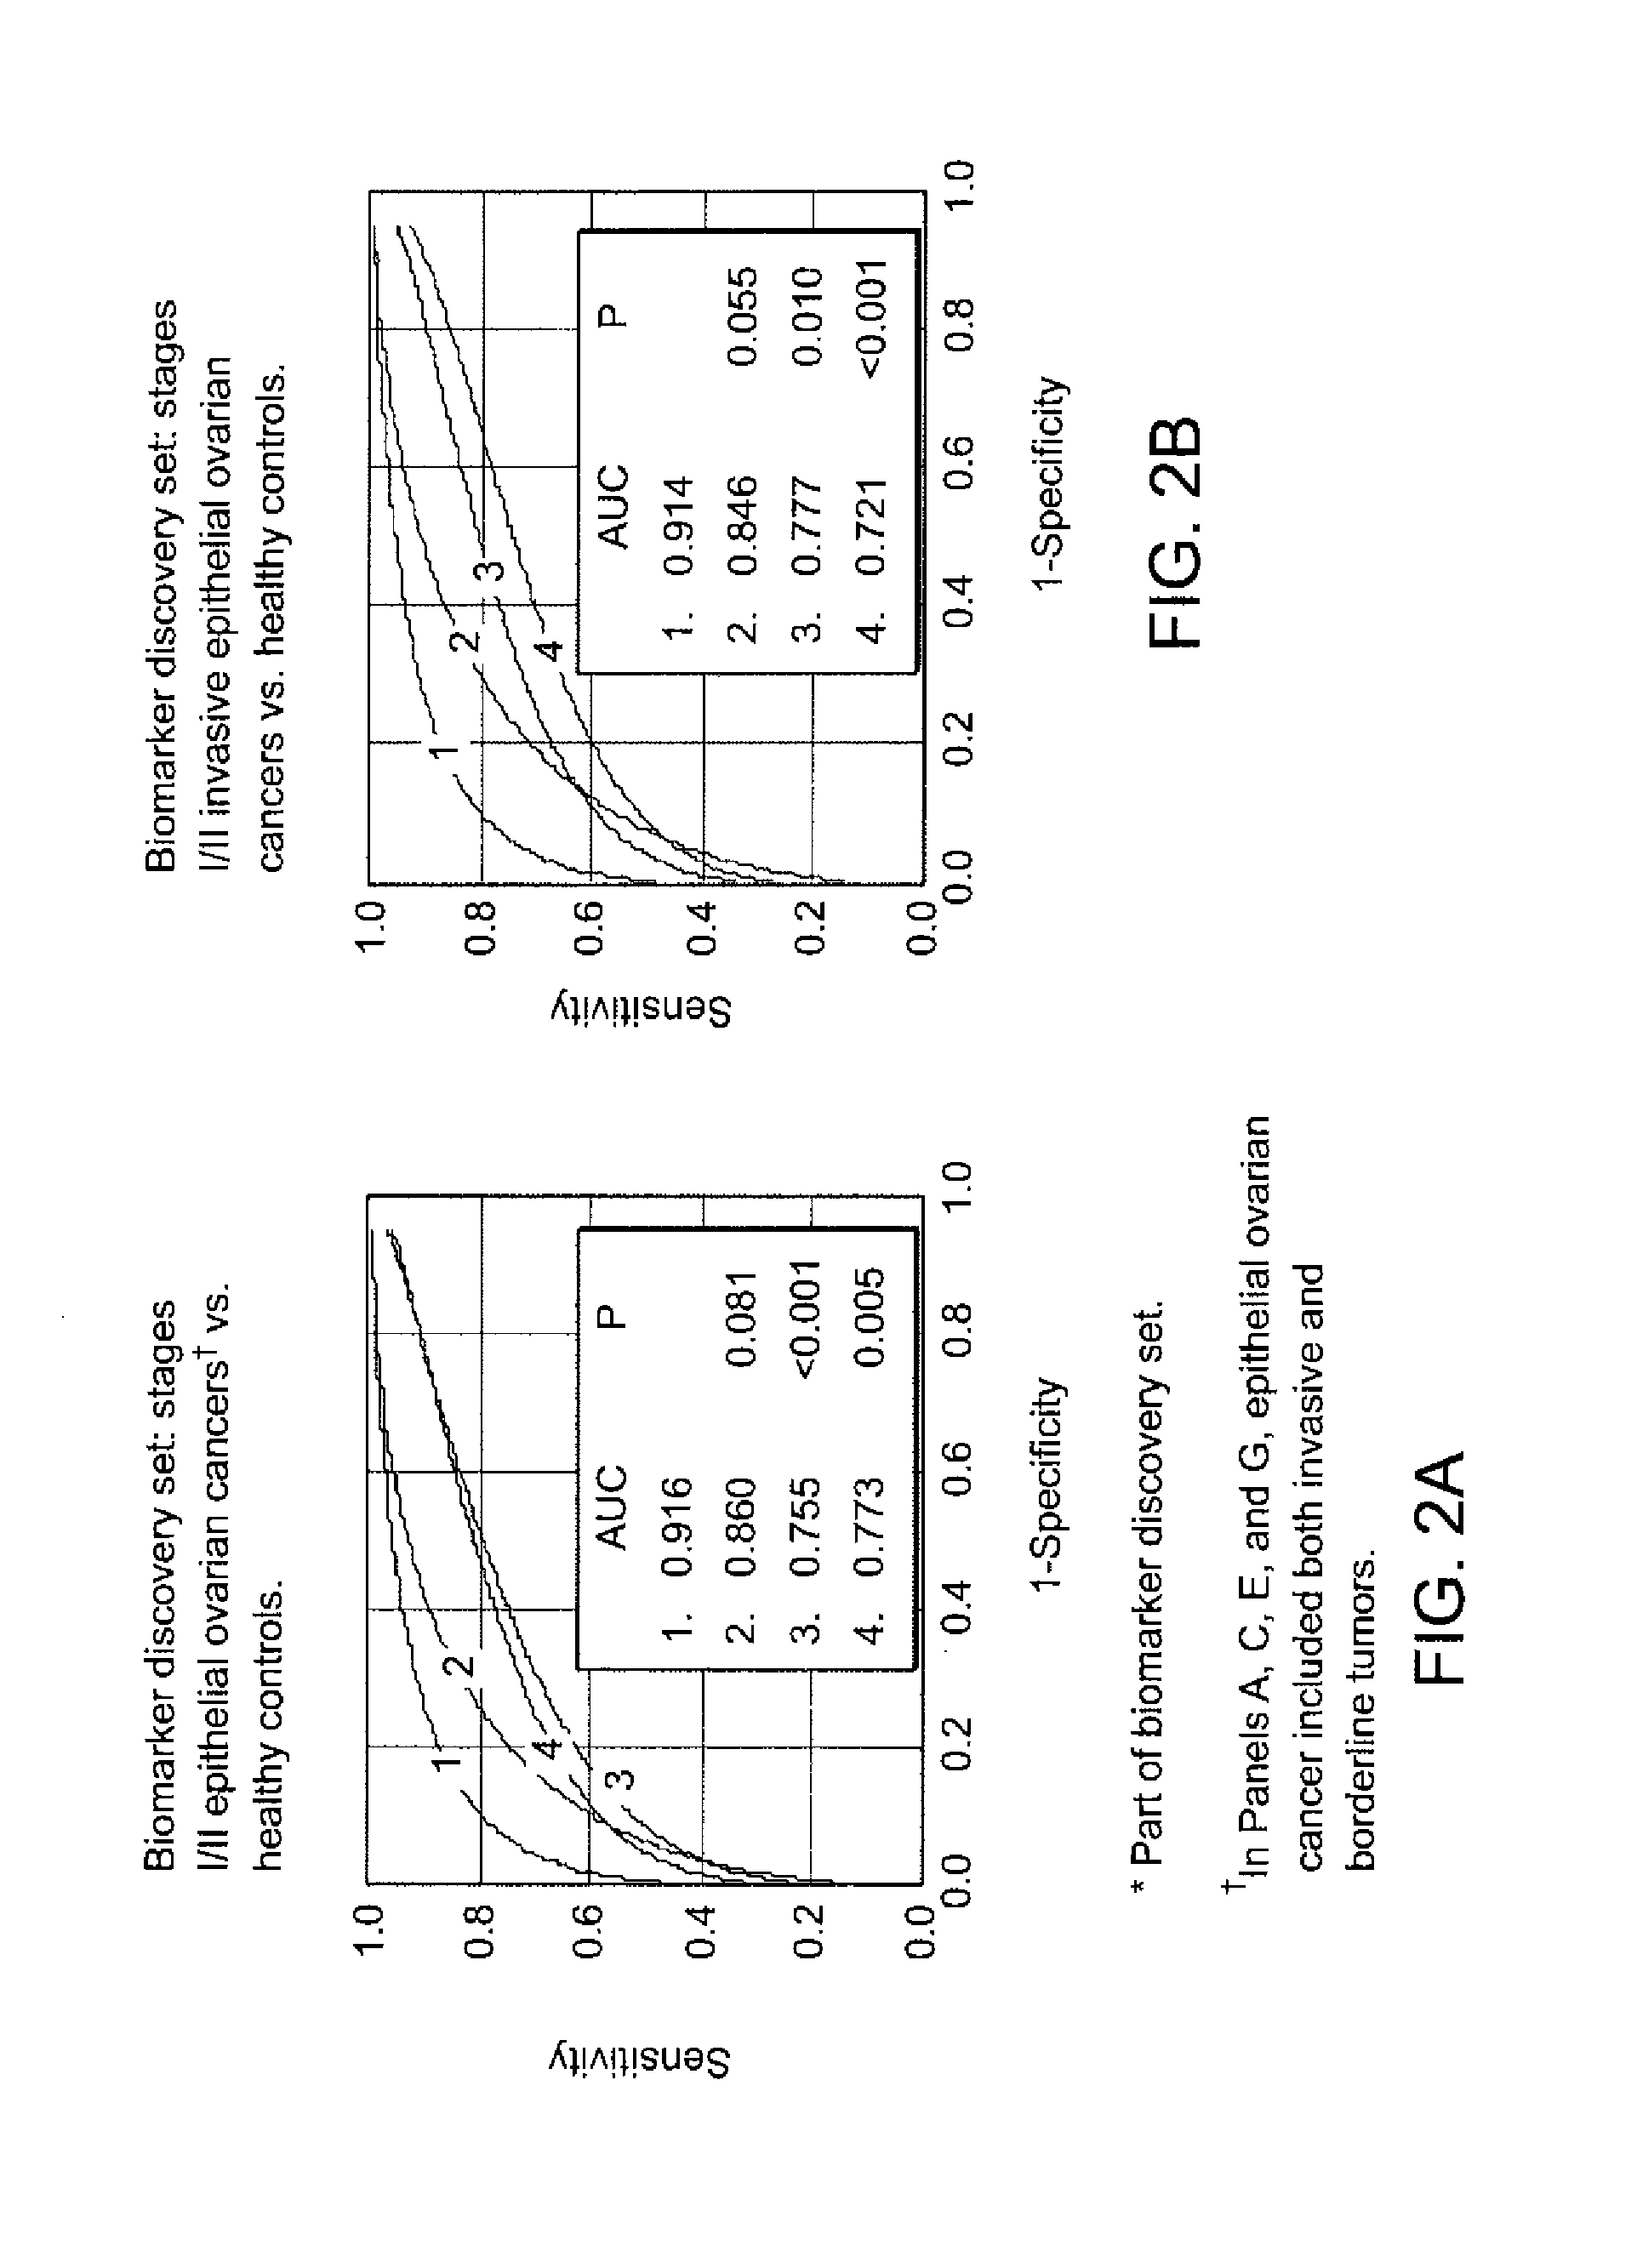
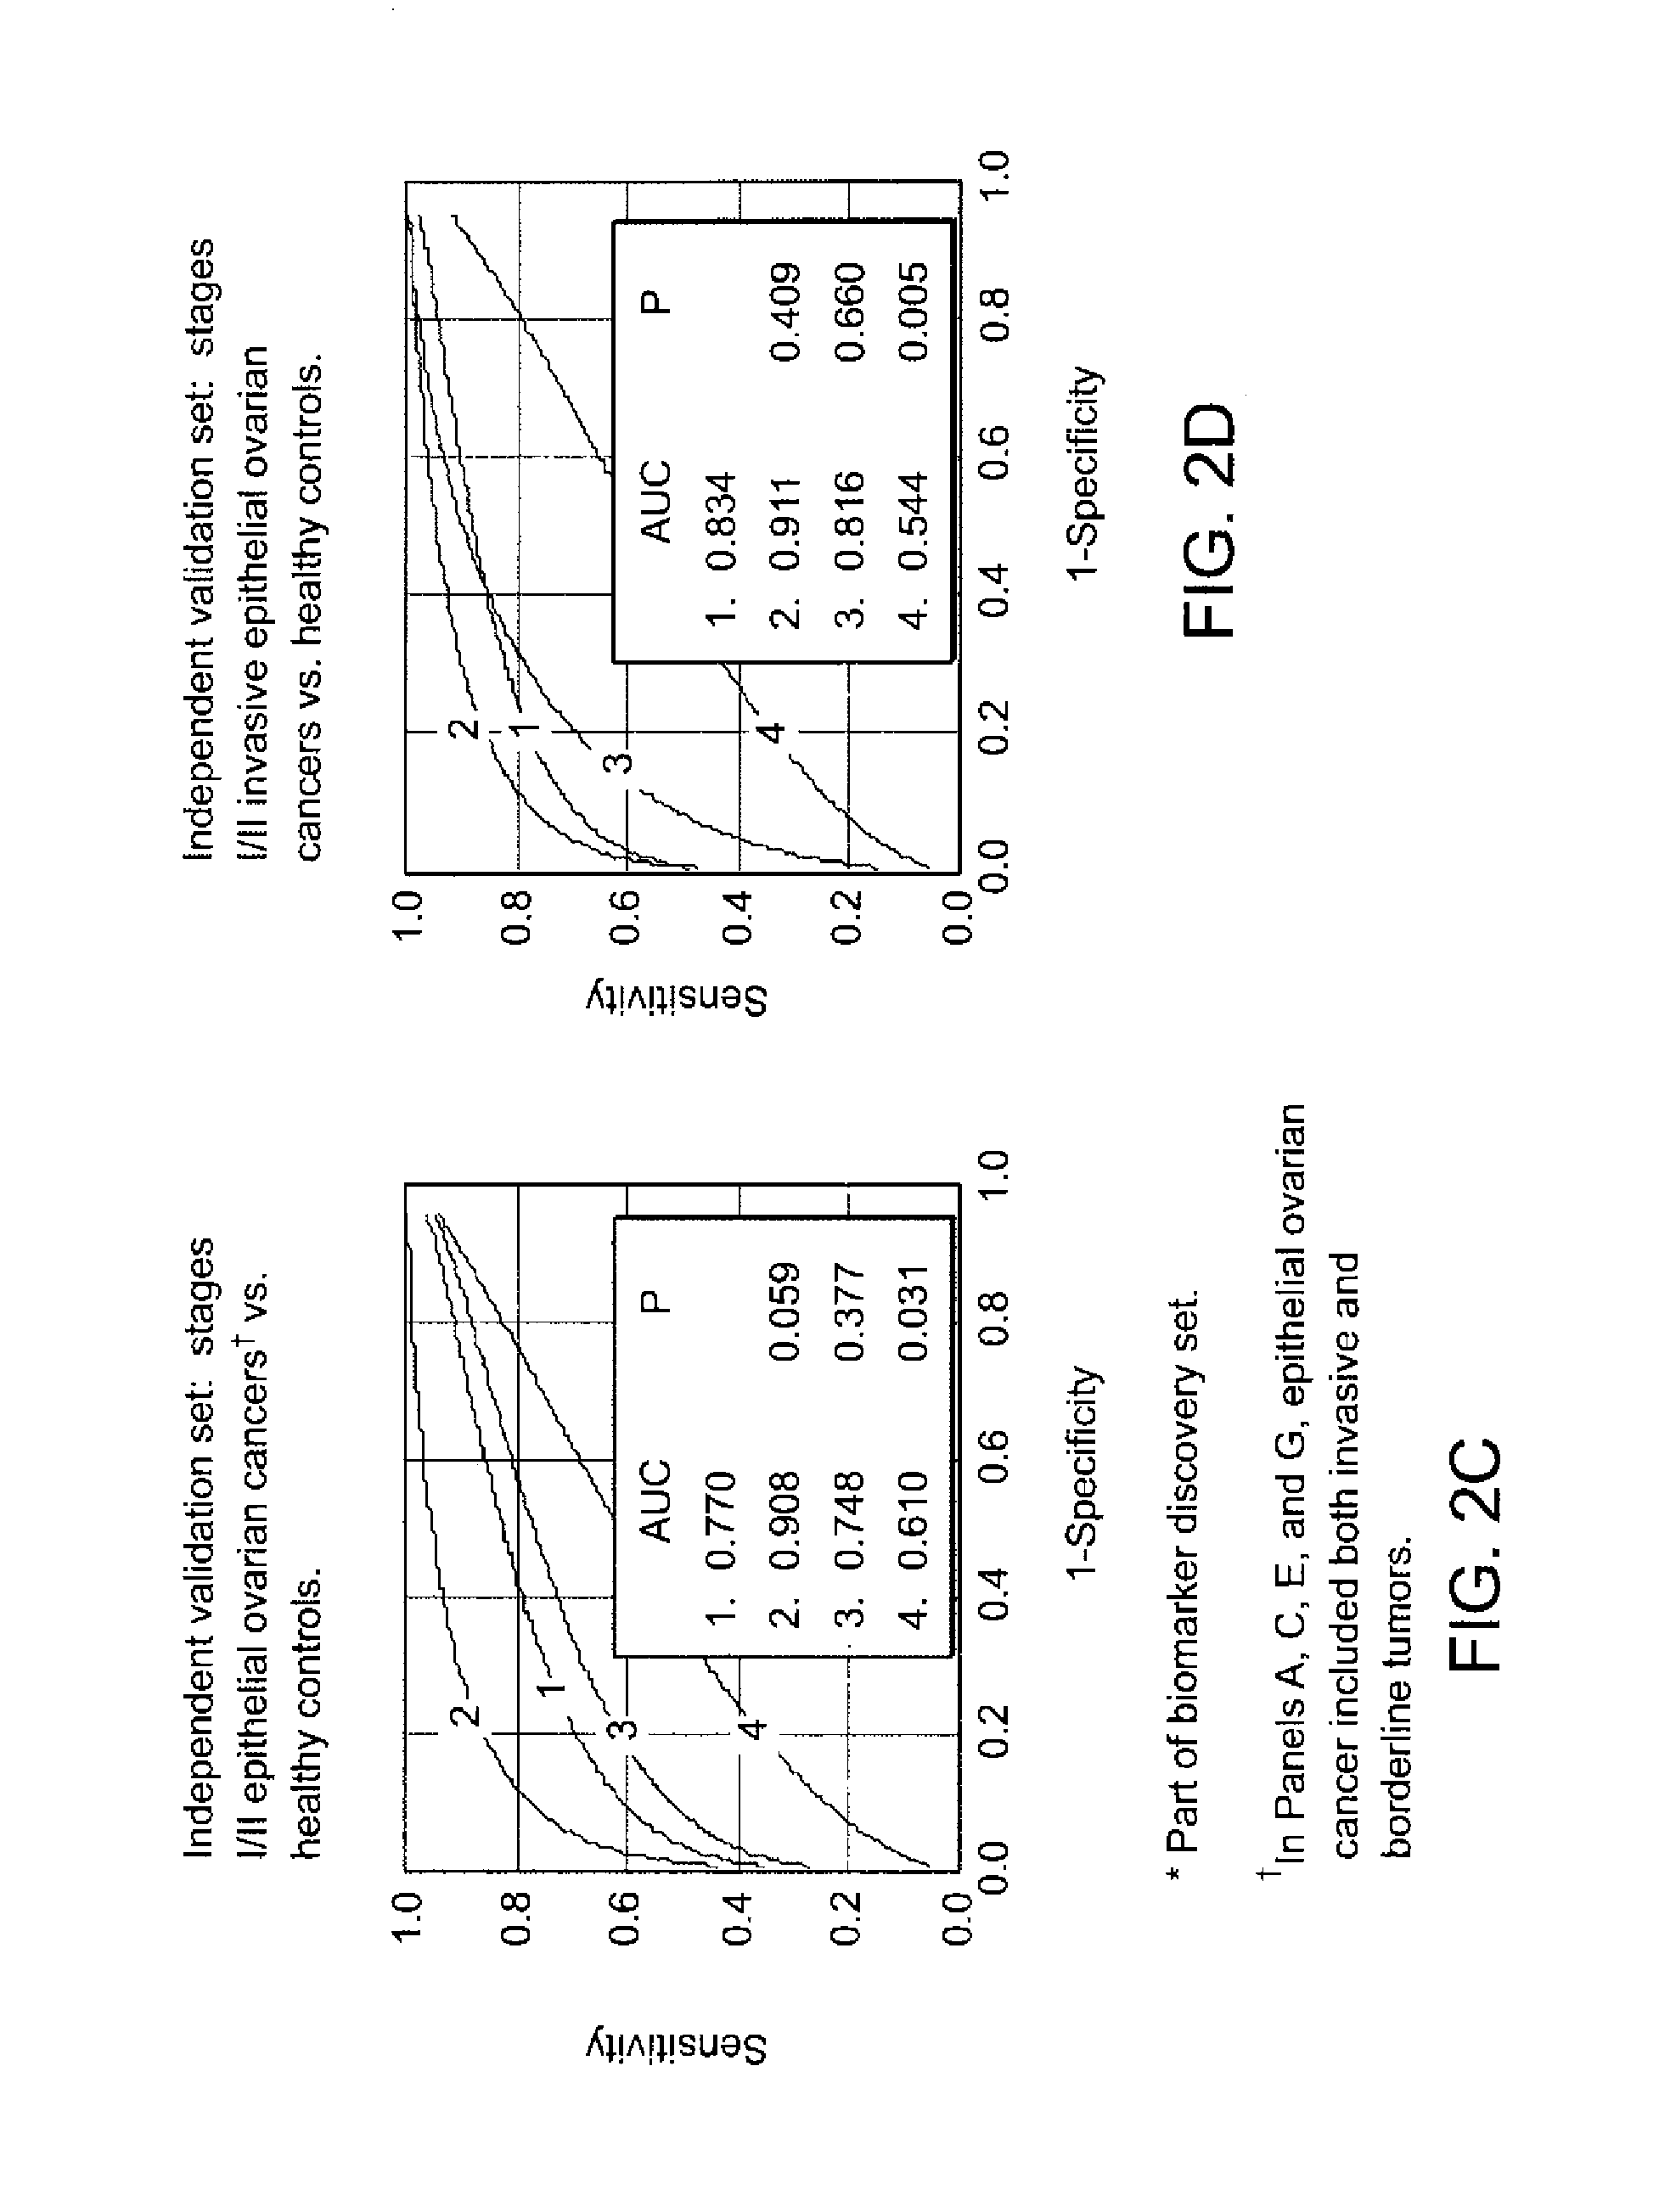
[0259]Biomarker Discovery: Qualified mass peaks (S / N>5, cluster mass window at 0.3%) within the mass range of M / Z 2 kD-50 kD were selected from the SELDI spectra. In order to obtain a more consistent level of data variance across the range of spectrum of interest, logarithmic transformation was applied to the peak intensity prior to further analysis. The peak intensity data of early stage epithelial ovarian cancer patients and healthy controls from Duke University Medical Center (Ca n=36, HC n=47) and Groningen University Hospital (Ca n=20, HC n=30) were analyzed using the Unified Maximum Separability Analysis (UMSA) algorithm that was first used for microarray data analysis and subsequently for protein expression data (ProPeak, 3Z Informatics). ((Li J, et al., Clin Chem 2002; 48:1296-304; Rai A J, et al., Zhang Z, et al. Arch Pathol Lab Med 2002; 126:1518-26; Zhang Z, et al., Applying classification separability analysis to microarray data. In: Lin S M, Johnson ...
example 3
Purification of Biomarkers
For all markers, serum was initially fractionated using the anion exchange protocol used for the protein expression profiling. For each purification step, fractions were monitored either on NP20 or IMAC-copper ProteinChip arrays.
[0262]Purification of the 28 kD Marker: 1 ml of the pH 4 fraction from the anion exchange separation was added to 500 ul of RPC PolyBio 10-15 (Biosepra) and incubated at 4° C. for 1 hour. Fractions containing increasing amounts of acetonitrile with 0.1% trifluoroacetic acid were collected. The 75% acetonitrile / 0.1% trifluoracetic acid fraction was dried down by speed-vac and rehydrated in 100 ul SDS-tricine sample loading buffer without DTT. 40 ul sample was loaded onto 16% tricine gel and run at 100 mV for 4 hrs. The gel was destained with colloid blue kit (Pierce) and the 28 kDa was excised.
Purification of the 12.8 kDa Marker: 10 ml of the pH 4 fraction from the anion exchange separation was adjusted to pH 7.5 with 1 M Tris HCl, p...
PUM
| Property | Measurement | Unit |
|---|---|---|
| mass | aaaaa | aaaaa |
| mass | aaaaa | aaaaa |
| pH | aaaaa | aaaaa |
Abstract
Description
Claims
Application Information
 - R&D Engineer
- R&D Manager
- IP Professional
- Industry Leading Data Capabilities
- Powerful AI technology
- Patent DNA Extraction
Browse by: Latest US Patents, China's latest patents, Technical Efficacy Thesaurus, Application Domain, Technology Topic.
© 2024 PatSnap. All rights reserved.Legal|Privacy policy|Modern Slavery Act Transparency Statement|Sitemap