Method for characterizing an electrical system by impedance spectroscopy

a technology of impedance spectroscopy and electrical system, applied in the field of electrical systems, can solve the problems of change in the stability condition inability to exploit the impedance measurement, and inability to verify hypotheses, so as to achieve simple and quick verification of the stability of the electrical system, and the effect of simple and quick verification of the electrical system

Active Publication Date: 2014-07-08
HELION +2
View PDF2 Cites 8 Cited by
  • Summary
  • Abstract
  • Description
  • Claims
  • Application Information

AI Technical Summary

Benefits of technology

[0020]The interlacing of the sub-series amounts to going back and forth in the scanning of the frequencies. Thus, during scanning of the frequencies in the primary series, the fact of again soliciting the high frequencies makes it possible to detect rapid physical phenomena. Likewise, again soliciting the low frequencies makes it possible to detect identifiable physical phenomena with long times. Thus, all throughout the measurement, it is possible to identify slow or fast physical phenomena, which makes the characterization of the electrical system more precise.
[0030]Thus, the method according to the invention makes it possible to simply and quickly verify the stability of the electrical system, during scanning of the frequency range of the primary series.
[0031]A discontinuity in the values of the impedance situated in this overlap area, detected when said calculated deviation exceeds a threshold deviation, directly shows the instability of the studied electrical system. The stability of the electrical system can therefore be verified simply and quickly.

Problems solved by technology

However, this hypothesis cannot be verified, in particular during deteriorations or temporary failures of the electrical system.
As an example, the drainage and engorgement of a PEM-type fuel cell make the cell unstable, which makes it impossible to exploit the impedance measurement.
The current impedance spectroscopy technique has the drawback of not making it possible to directly identify, during scanning of the frequency range, a change in the stability condition of the electrical system.

Method used


Image

  • Method for characterizing an electrical system by impedance spectroscopy
  • Method for characterizing an electrical system by impedance spectroscopy
  • Method for characterizing an electrical system by impedance spectroscopy

Examples


first embodiment

[0067]In the invention, each sub-series is interlaced with all of the other sub-series of said plurality.

[0068]Each sub-series is traveled through by the sequence of perturbations monotonously, in the same direction, preferably from the high frequencies toward the low frequencies.

[0069]Moreover, said plurality of sub-series of frequencies is traveled through monotonously. Monotonous order means that the plurality of sub-series of frequencies is traveled through from sub-series to adjacent sub-series, following an ordered ranking of the sub-series. Preferably, said sub-series are ranked according to decreasing order of the maximum frequency of each sub-series.

[0070]As an example, and as illustrated by FIGS. 3A and 3B, the primary series A of frequencies to be scanned is from 2 Hz to 10 kHz, and includes 12 frequencies. Thus, the series A is: A={10 kHz, 5 kHz, 2 kHz, 1 kHz, 500 Hz, 200 Hz, 100 Hz, 50 Hz, 20 Hz, 10 Hz, 5 Hz, 2 Hz}.

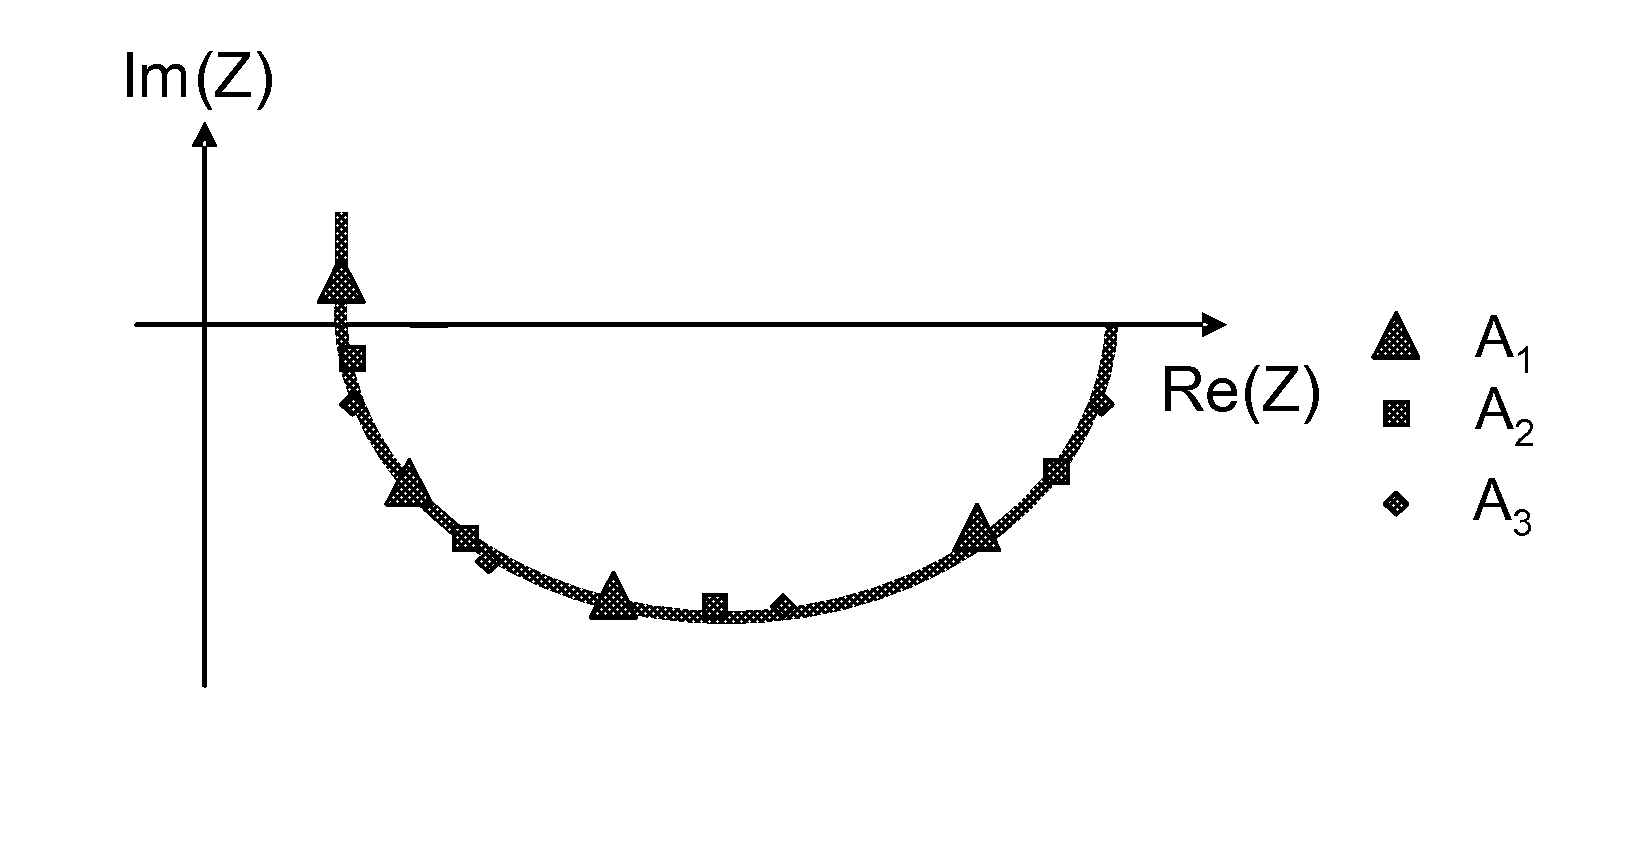
[0071]Three sub-series A1, A2, A3 are formed from the p...

second embodiment

[0099]The sequence of perturbations scans the sub-series turn by turn, following the decreasing order of the maximum frequencies, as in FIG. 4, which illustrates an example of interlacing of the frequencies for the invention.

[0100]Thus, the sequence of perturbations involves a succession of back and forth movements, while going gradually from the high frequencies towards the low-frequencies.

[0101]As previously described, in case of instability of the cell, a discontinuity in the values of the impedance appears at the overlap areas between the adjacent sub-series.

[0102]This discontinuity can be exploited to diagnose a budding defect, such as for example drainage or engorgement of a fuel cell, and to lead to retroaction on the control-command of the fuel cell.

[0103]For the different embodiments described earlier, the frequencies of each sub-series Ai can be scanned no longer monotonously, but randomly, by said sequence of perturbations.

[0104]Likewise, said plurality of sub-series of f...


PUM


Abstract

The invention relates to a method for more precisely characterizing an electrical system by impedance spectrometry. The method consists of applying an input signal to the electrical system that comprises a sequence of sinusoidal perturbations, so as to scan a primary series (A) of frequencies; measuring an output signal of the electrical system in response to the input signal for each of the applied perturbations; and estimating a characteristic size of the impedance of the electrical system for each of the applied perturbations; wherein the perturbations of the sequence are applied so as to scan, turn by turn, a plurality of sub-series (A1, . . . , An) of frequencies resulting from the primary series (A), each sub-series of the plurality being interlaced with at least one other sub-series of the same plurality.

Description

TECHNICAL FIELD[0001]The present invention relates to the general field of electrical systems, and more specifically relates to a method for characterizing said electrical system by impedance spectroscopy.[0002]The electrical system can be an electrochemical device, such as a fuel cell, an electrolyzer, a primary or rechargeable battery, or any other type of electrical system.BACKGROUND OF THE INVENTION[0003]Impedance spectroscopy is a characterization technique used in many technical fields.[0004]As an illustration, impedance spectroscopy is used in the fields of corrosion, for example to estimate the corrosion rate of a metal piece, electrodeposition, or determining a state of health of an electrochemical device such as a fuel cell.[0005]In the latter case, the impedance spectroscopy technique can be used to detect the engorgement and drainage of a fuel cell, as described in the article by Fouquet et al. entitled “Model based PEM fuel cell state-of-health monitoring via ac impedan...

Claims


Application Information

Patent Timeline
Patent Type & Authority Patents(United States)
IPC IPC(8): G01R27/02G01R31/26G01R23/00G01R23/16
CPCG01R23/16Y02E60/50G01R31/2612G01R31/3662G01R27/02H01M8/04634G01R23/00G01R31/389
Inventor PHLIPPOTEAU, VINCENTTURPIN, CHRISTOPHERAKOTONDRAINIBE, ANDRE
Owner HELION
Why Eureka
Try Eureka