
System and method for analyzing properties of meat using multispectral imaging

a multi-spectral imaging and meat technology, applied in the field of meat processing, analysis, classification, can solve the problems of lack of incentives for producers to supply a tender product, inability to incorporate a direct measure of tenderness in the usda grading system, and similar problems with pork and other meat products

Active Publication Date: 2014-07-08
CARNE TENDER LLC
View PDF16 Cites 2 Cited by
  • Summary
  • Abstract
  • Description
  • Claims
  • Application Information

AI Technical Summary

Benefits of technology

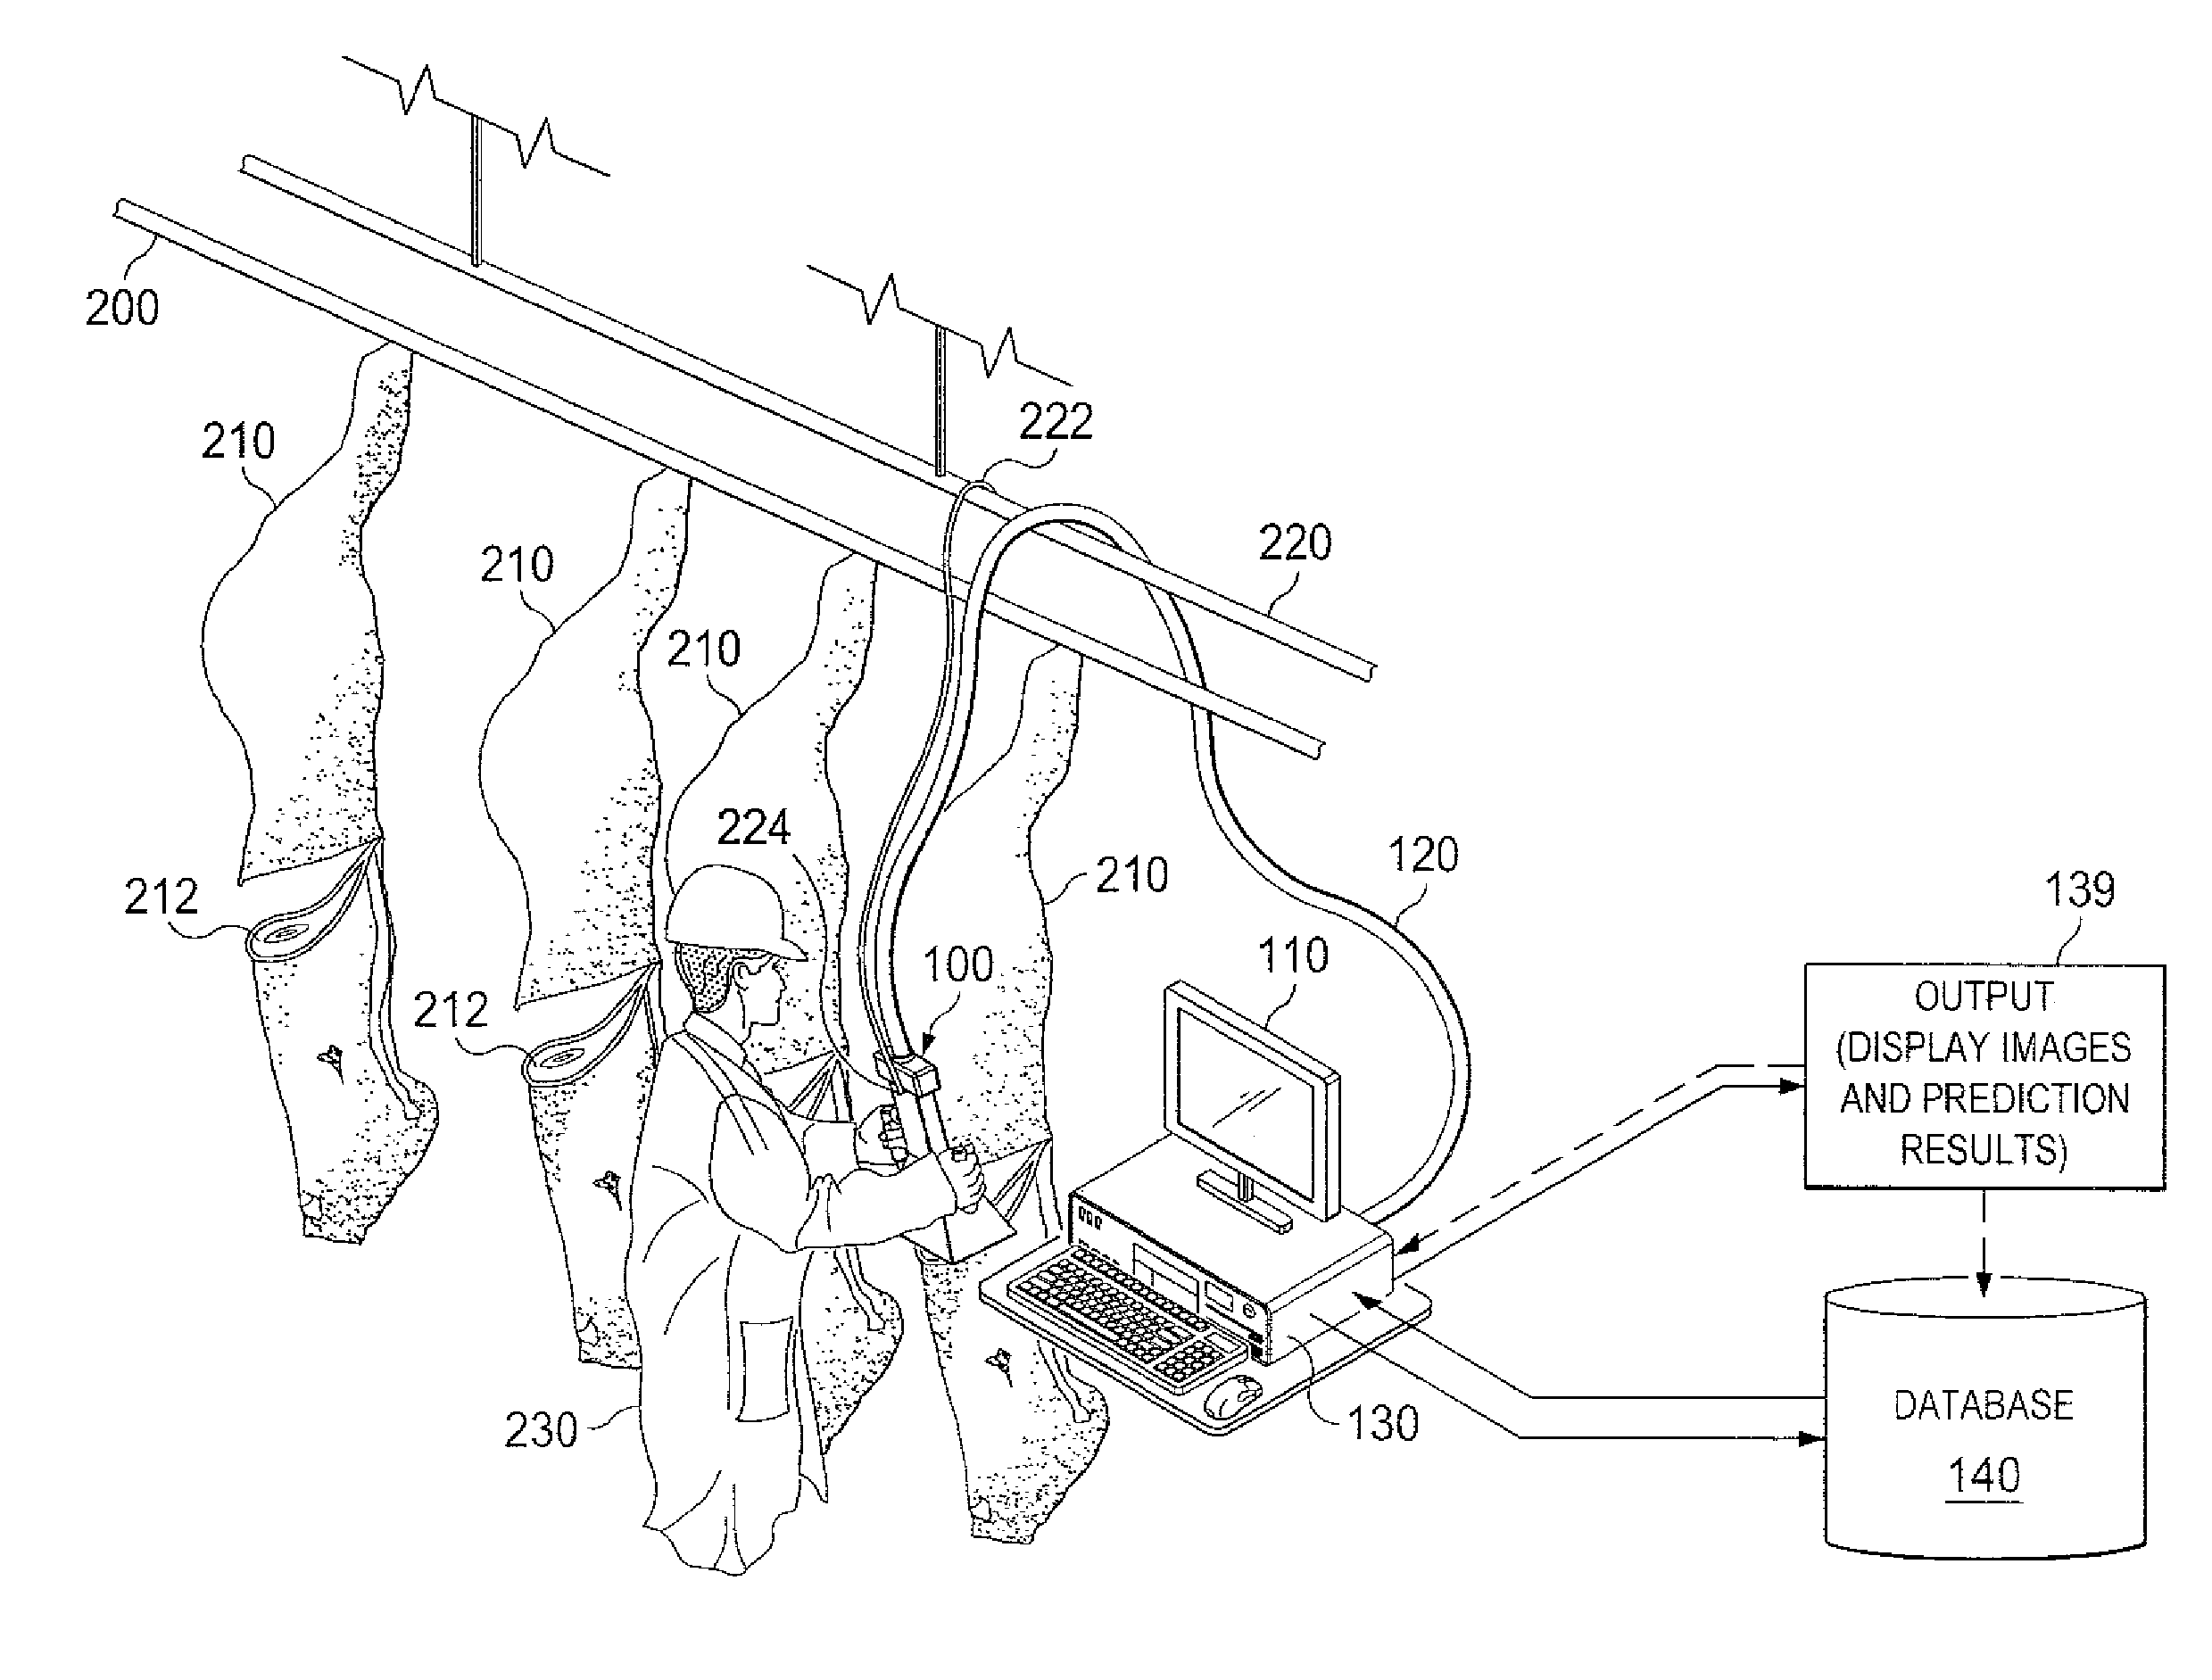
[0065]Thus, the multispectral system and method disclosed herein eliminates the lag or delay in processing and provides more information than can be provided by observation with the human eye. Currently, it is standard in the United States and some other countries to provide a marbling score and quality grade from observation with the human eye. A multispectral image taken immediately after the 12th / 13th rib interface is exposed can provide these same marbling and grading factors objectively. Cost and efficiency advantages may be realized with this more rapid and objective determination of beef quality grades.
[0087]Entropy: An indication of the complexity or information content within an image—i.e., the more complex or detailed an image, the higher the entropy value.
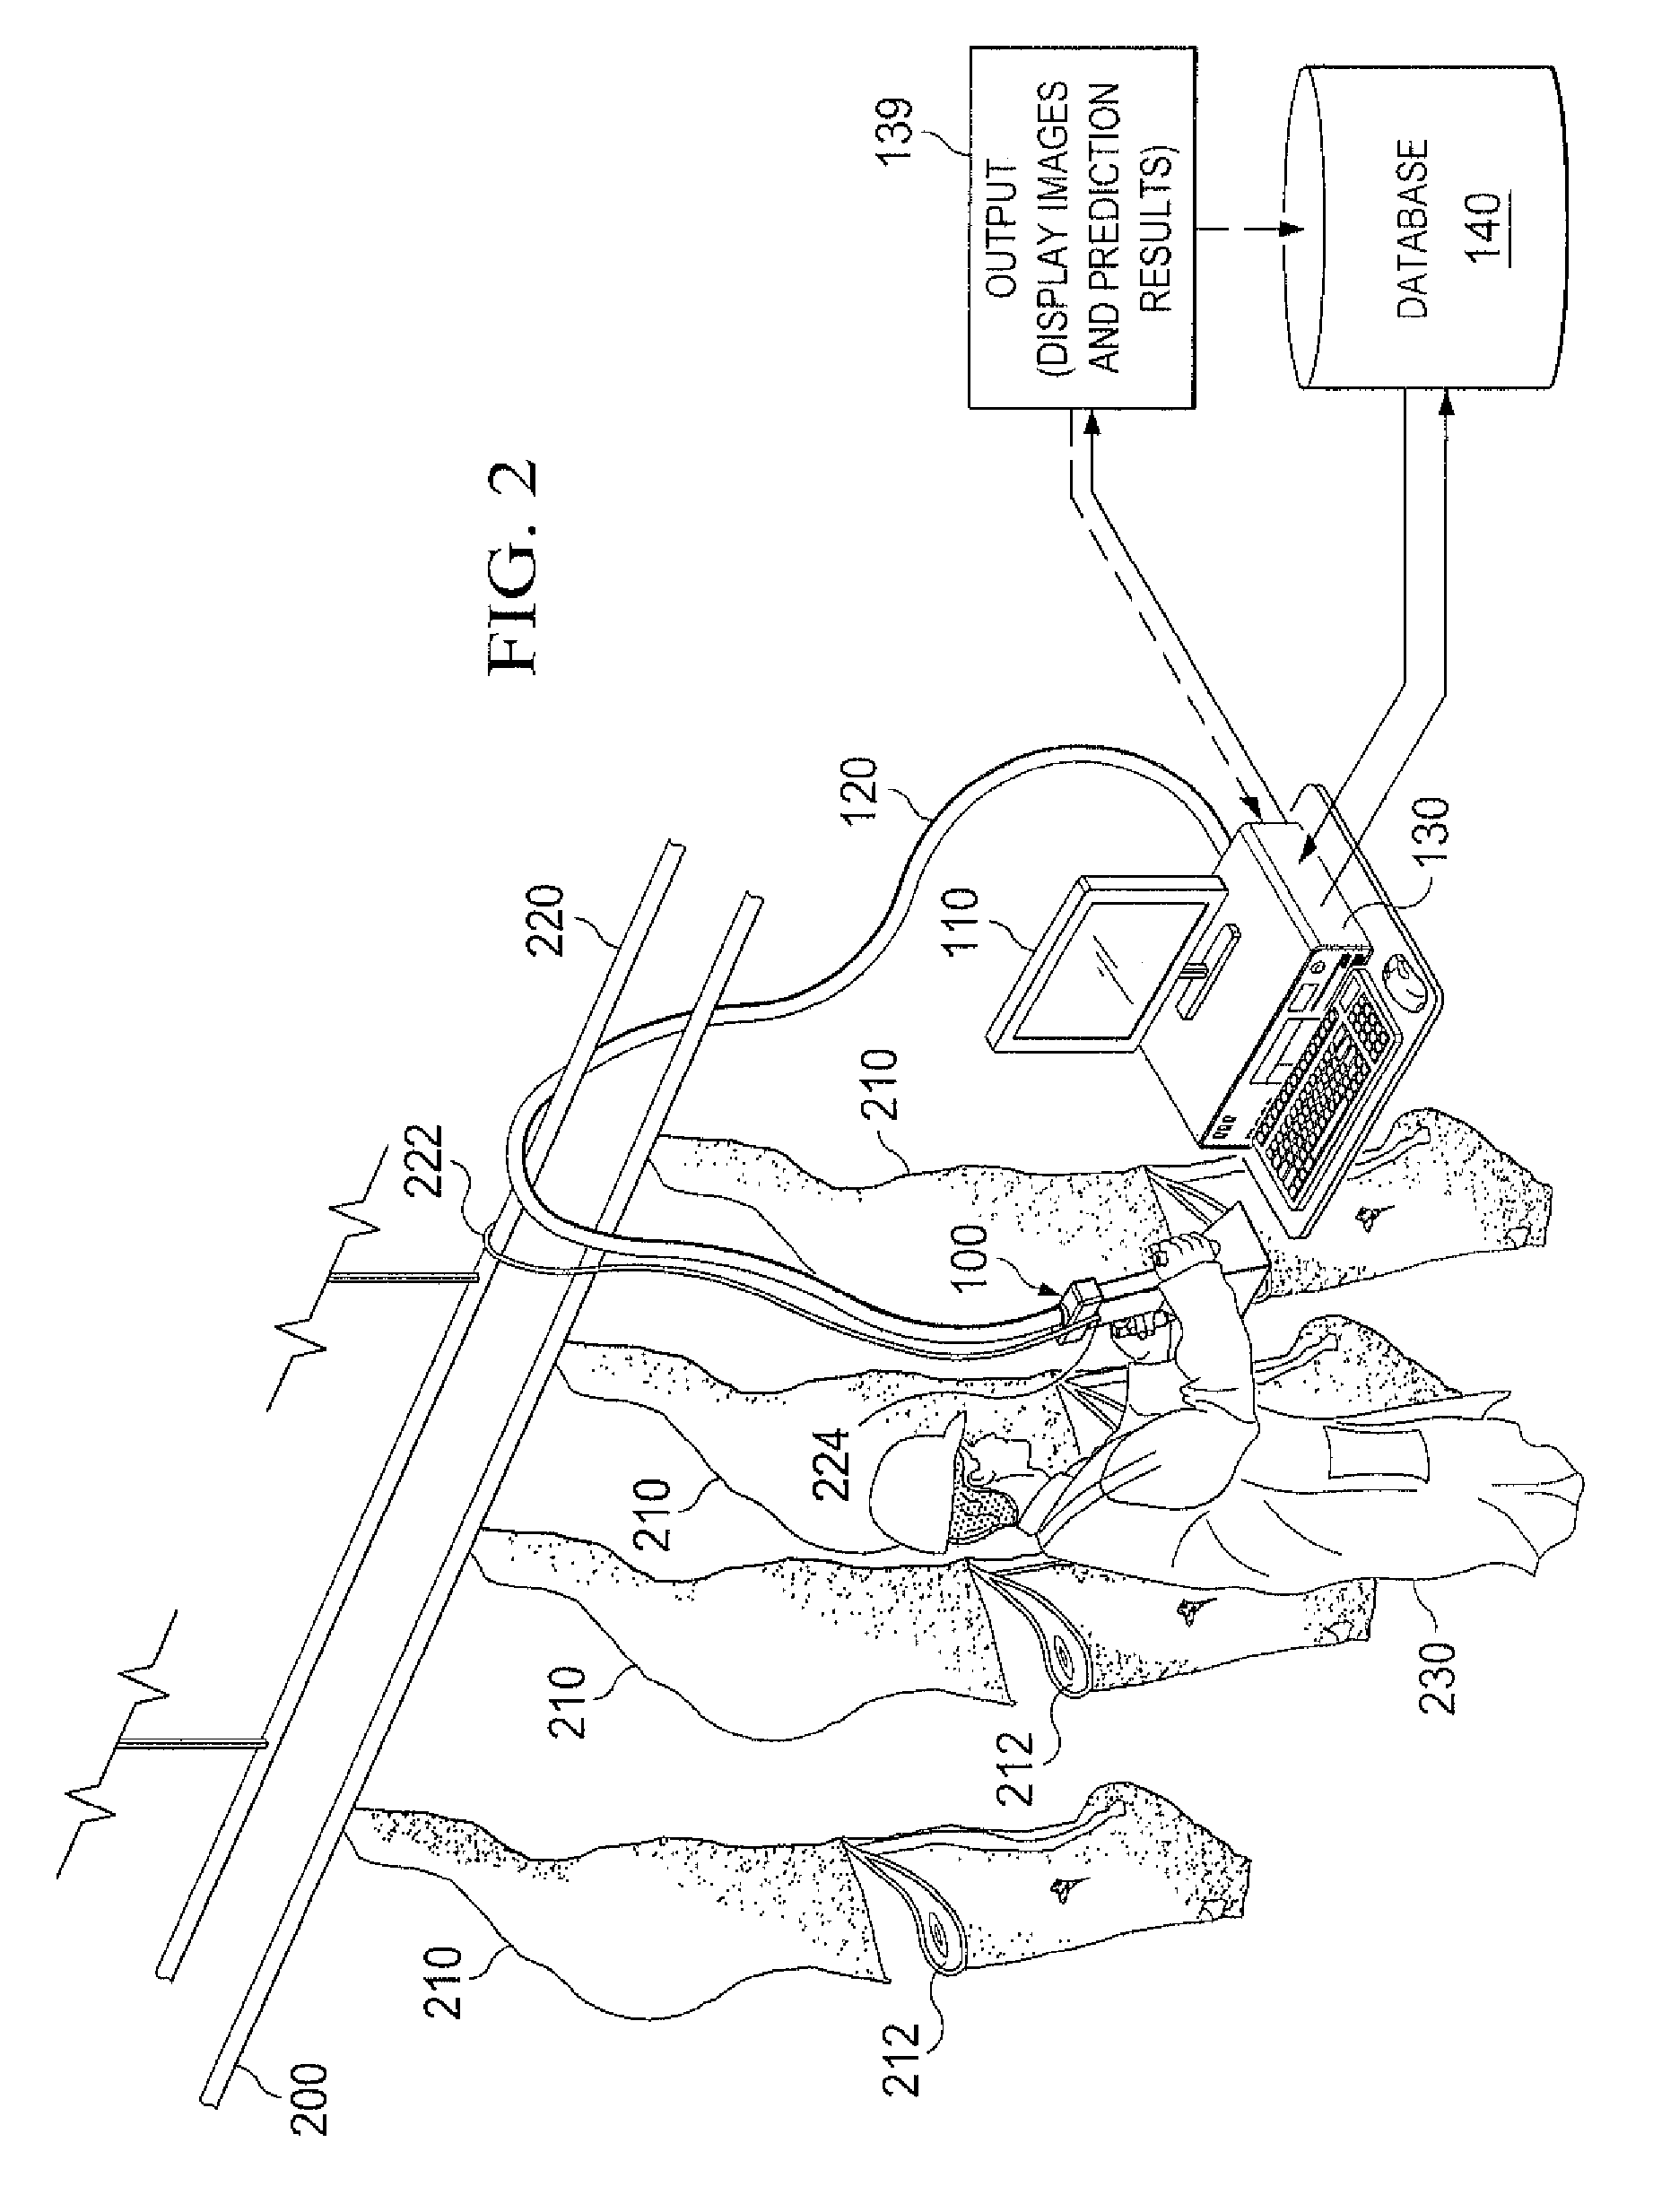
[0092]The computer may also have a labeling program and communication means enabling it to send information discerned or computed about the carcass to an electronic tag secured to the carcass. Such tags are known in the art and may be employed by a meat producer to store all data relevant to a given carcass thereon. The computer labeling program can send a forecast of tenderness as well as any other data to the carcass tag. This allows the system and method of the invention to output information directly to the item under analysis, thereby fostering better individual carcass management by the processing facility.Identification of Key Wavelength Bands for Predicting Meat Quality
[0123]Often, the beef industry is interested in classifying steaks into two categories—tender and tough. The pattern recognition models can be easily modified to classify steaks into two categories. Similarly, if a company is interested in three or more categories, that can also be easily achieved.

Problems solved by technology

Presently, the USDA grading system is unable to incorporate a direct measure of tenderness because there is no accurate, rapid, nondestructive method for predicting tenderness available to the beef industry.
Thus, beef carcasses are not priced on the basis of actual tenderness, creating a lack of incentives for producers to supply a tender product.
Similar issues are present with respect to pork and other meat products.
A near-infrared spectroscopy system to predict beef tenderness has also been reported; however, the beef industry has not adopted this technology due to its technological limitations and low accuracy.

Method used


Image

  • System and method for analyzing properties of meat using multispectral imaging
  • System and method for analyzing properties of meat using multispectral imaging
  • System and method for analyzing properties of meat using multispectral imaging

Examples


example 1

Multispectral Analysis of Beef

[0116]Twelve key wavelength bands in the NIR—1057, 1074, 1091, 1115, 1142, 1176, 1219, 1280, 1365, 1395, 1408, and 1462 nm were predetermined as related to tenderness classification. For each wavelength band, 8 image-textural features (mean, variance, homogeneity, contrast, dissimilarity, entropy, second moment, and correlation) were extracted using a co-occurrence matrix analysis, thus creating a total of 96 image-textural features per steak image. Using these 96 image-textural features, a canonical discriminant analysis was performed to create two new, uncorrelated variables (canonical variable 1 and 2: Can1 and Can2). These canonical variables are independent of each other and are the linear combination of original variables. Two models were developed: one for trained taste panel (TP) and one for slice shear force (SSF). Significant (p<0.10) correlations of individual textural features and / or the canonical variables were found with all of the biochem...

example 2

Evaluation of Eight Extracted Textural Features from Multispectral Images Captured at Key Wavelength Bands

[0119]Eight textural features were extracted using gray level co-occurrence matrix (GLCM) analysis from each of 12 identified bands. Textural features can also be extracted by other methods such as Gabor filters and / or wavelet analysis from each of those identified bands. Thus, 96 features were extracted. In addition to textural features, marbling features such as number and distribution of fat flecks, marbling texture, and % fat area can also be extracted. A stepwise discriminant regression method was used to select 46 variables. These variables were used to classify the steaks into two tenderness categories. The overall accuracy was 88% for SSF and 87% for taste panel (TP). The results are presented in Table 3 for predicting SSF and Table 4 for TP below.

[0120]

TABLE 3Evaluation of multispectral imaging system for predicting SSFCross-validationReferenceActualPredictedResultsSSFT...

example 3

Identification of Key Wavelength Bands for VNIR Multispectral Imaging System

[0125]PCA was implemented to reduce the spectral dimension of a Region of Interest (ROI) within a hyperspectral image. The optimal number of PC images was chosen with Eigen values significantly greater than zero. (Johnson, R. A., 1998. Applied Multivariate Methods for Data Analysis. Duxbury Press, New York, N.Y.) For this step, the first five PC images had Eigen values significantly greater than zero. These Eigen values explained over 90% of the variance of all bands for the image. In this study, ‘mosaic’ data transformation was used.

[0126]FIG. 9 shows the first three loading vectors. By “peak-valley analysis”, 12 key wavelengths can be identified.

[0127]Twelve key wavelength bands in the visible near-infrared (VNIR: 400-1000 nm) were identified. The wavelengths (455, 480, 520, 545, 568, 590, 604, 636, 722, 750, 814, and 850 nm) were identified as playing major roles in constructing the PC images (See FIG. 9)...


PUM


Abstract

A system and method for obtaining multispectral images of fresh meat at predetermined wavelength bands at a first time, subjecting the images to analysis in an image analysis system comprising a computer programmed to perform such analysis, and outputting a forecast of meat tenderness at a later point in time. Predetermined key wavelength bands are precorrelated with a high degree of prediction of meat tenderness and / or other properties of meat and are used in the multispectral system and method. A system and method for determining the key wavelengths is also disclosed. The multispectral imaging system and method is suitable for use in an industrial setting, such as a meat processing plant. The system and method is useful in a method for determining quality and yield grades at or near the time of imaging in lieu of visual inspection with the unaided human eye, increasing efficiency and objectivity.

Description

CROSS REFERENCE TO RELATED APPLICATIONS[0001]This application claims the benefit of U.S. Provisional Application No. 61 / 143,783, filed Jan. 10, 2009.STATEMENT REGARDING FEDERALLY SPONSORED RESEARCH OR DEVELOPMENT[0002]Not applicable.TECHNICAL FIELD OF INVENTION[0003]This invention relates to the field of the meat processing, analysis, and classification.BACKGROUND OF THE INVENTION[0004]Meat processing, analysis and classification are important so that consumers can obtain quality meat products for consumption and be provided with information about the meat at the point of purchase. The United States is a large producer of beef, pork and other meats. In the United States beef industry, beef grading standards were developed by the United States Department of Agriculture (USDA) to classify carcasses into quality and yield grades. Beef tenderness is an important quality attribute associated with consumer satisfaction. Presently, the USDA grading system is unable to incorporate a direct ...

Claims


Application Information

Patent Timeline
Patent Type & Authority Patents(United States)
IPC IPC(8): G06K9/00
CPCG06T2207/10024G01J3/0262G01J3/02G06T2207/30128G01J3/42G01J3/2823G01J3/0291G01J3/2803G01N21/3563G01J3/28G01N33/12G06T7/0004
Inventor SUBBIAH, JEYAMKONDANCALKINS, CHRIS RICHARDSAMAL, ASHOK KUMORNAGANATHAN, GOVINDARAJAN KONDA
Owner CARNE TENDER LLC
Learn More