System and method for visualizing multiple-sensor subsurface imaging data

a subsurface imaging and multi-sensor technology, applied in scene recognition, instruments, computing, etc., can solve the problems of inability to detect utilities, inability to accurately detect utilities, and inability to record utilities, etc., to achieve the effect of improving the visual perception of the selected graphical representation

Active Publication Date: 2017-05-09
UNDERGROUND IMAGING TECH
View PDF127 Cites 6 Cited by
  • Summary
  • Abstract
  • Description
  • Claims
  • Application Information

AI Technical Summary

Benefits of technology

[0015]The volume depicted on the display may be defined by a length, a width, and a depth. The length and width may be respectively representative of a length and a width of each of a plurality of scan regions of earth subjected to sensing by use of the plurality of sensor. One or more of the graphical representations may be selected for viewing or hiding within the volume depicted on the display. For example, one of the graphical representations may be selected, and the selected graphical representation may be altered in a manner that enhances visual perception of the selected graphical representation relative to non-selected graphical representations within the volume. Altering the selected graphical representation may involve adding or altering one or more of a color, grey scale, line style, shading, hatching, or marker of the selected graphical representation. User developed indicia data may be provided, such as one or more of annotations, axis labels, legends, and textual information. The indicia data may be added to the display comprising the graphical representations.

Problems solved by technology

However, such recordation is not particularly reliable, as only a certain percentage of the utilities are recorded, and those that are recorded may have suspect or imprecise location data.
As such, currently-existing location data for buried utilities is often incomplete and suspect in terms of accuracy.
However, GPR has problems detecting utilities in certain soil types and conditions that limit GPR's use in many areas of the United States and the world, such as much of southwest United States (e.g., Arizona).
GPR data is typically difficult to interpret, and is typically analyzed by highly skilled users.
Although use of other sensors in combination with GPR can yield meaningful subsurface information, such multi-sensor systems produce massive data sets.

Method used


Image

  • System and method for visualizing multiple-sensor subsurface imaging data
  • System and method for visualizing multiple-sensor subsurface imaging data
  • System and method for visualizing multiple-sensor subsurface imaging data

Examples


Embodiment Construction

[0058]In the following description of the illustrated embodiments, references are made to the accompanying drawings which form a part hereof, and in which is shown by way of illustration, various embodiments in which the invention may be practiced. It is to be understood that other embodiments may be utilized, and structural and functional changes may be made without departing from the scope of the present invention.

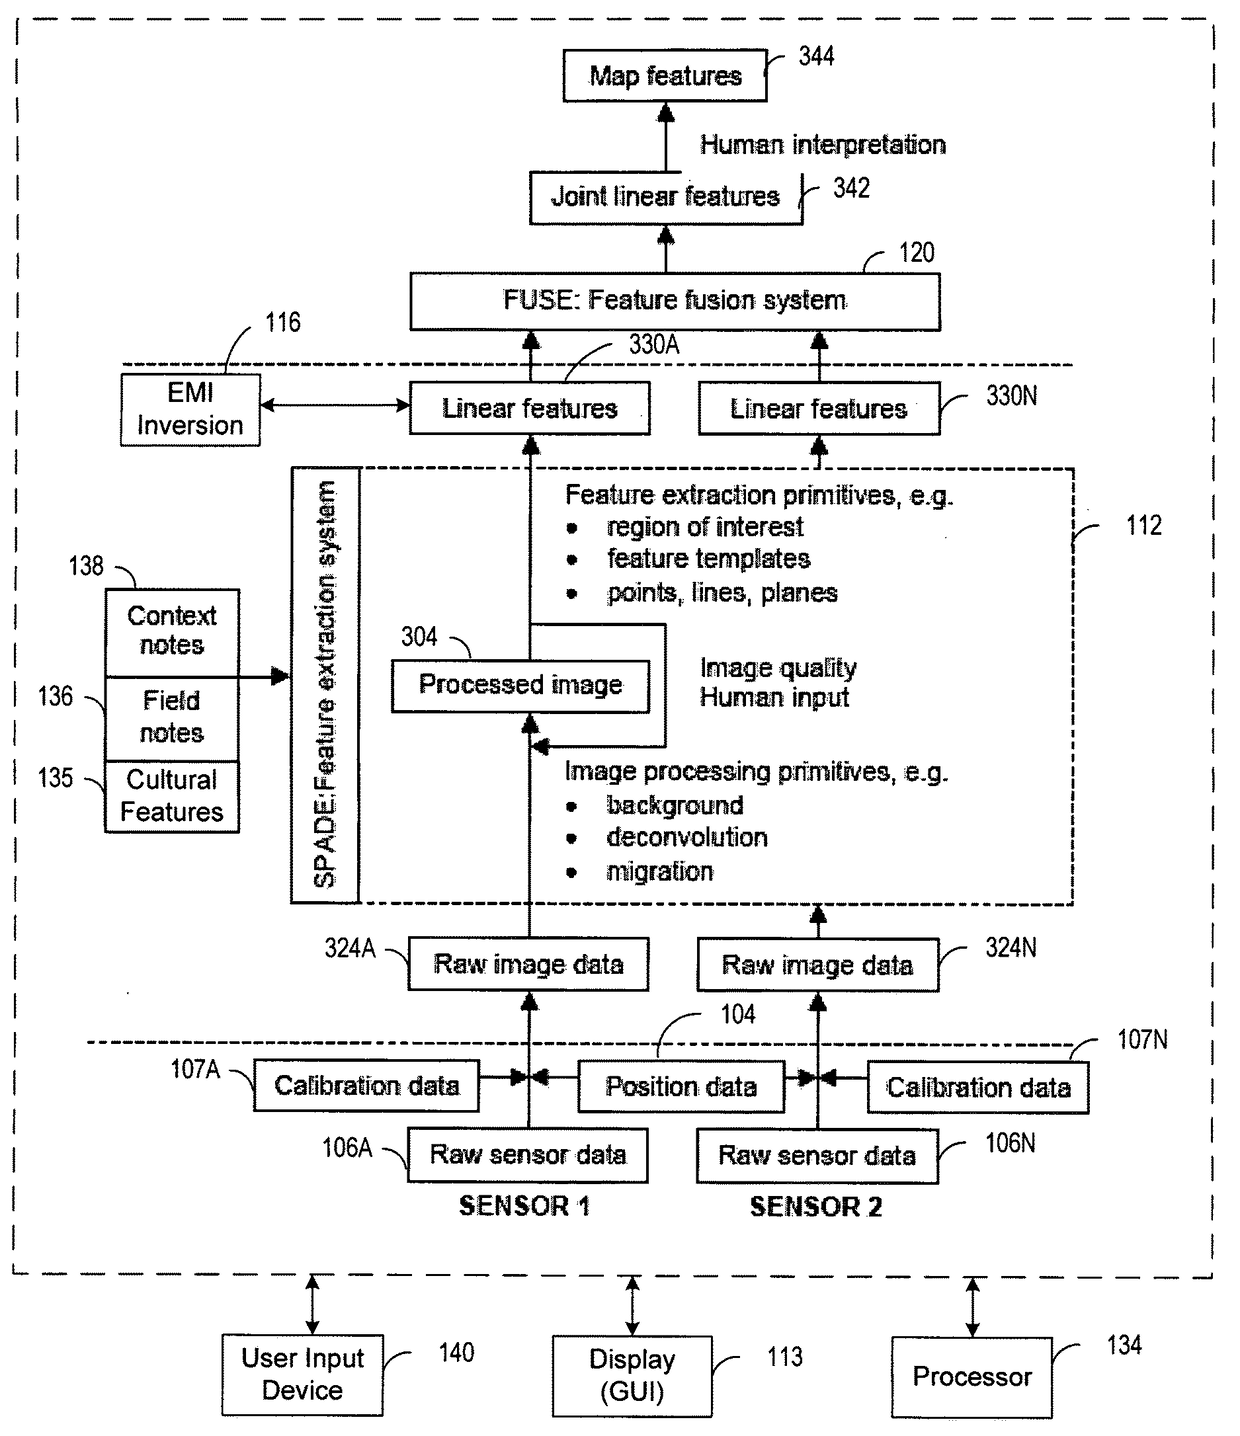
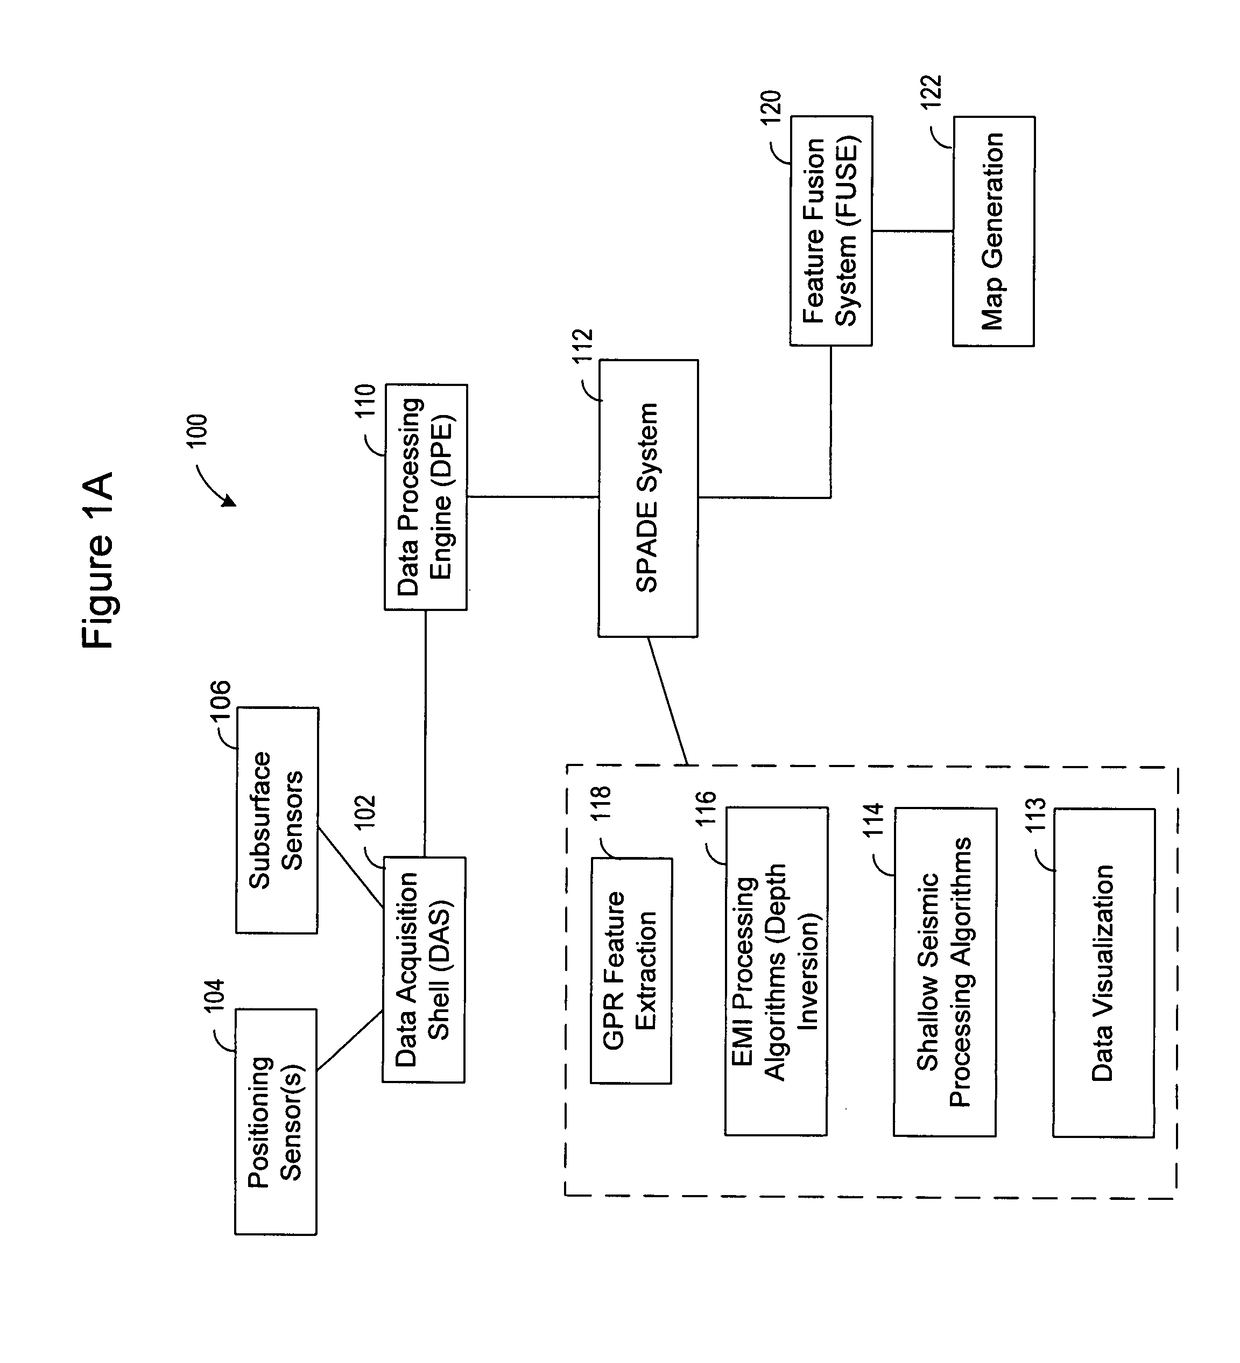
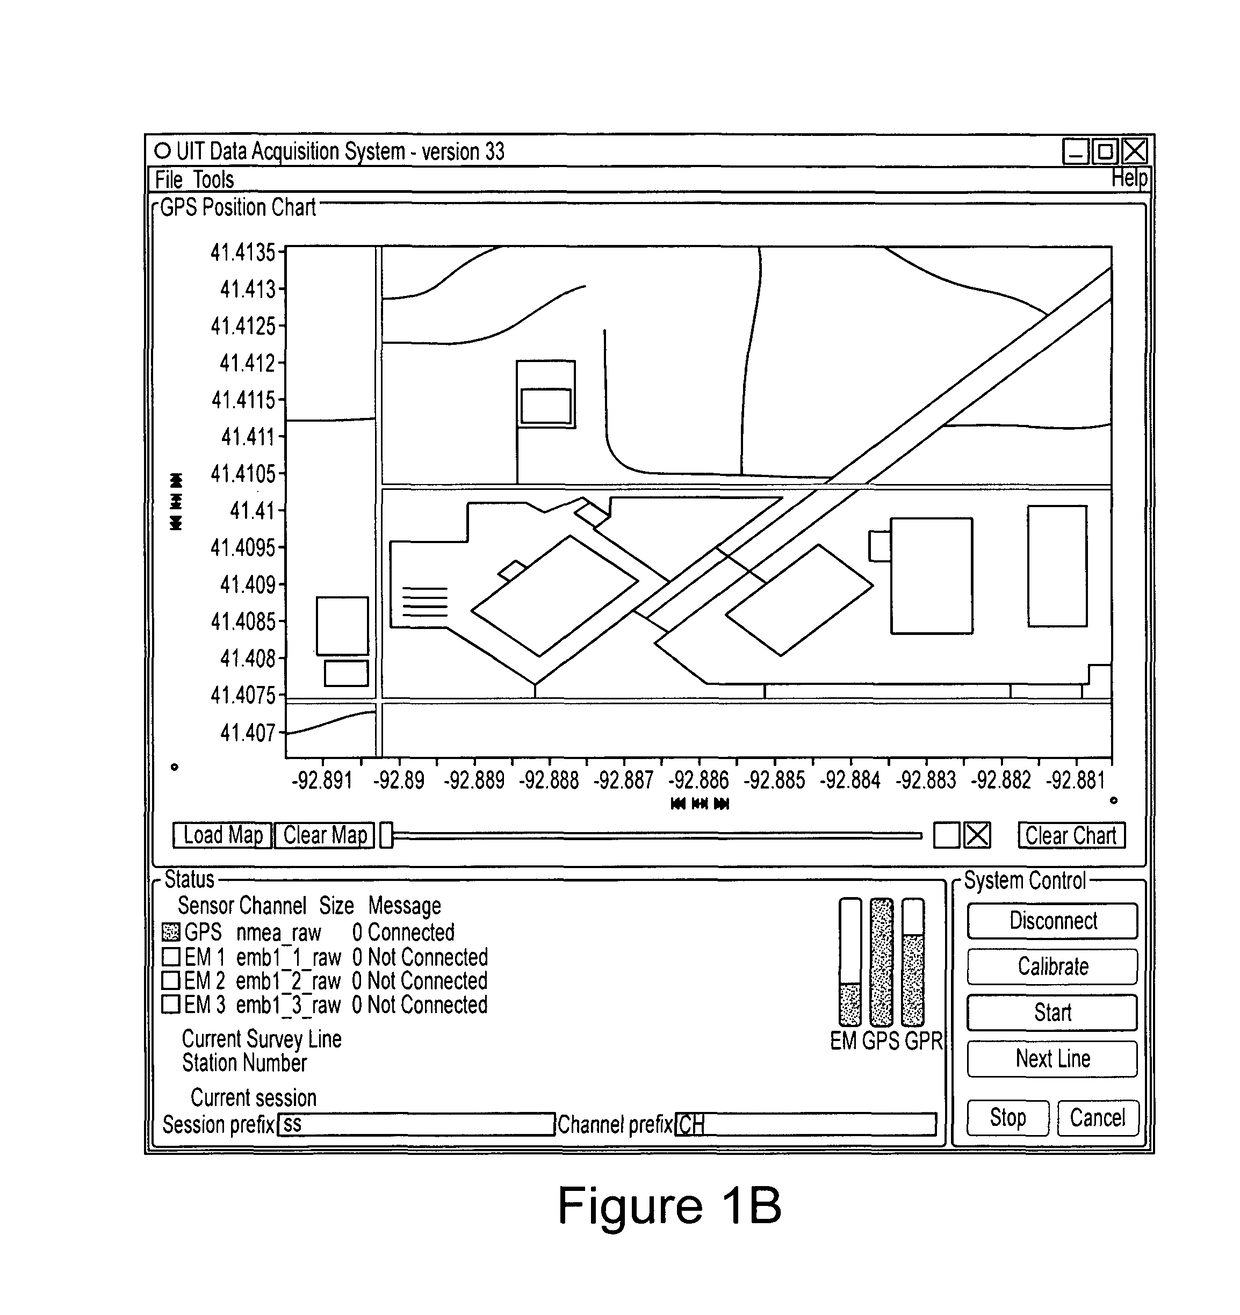
[0059]The present invention is directed to systems and methods for integrating and interpreting data acquired during subsurface imaging of a site. Aspects of the present invention are directed to enhanced data visualization tools that facilitate efficient and intuitive understanding of subsurface features, objects, utilities, and obstructions. Improved visualization quality is achieved by presenting data in a readily understandable format, and allows relationships between sensor data to be seen. All sensor data, field notes, CAD features, etc. are preferably presented in...


PUM


Abstract

A user interface includes a display for displaying of a plurality of sensor data sets representative of signals associated with a plurality of sensors configured for sensing of a subsurface. At least some of the sensors are configured for subsurface sensing in a manner differing from other sensors of the plurality of sensors. Each of the sensor data sets comprises sensor data samples each associated with geographic position data. The sensor data sets are shown overlaid within a volume depicted on the display. The graphical representations of the sensor data sets are individually viewable within the volume and displayed in geographical alignment relative to one another within the volume in accordance with the geographic position data of the sensor data samples of each of the sensor data sets.

Description

RELATED APPLICATION[0001]This application claims the benefit of Provisional Patent Application Ser. No. 60 / 800,874 filed May 16, 2006, to which priority is claimed pursuant to 35 U.S.C. §119(e) and which is hereby incorporated herein by reference.FIELD OF THE INVENTION[0002]The present invention relates generally to the field of underground utility and object detection, and, more particularly, to systems and methods for visualizing data acquired by a multiplicity of disparate sensors configured to acquire subsurface imaging and geophysical data.BACKGROUND OF THE INVENTION[0003]Various techniques have been developed to detect and locate underground utilities and other manmade or natural subsurface structures. It is well understood that before trenching, boring, or otherwise engaging in invasive subsurface activity to install or access utilities, it is imperative to know the location of any existing utilities and / or obstructions in order to assist in trenching or boring operations and...

Claims


Application Information

Patent Timeline
Patent Type & Authority Patents(United States)
IPC IPC(8): G06T17/05G06K9/00G06K9/62G06V20/13
CPCG06T17/05G06K9/0063G06K9/6253G06V20/13G06V10/945G06F18/40
Inventor HANSONSJOSTROM, KEITH JEROMEJONES, ROSS PETERKELLY, PETER JOHN
Owner UNDERGROUND IMAGING TECH
Why Eureka
Try Eureka