3D segmentation by voxel classification based on intensity histogram thresholding intialised by K-means clustering

一种聚类、体素的技术,应用在图像分析、涉及3D图像数据的细节、图像增强等方向,能够解决不能聚类数据等问题

Active Publication Date: 2009-09-23
KONINK PHILIPS ELECTRONICS NV
View PDF0 Cites 5 Cited by
  • Summary
  • Abstract
  • Description
  • Claims
  • Application Information

AI Technical Summary

Problems solved by technology

On the one hand, treatment planning must not be based on improperly arranged clustered data, and on the other hand, complex approaches will not be acceptable in the clinical setting

Method used


Image

  • 3D segmentation by voxel classification based on intensity histogram thresholding intialised by K-means clustering
  • 3D segmentation by voxel classification based on intensity histogram thresholding intialised by K-means clustering
  • 3D segmentation by voxel classification based on intensity histogram thresholding intialised by K-means clustering

Examples


Embodiment Construction

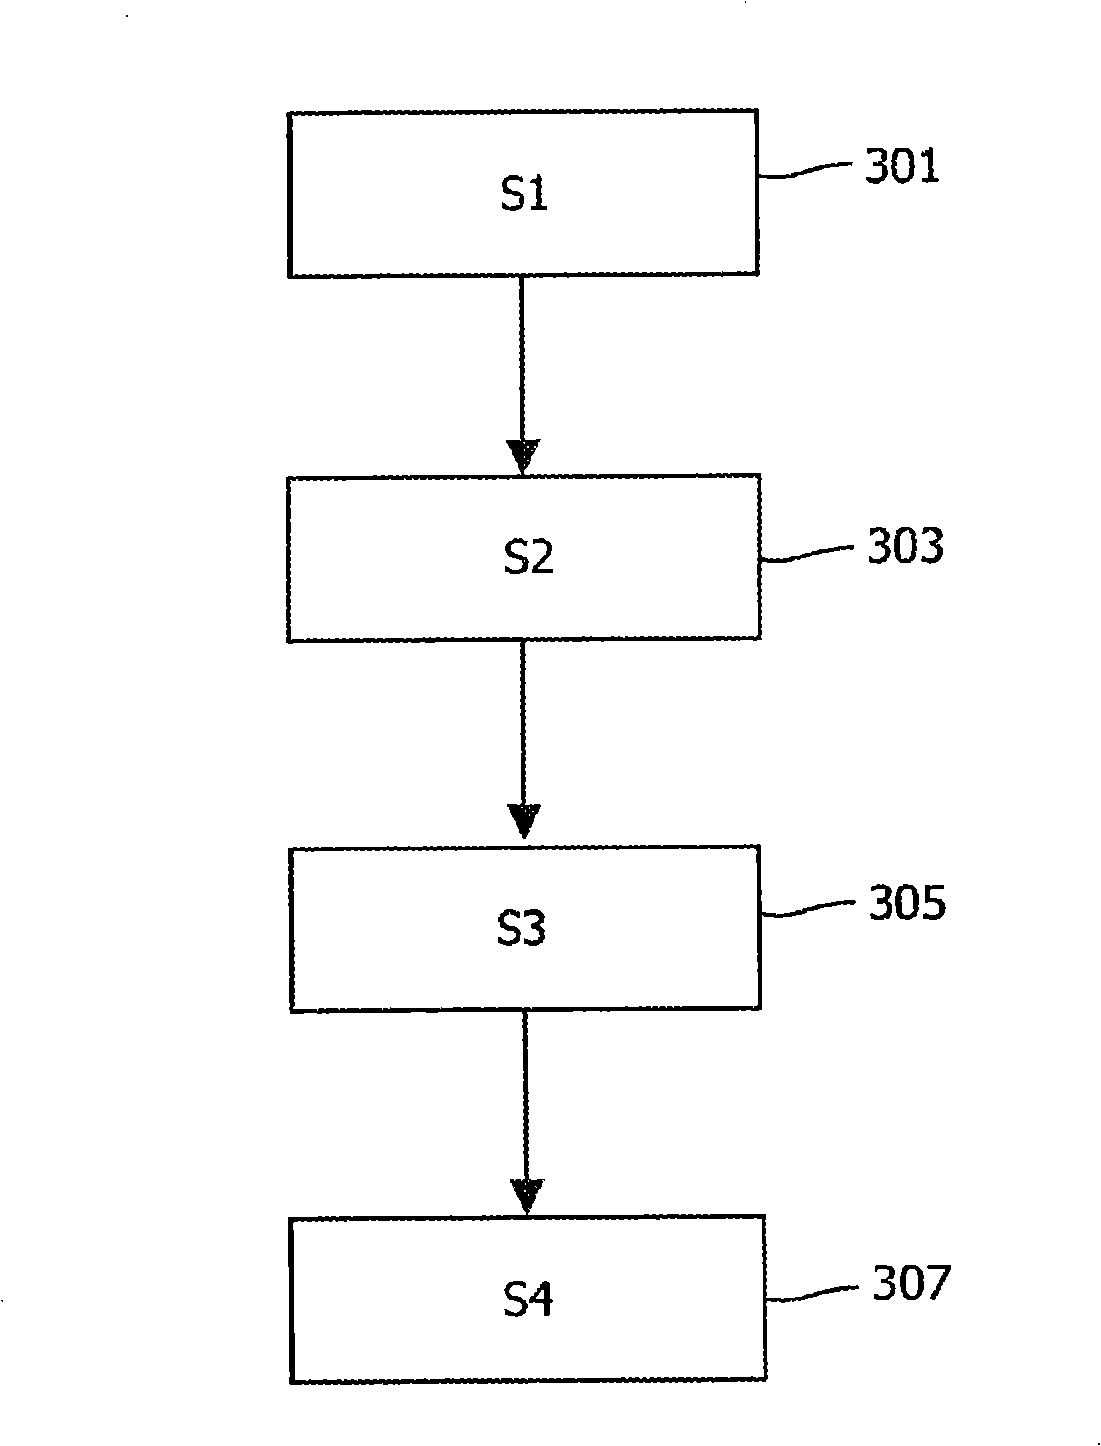
[0029] image 3 A flowchart is shown illustrating a method for interactively evaluating and rearranging a cluster map of voxels in an image in accordance with the present invention.

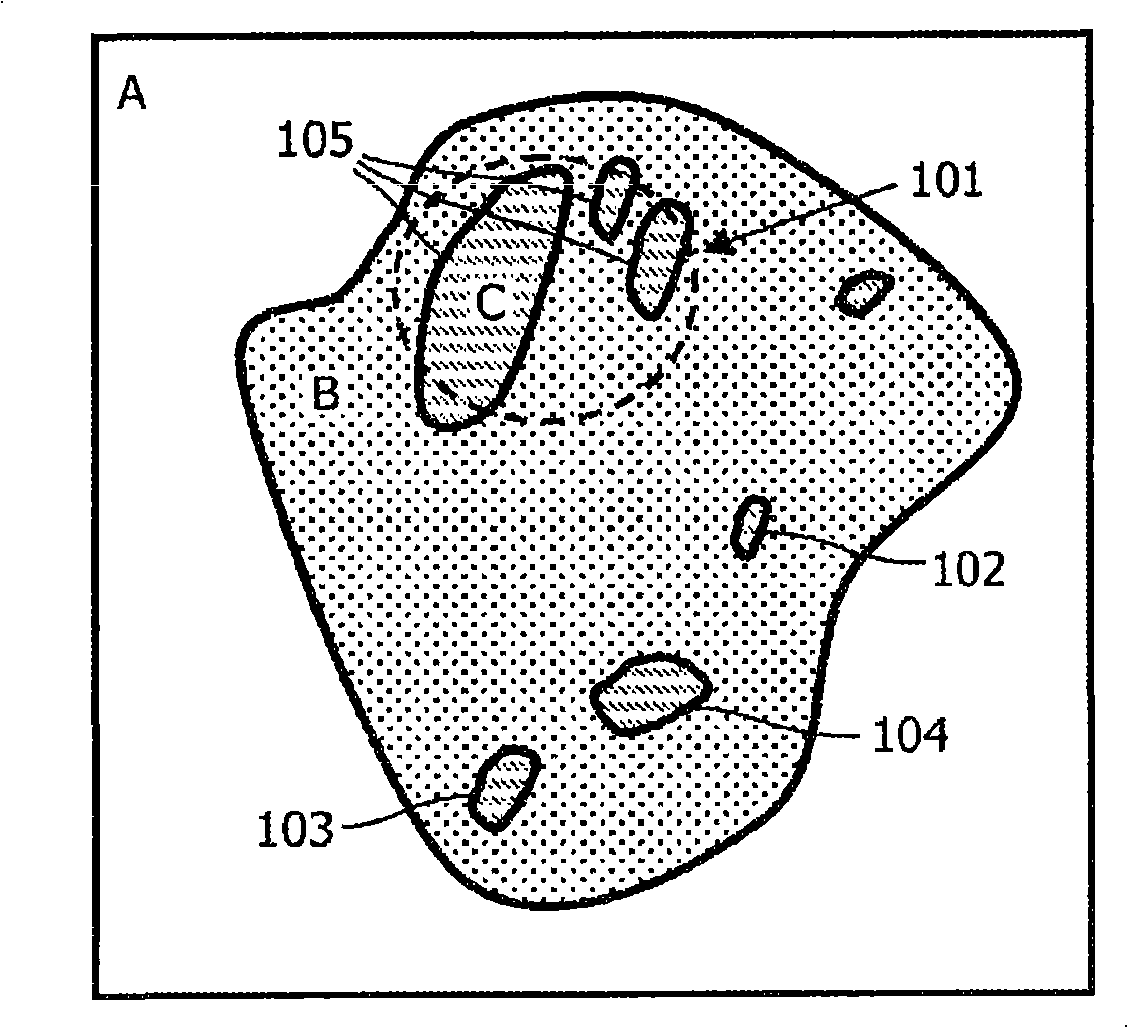
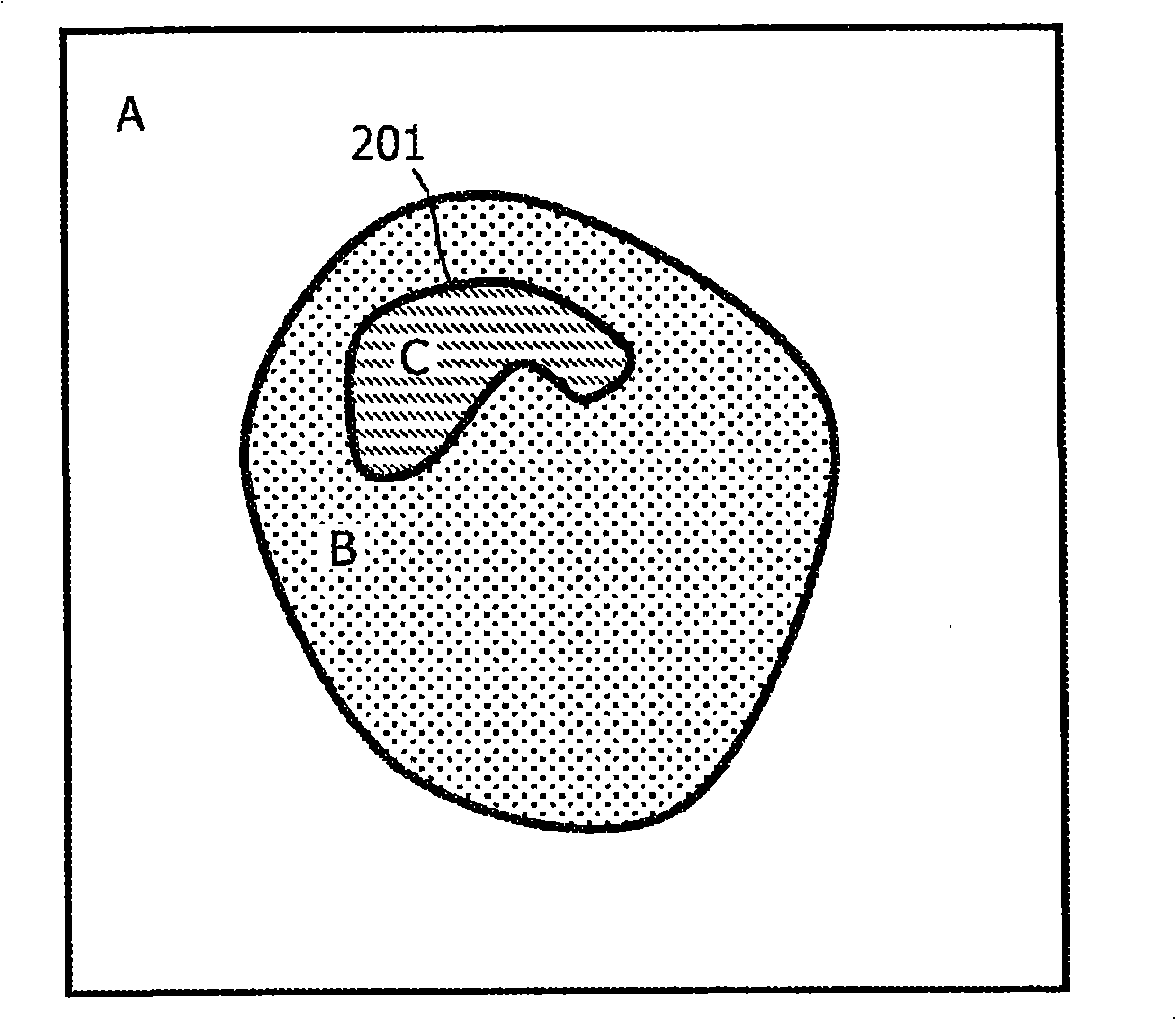
[0030] Such clustering graphs are realized by clustering algorithms such as K-means, QT clustering, fuzzy c-means clustering and other types of algorithms already mentioned in the literature, See Milan Sonka and J. Michael Fitzpatrick, Handbook of Medical Imaging, Volume 2. As previously mentioned in the background, implementing a cluster map by such an algorithm typically results in fragmented clusters 105 ( figure 1 shown in region 101) and separate clusters 102-104. like figure 1 The clusters shown are voxels that share some common property, usually based on proximity, ie a predefined distance metric. The areas labeled A, B, and C are clustering levels, where each clustering level is assigned a specific color, e.g. A might be black, B might be blue, and C might be red.

[0031]For example...


PUM


Abstract

This invention relates to rearranging a cluster map of voxels in an image aiming at the reduction of sub-cluster scatter. The cluster map that includes two or more cluster levels is displayed to the user along with the distribution of the voxels within each respective cluster levels. The aim is to enable the user to evaluate the quality of the cluster map and based on the evaluation to change thedistribution of the voxels. Such a change in the distribution will result in an update of the cluster map. the application discloses a method of segmentation of e.g. medical images (CT,MR) in 3D by clustering of the voxels according to their Intensities with repeated re- initalization realized by multi-thresholding of the intensity histogram.

Description

technical field [0001] The present invention relates to a method and apparatus for evaluating and rearranging a clustermap of voxels in an image. Background technique [0002] Clustering algorithms group similar regions in an image. Clustering is usually achieved by defining regions where adjacent voxels have similar values. These voxels are then combined to form clusters, see D.L. Pham et al. "Current Methods in Medical Imaging", Annu. Rev. Biomed. Eng. 2000.02:315-37. Thus, a cluster map reduces the quasi-continuous values ​​of the original image to a smaller number of levels, thereby forming a cluster map. this is in figure 1 This figure shows an example of three clustering levels (ie, clustering levels A, B, and C). The resulting graphs can be displayed individually or superimposed on the original topological data, refer to A.T.Agoston et al. "Intensity-modulatedparametric mapping for simultaneous display of rapid dynamic and high-spatial-resolution breast MR imaging...

Claims


Application Information

Patent Timeline
Patent Type & Authority Applications(China)
IPC IPC(8): G06T5/00G06K9/00G06V10/28G06V10/762
CPCG06T2207/30004G06K9/6218G06T7/0087G06T7/0081G06K9/38G06T2207/20148G06T2200/04G06T2207/10072G06T2207/20036G06K9/033G06T7/11G06T7/143G06T7/136G06V10/987G06V10/28G06V10/762G06F18/23
Inventor M·C·文格勒A·菲舍尔
Owner KONINK PHILIPS ELECTRONICS NV
Why Eureka
Try Eureka