
Method (Ip) for evaluating properties of reservoir based on gas survey logging data

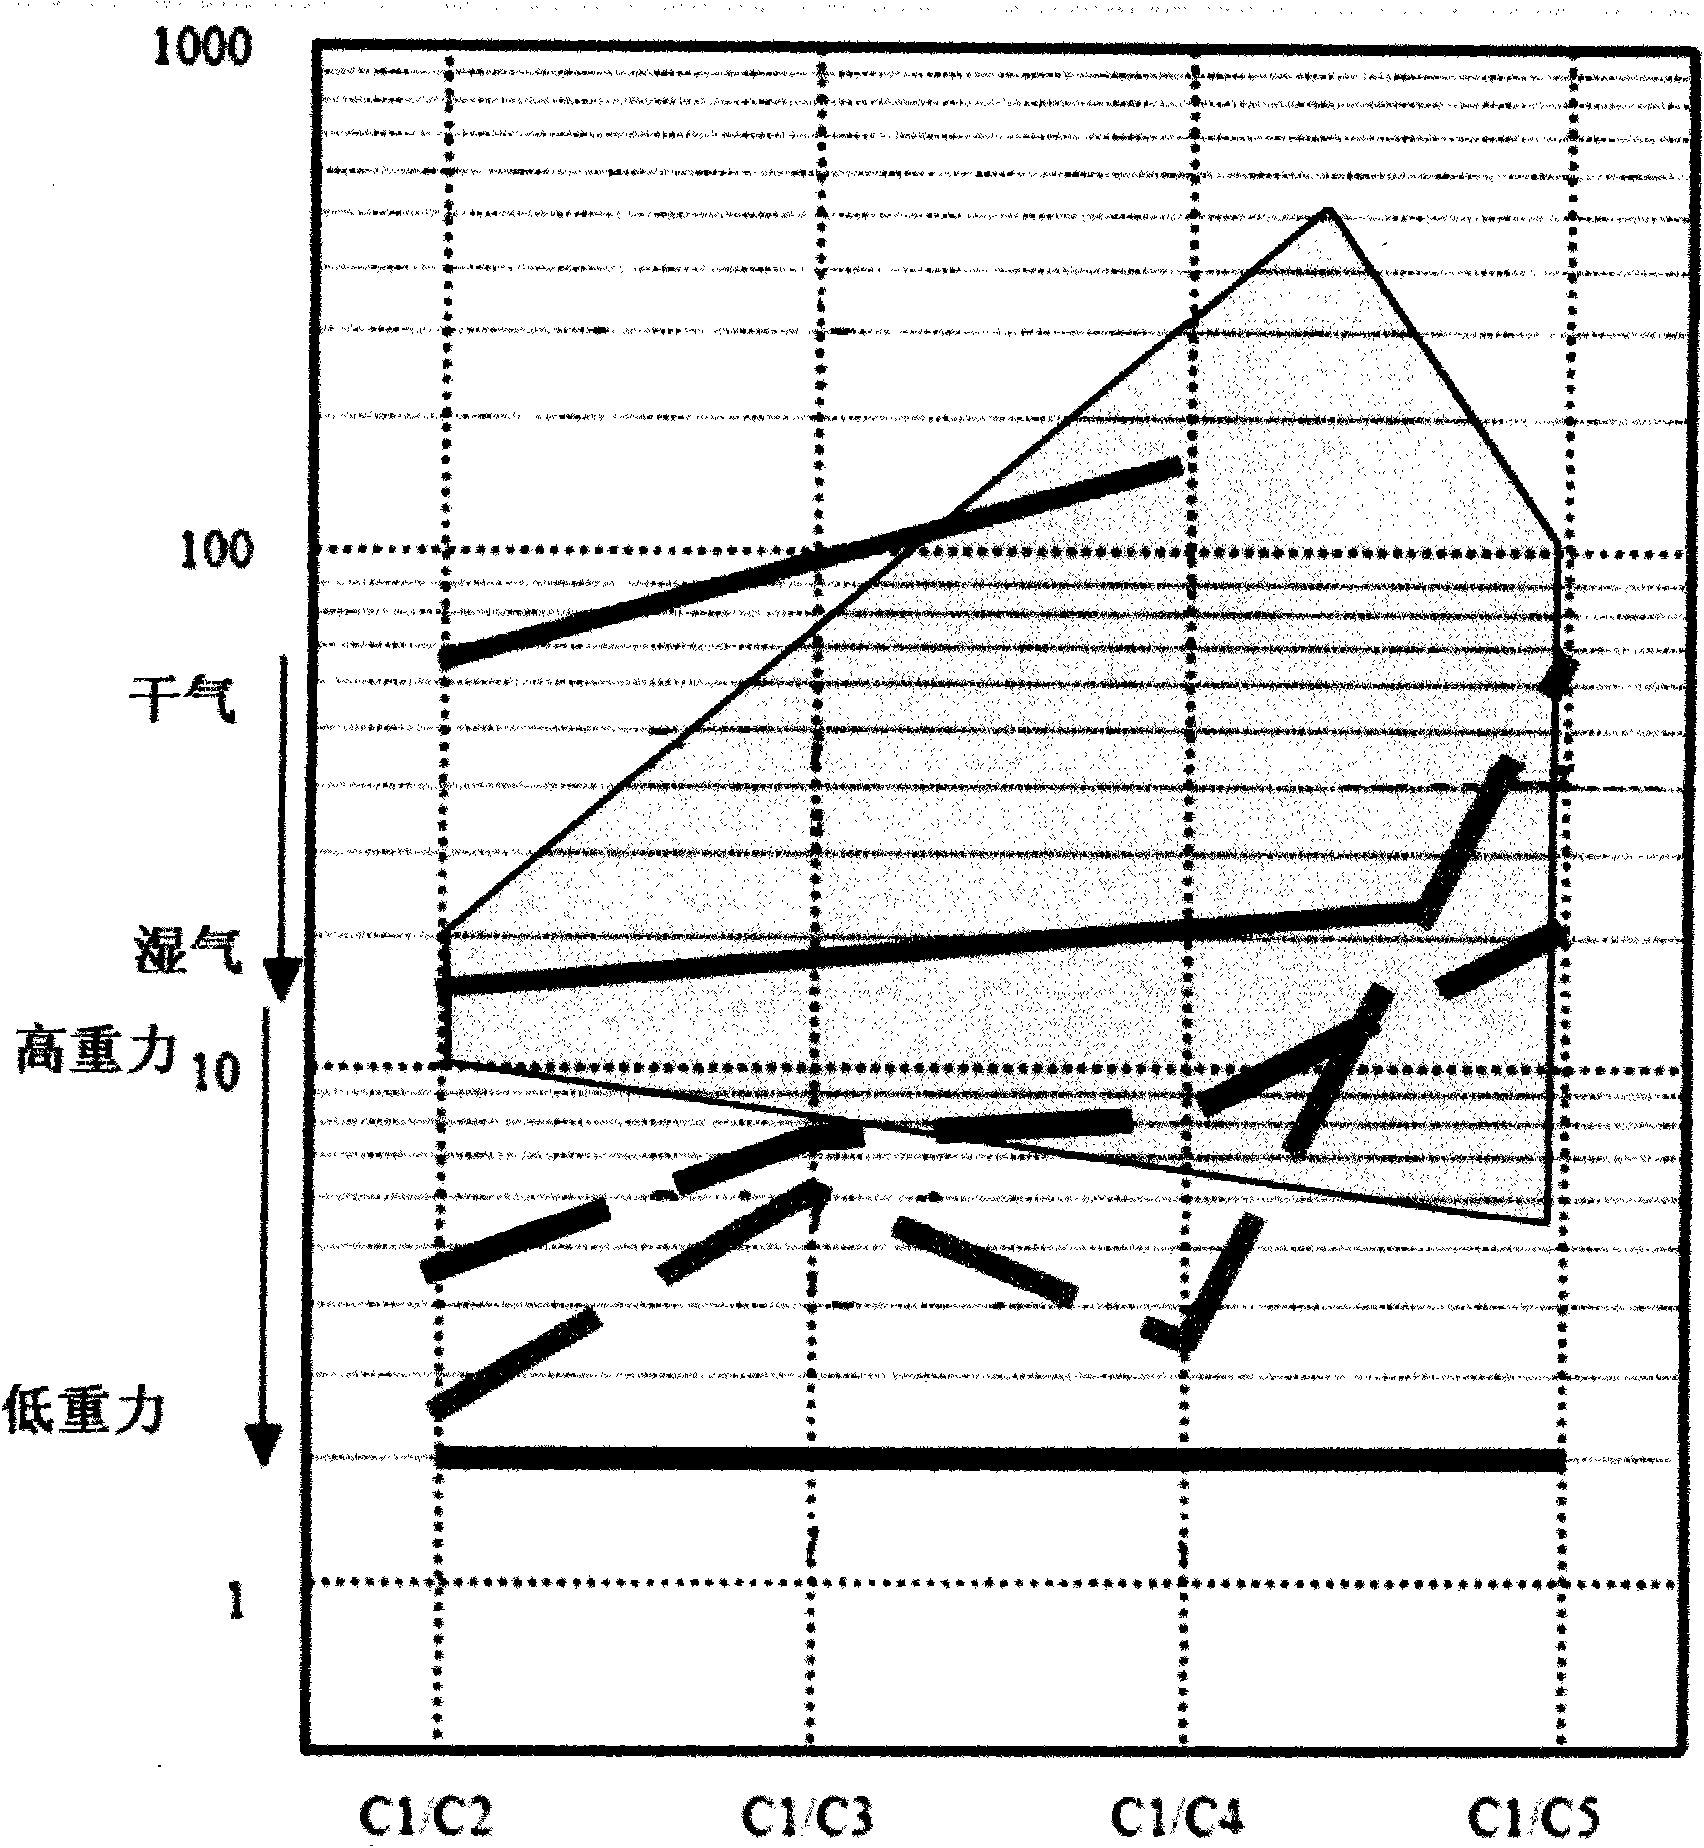
A gas logging and data technology, which is applied in the field of gas logging and logging technology data processing, can solve problems such as inability to form maps, inability to use joint evaluation of reservoirs, and inability to quantitatively evaluate reservoir properties, etc., and achieve the effect of facilitating judgment.

Inactive Publication Date: 2012-01-11
CNPC GREATWALL DRILLING ENG
View PDF0 Cites 15 Cited by
  • Summary
  • Abstract
  • Description
  • Claims
  • Application Information

AI Technical Summary

Problems solved by technology

[0011] The traditional Pixler method can only use single-point data for fixed chart analysis, which belongs to the visual display method of qualitative charts. Although it can be displayed visually, it cannot be continuously mapped corresponding to the well depth
Cannot quantitatively evaluate reservoir properties, and cannot be used to jointly evaluate reservoirs with other reservoir parameters

Method used


Image

  • Method (Ip) for evaluating properties of reservoir based on gas survey logging data
  • Method (Ip) for evaluating properties of reservoir based on gas survey logging data
  • Method (Ip) for evaluating properties of reservoir based on gas survey logging data

Examples


Embodiment Construction

[0046] like figure 2 , image 3 , Figure 4 As shown, 1) define the Ip series index

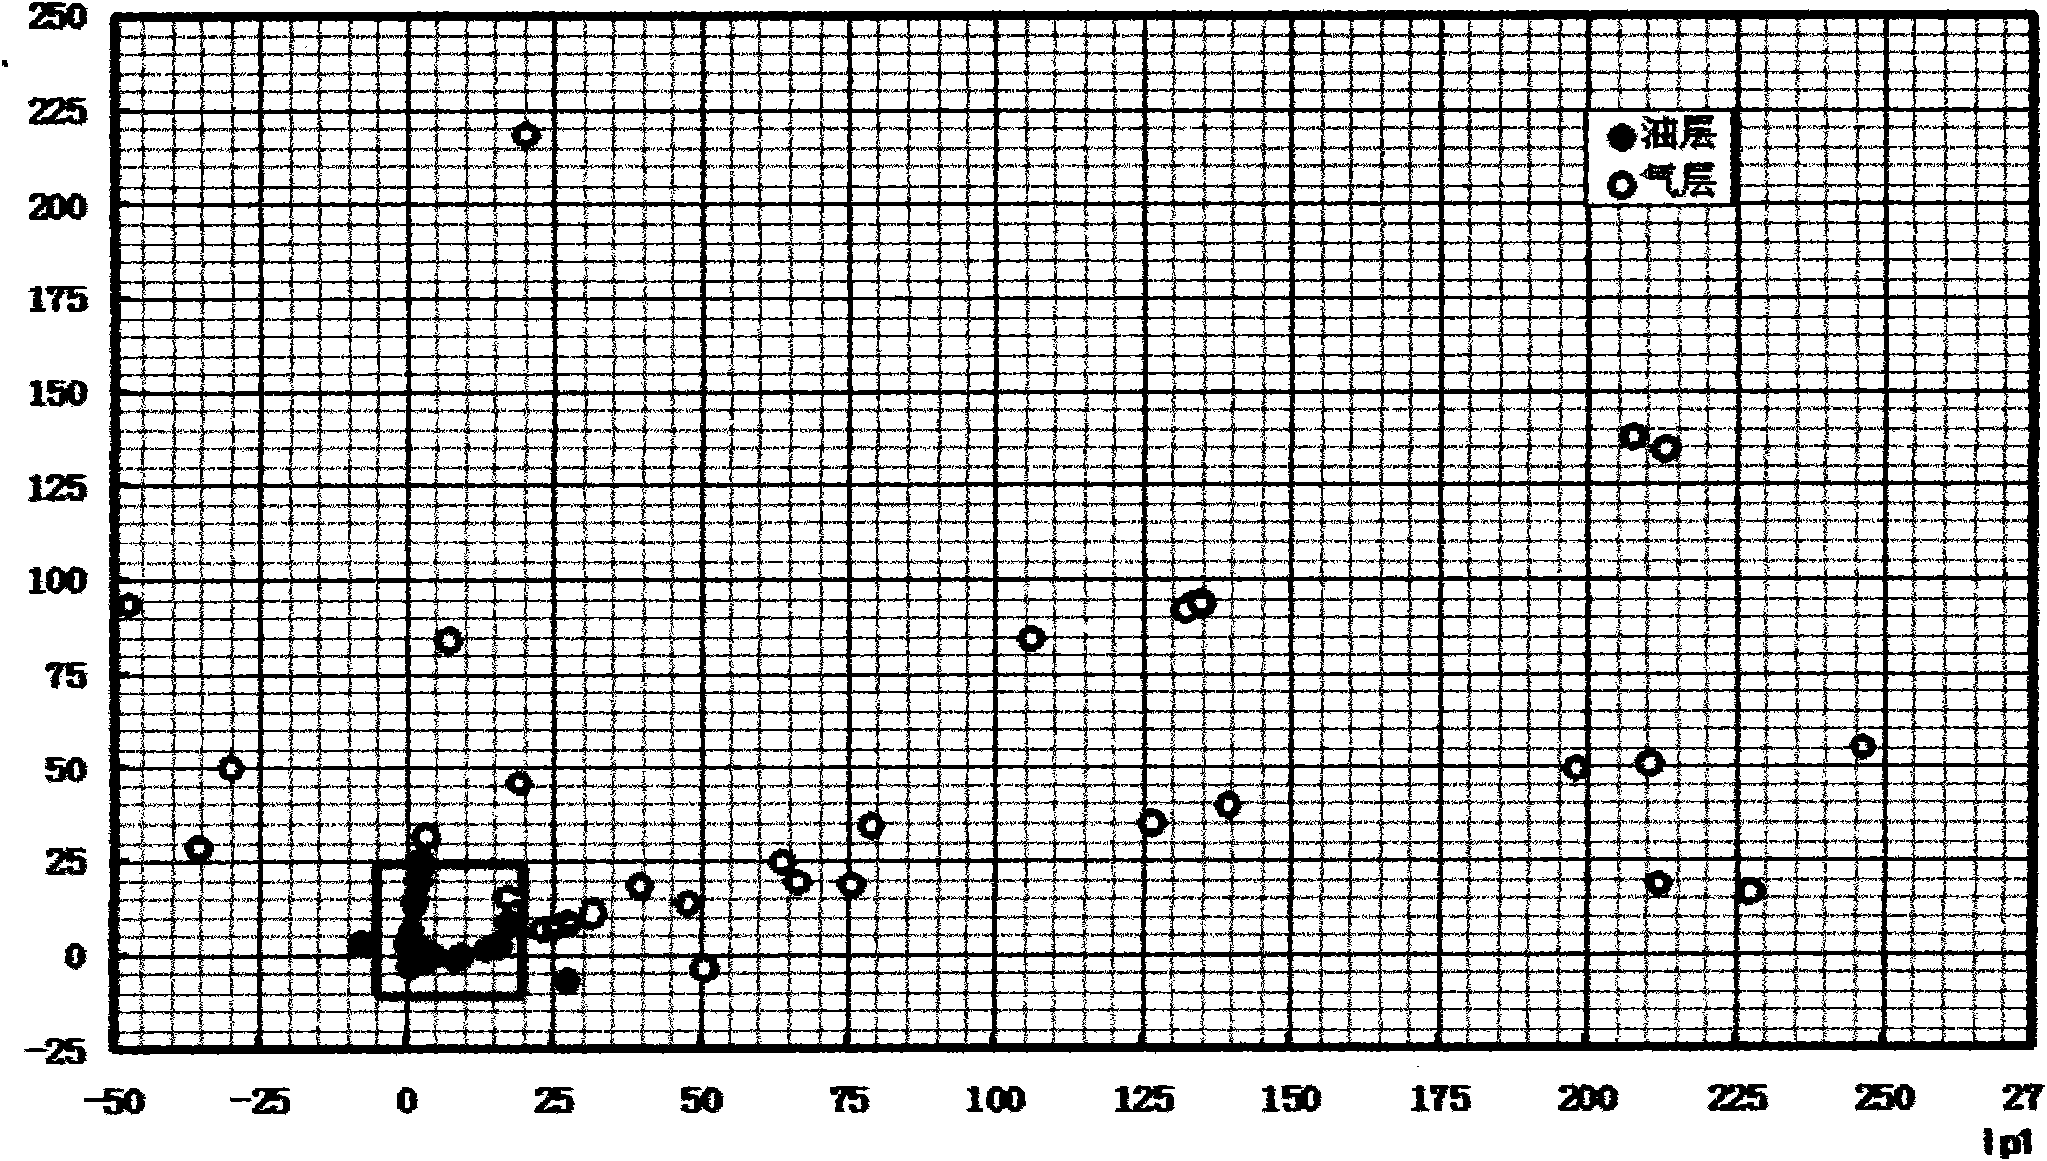
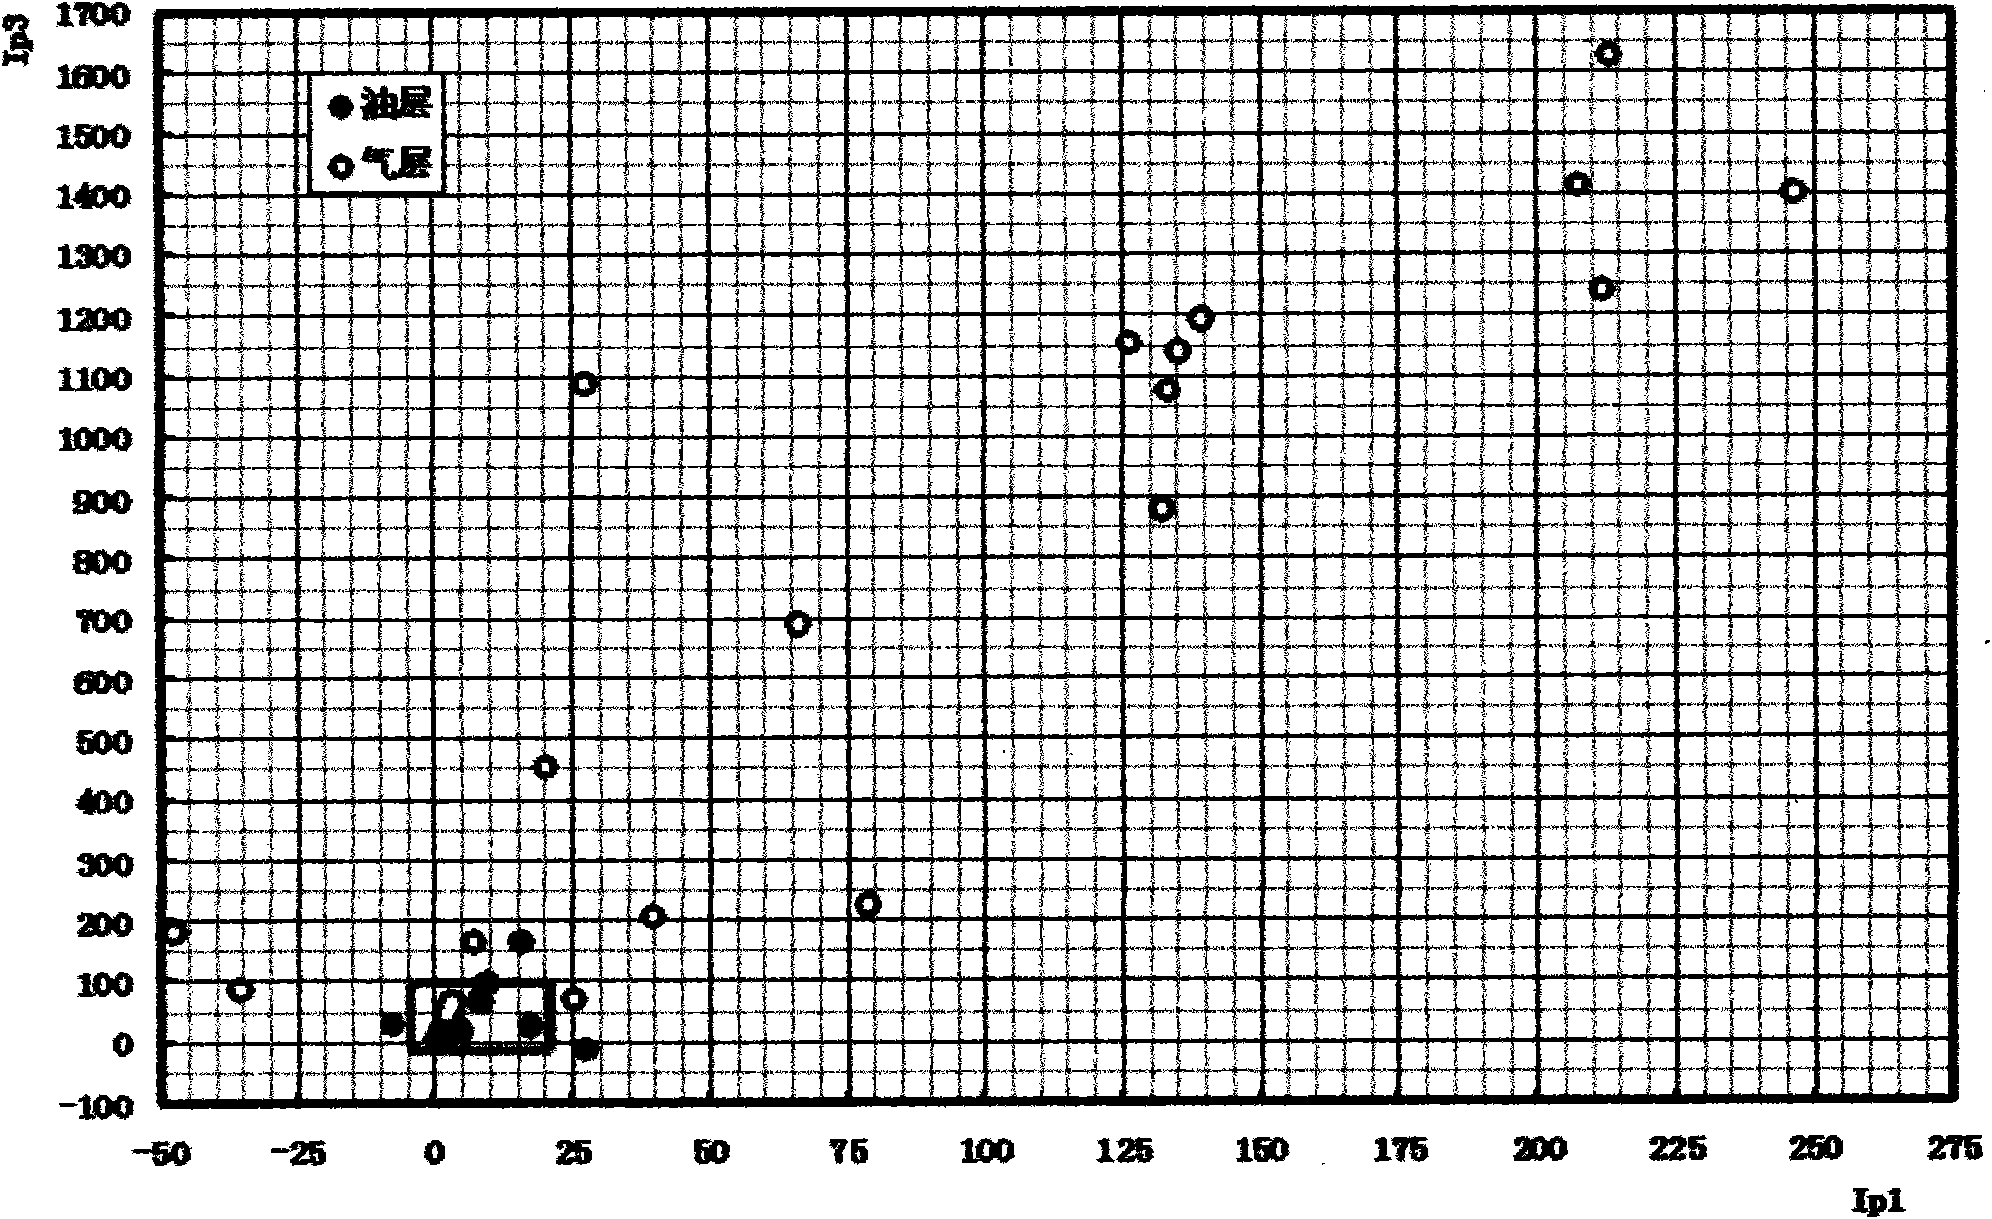
[0047] The present invention expands the use method of the Pixler drawing board, and defines the Ip series index of the reservoir property characterization index: the Ip series index is the difference between the ratio characteristics of C1 and C2, C3, C4, and C5,

[0048] Ip 1 = ( C 1 C 4 ) - ( C 1 C 3 )

[0049] Ip 2 = ( C 1 C 3 ) - ( ...


PUM


Abstract

The invention discloses a method (Ip) for evaluating the properties of a reservoir based on gas survey logging data. The method comprises the following steps of: 1) defining Ip series indexes; 2) making an Ip cross plot, and counting data points in the chart of the Ip series indexes; and 3) drawing an explanatory drawing by the Ip series indexes corresponding to a well depth. In conclusion, the technical problem to be solved by the invention is to provide a novel method for explaining the properties of a gas ratio reservoir based on the gas survey logging data; an original Pixler chart method is greatly reformed; novel evaluation indexes are calculated; a novel explanatory chart is established; and a drawing application form is explained. The quantized Ip series indexes can be combined with other gas survey parameters and even with logging parameters, thereby being flexible in use and providing convenience for the evaluation of a hydrocarbon reservoir.

Description

technical field [0001] The invention relates to a method for evaluating properties of oil and gas reservoirs based on gas component ratios using gas logging data. The invention belongs to the field of gas logging technology data processing. Background technique [0002] Pixler published in 1969 the results of a study using light hydrocarbon data to judge reservoir properties. The properties of reservoirs are divided into three different types: gas layers, oil layers and non-producing layers. They have different characteristics of C1 / C2, C1 / C3, and C1 / C4 ratio characteristics. According to the above four ratio characteristics, the formation can be deduced Pore ​​fluid types and properties. Pixler method interpretation can often be performed using a drawing board. The drawing board is divided into four areas: residual oil or non-productive oil area, oil-producing area, gas-producing area, and non-productive gas-producing area. [0003] Pixler's Method Explanation Board as ...

Claims


Application Information

Patent Timeline
IPC IPC(8): E21B49/00
Inventor 余明发
Owner CNPC GREATWALL DRILLING ENG
Learn More