Dynamic visualization method of island reefs based on tidal process

A technology of tides and islands, which is applied in the field of dynamic visualization of islands and reefs based on tide levels, and can solve problems such as insufficient display of dynamic tidal processes

Inactive Publication Date: 2013-08-21
INST OF GEOGRAPHICAL SCI & NATURAL RESOURCE RES CAS
View PDF1 Cites 12 Cited by
  • Summary
  • Abstract
  • Description
  • Claims
  • Application Information

AI Technical Summary

Problems solved by technology

[0007] The technical solution of the present invention is to provide a dynamic visualization method for islands and reefs based on tidal processes, the purpose of which is to solve the problem of insufficient display of dynamic tidal processes by existing ocean map visualization methods, and to improve the representation of islands and reefs in terms of time and space Accuracy, to dynamically display the changes in the shape of exposed water on islands and reefs during the tide process

Method used


Image

  • Dynamic visualization method of island reefs based on tidal process
  • Dynamic visualization method of island reefs based on tidal process
  • Dynamic visualization method of island reefs based on tidal process

Examples


specific Embodiment approach

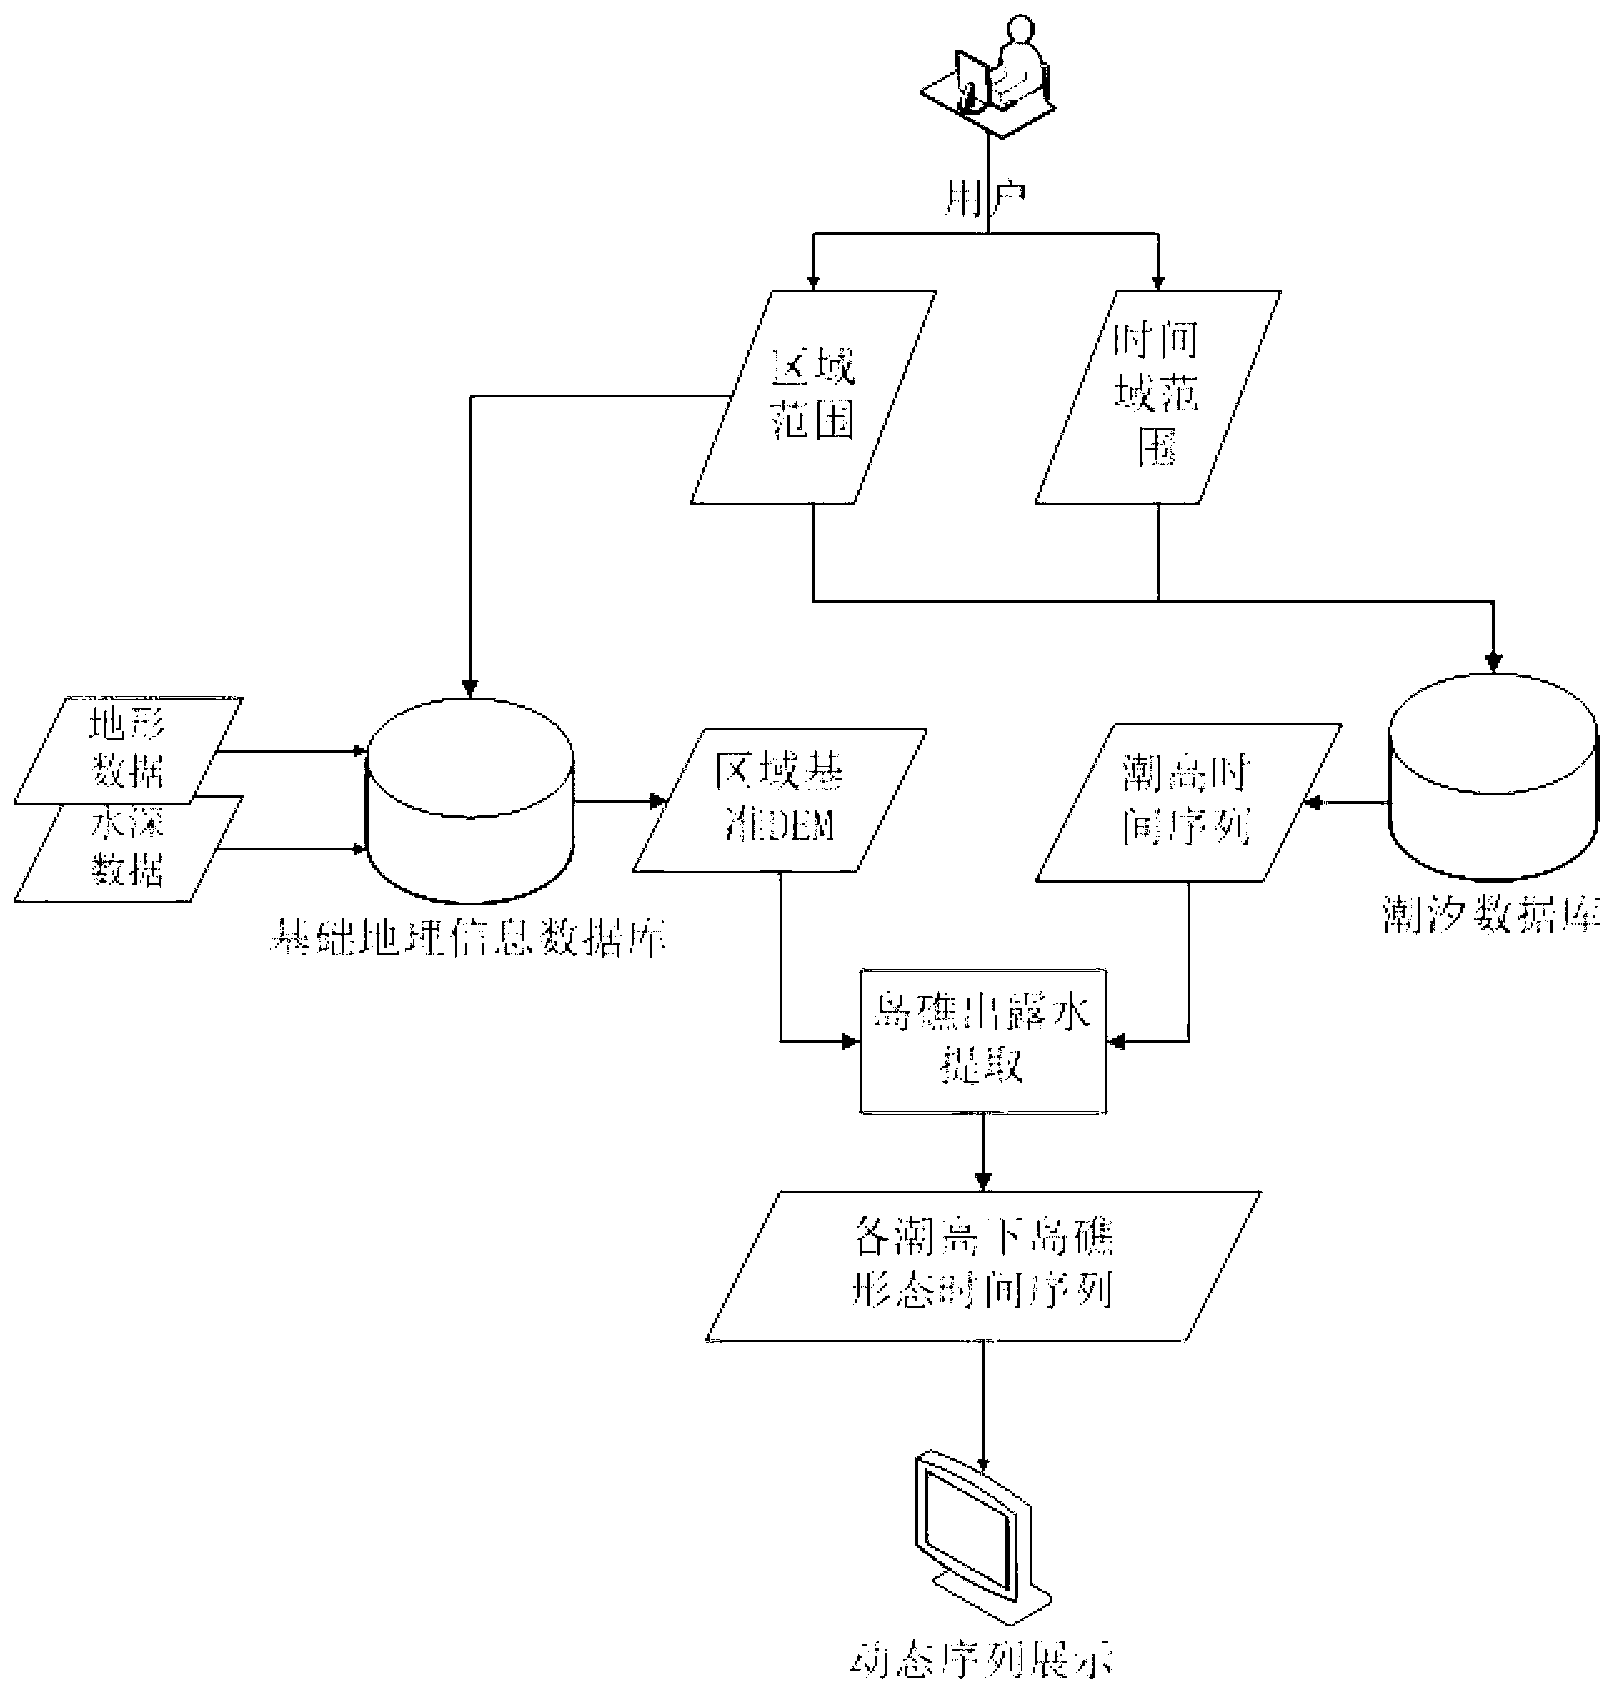
[0024] Such as figure 1 Shown, the specific implementation mode of the inventive method is as follows:

[0025] (1) Construct DEM using contour lines, elevation control points, contour lines, and water depth points;

[0026] a) Negative value processing is performed on the water depth data (isobath, water depth point), that is, the water depth value is changed from positive to negative to generate an absolute altitude value;

[0027] b) Use the elevation data of the land and seabed, and use the popular contour interpolation algorithm to generate DEM;

[0028] (2) According to the area selected by the user, use the terrain extraction module to search and select the DEM of the corresponding area in the basic geographic information database. Here, Nanyao Island in the Nansha Islands is taken as an example. Nanyao Island is located at 114°25'25" E, 10°40'04"N, eg figure 2 The three-dimensional display of DEM of Nanyao Island is shown;

[0029] (3) According to the area and ti...


PUM


Abstract

A dynamic visualization method of island reefs based on the tidal process is characterized in that according to an area and a time domain set by a user, data such as terrain and the depth of water in a corresponding area are extracted from fundamental geographical information database, the DEM of the area is obtained or generated, time series of tide height absolute elevation in a certain period are generated according to a tidal table of the area and the time domain, exposing forms of the island reefs with different heights of tide are respectively extracted from the DEM and are combined according to the time series, and exposing situations of the island reefs with different tide levels are shown dynamically.

Description

technical field [0001] The invention belongs to the field of marine map drawing, in particular to a dynamic visualization method for islands and reefs based on tide levels. technical background [0002] All kinds of islands in the ocean, especially coral reef islands, are affected by ocean tides, and the shape and area of ​​the exposed water surface are very different at different tidal levels. Some are even completely or partially submerged at high tide, while low tide exposed in whole or in part. However, the existing ocean map visualization methods, especially those involving islands or reefs, do not fully consider the influence of ocean tides, and cannot clearly represent the temporal and spatial changes of islands and reefs. The existing visualization methods for islands and reefs have the following problems: [0003] (1) The visual expression is too general and not precise enough [0004] The current ocean maps mostly use simple symbols to represent the approximate b...

Claims


Application Information

Patent Timeline
Patent Type & Authority Applications(China)
IPC IPC(8): G06T17/05G06T13/00G06F17/30
Inventor 苏奋振石伟周成虎
Owner INST OF GEOGRAPHICAL SCI & NATURAL RESOURCE RES CAS
Why Eureka
Try Eureka