Automatic defect detection and identification method for ECPT (eddy current pulsed thermography)

A pulsed eddy current and automatic detection technology, applied in the direction of material defect testing, etc., can solve the problems of wrong judgment of defect quantity, loss of data information, inaccurate detection and positioning, etc., and achieve the effect of automatic and accurate defect detection and automatic and accurate detection

Inactive Publication Date: 2014-02-19
UNIV OF ELECTRONIC SCI & TECH OF CHINA
5 Cites 32 Cited by

AI-Extracted Technical Summary

Problems solved by technology

[0003] At present, ECPT’s detection and characterization of conductor material defects is still limited to the artificial selection of frame images recorded by thermal imaging cameras to i...

Abstract

The invention discloses an automatic defect detection and identification method for ECPT (eddy current pulsed thermography). The automatic defect detection and identification method comprises steps as follows: a thermal image video is acquired through the ECPT, vectorization is performed, and a new matrix is reconstructed; and principle component analysis and independent component analysis are performed on the new matrix to generate a hybrid matrix and an independent component matrix, column vectors of the hybrid matrix are normalized, locations of the maximums of the column vectors are calculated, an independent component row vector corresponding to the foremost hybrid matrix column vector is selected and converted into a matrix according to original thermal image size so as to position and identify a defect. The automatic defect detection and identification method is combined with an ECPT nondestructive testing physical principle to construct a single-channel blind source separation model and is used for automatic defect detection and identification of a conductor material. The technology can process the ECPT thermal image video directly without manual selection of thermal image or pixel features, so that loss of mass data information is avoided, and the defect can be positioned automatically and accurately.

Application Domain

Material flaws investigation

Technology Topic

Column vectorNondestructive testing +7

Image

  • Automatic defect detection and identification method for ECPT (eddy current pulsed thermography)
  • Automatic defect detection and identification method for ECPT (eddy current pulsed thermography)
  • Automatic defect detection and identification method for ECPT (eddy current pulsed thermography)

Examples

  • Experimental program(1)

Example Embodiment

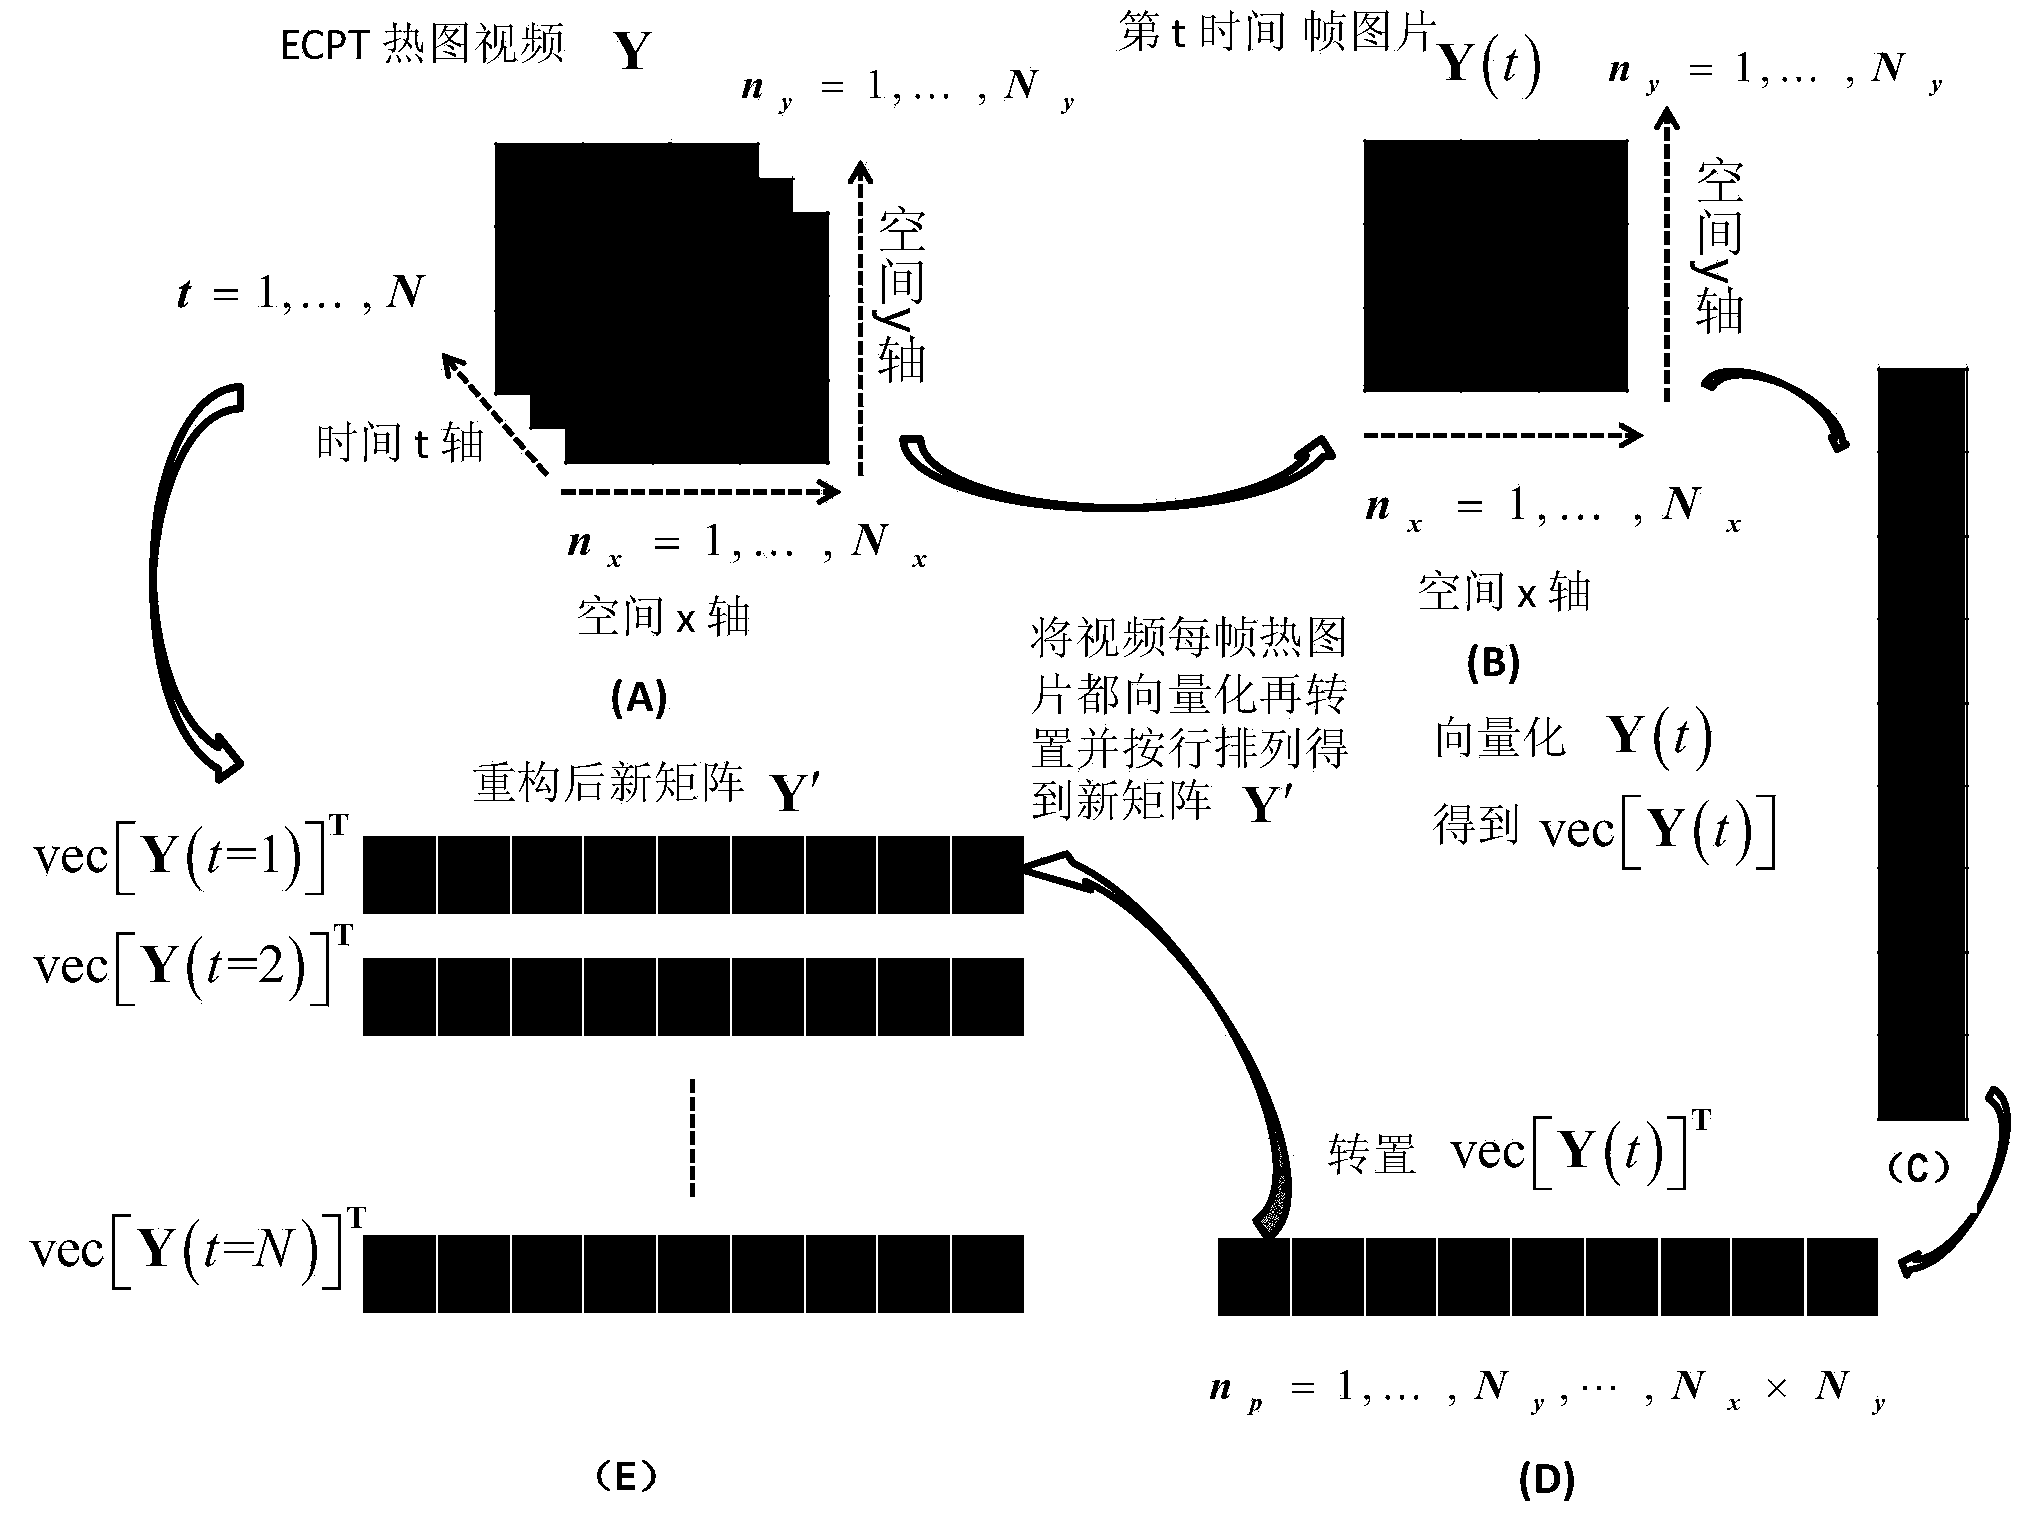
[0016] The specific embodiments of the present invention are described below in conjunction with the accompanying drawings, so that those skilled in the art can better understand the present invention. It should be particularly noted that in the following description, when detailed descriptions of known functions and designs may dilute the main content of the present invention, these descriptions will be omitted here.
[0017] When the conductor material has defects (such as cracks), under the action of ECPT, the eddy current distribution of the defect position under electromagnetic induction is different. When the eddy flow path is at the defect (such as a crack), the eddy flow path will change accordingly, and various eddy current density distribution areas are formed near the crack. The two ends of the crack will form a concentrated area of ​​electric eddy current density, and the two sides of the crack will form an electric eddy current density scattered area. Due to Joule heating, the eddy current density distribution will be directly reflected in the formation of various temperature distribution areas near the crack. For example, temperature concentration areas will be formed at both ends of the crack, and the sample area far away from the excitation coil will also be affected by the heat dissipation of the coil induction area. The temperature distribution area near the defect. At the same time, different temperature distribution areas have different heat conduction processes in the time domain. According to Fourier's law and Joule heating in Cartesian coordinates, the temperature in the temperature concentration area at both ends of the crack will rise fastest with time. After the heating is stopped, the temperature drops the fastest, and other temperature distribution areas also have their own heat conduction laws. These phenomena are recorded in the heat map video by the thermal imager.
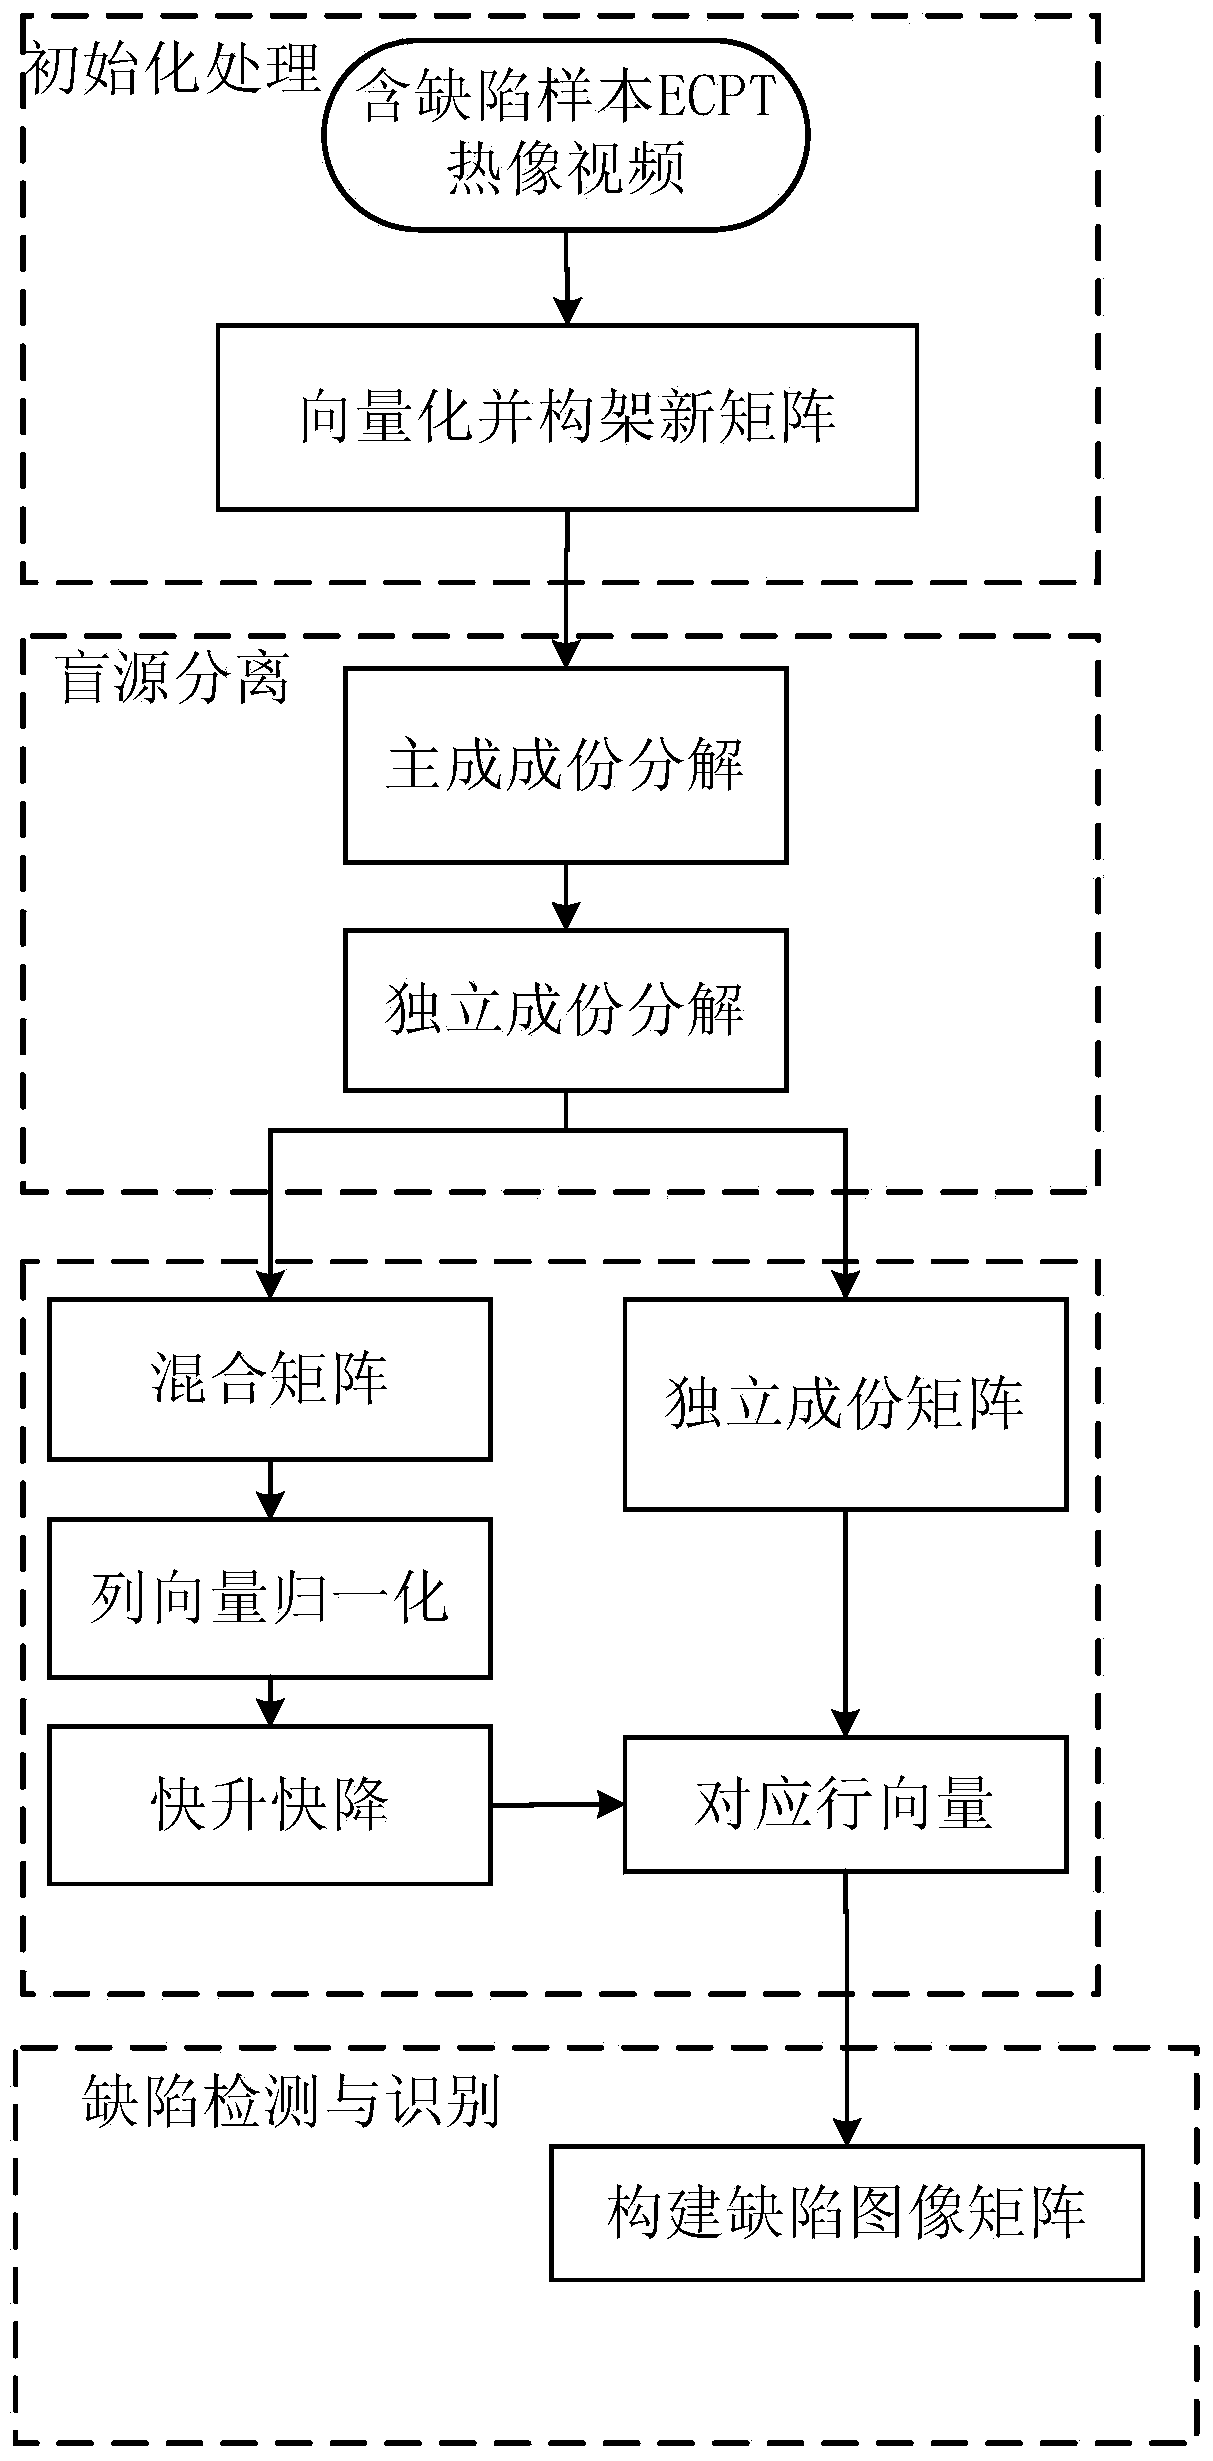
[0018] figure 1 It is a flowchart of the method for automatic detection and identification of pulse eddy current thermal imaging defects of the present invention.
[0019] In this embodiment, as figure 1 As shown, the pulse eddy current thermal imaging defect automatic detection and identification method of the present invention is implemented based on a single-channel blind source separation algorithm, and includes the following steps:
[0020] 1. Initialization
[0021] First, through the nondestructive testing of pulse eddy current thermal imaging, the thermal image video is obtained on the defective conductor, and the values ​​of each frame of thermal image are taken in column order and arranged in sequence, and each frame of thermal image is vectorized, and then each frame is obtained The heat map vector is used as the row vector of the new matrix in turn to construct a new matrix.
[0022] A schematic diagram of vectorizing and constructing a new matrix is ​​as follows figure 2 As shown, the obtained ECPT heat map video Y contains N frames of heat pictures along the time t axis, such as figure 2 (A) shown; each frame of hot picture is an N x ×N y Matrix, such as figure 2 As shown in (B), the row contains n x =1,…,N x Pixels, column contains n y =1,…,N y Pixels. Vectorize each frame of hot picture Y(t), t=1,...,N, that is, take the value of each frame of hot picture Y(t) in order and arrange them vertically to get the column vector vec[Y (t)], such as figure 2 (C) as shown; then transpose to get the row vector vec[Y(t)] T ,Such as figure 2 (D) shows, vec[Y(t)] T Contains n p =1,…,N y ,...,N y ×N y Pixels, T means transpose.
[0023] Vectorize and transpose all the hot pictures of t=1,...,N frames, and recombine each row vector in the order of time t=1,...,N to construct the row vector of the new matrix as follows: figure 2 (E) The new matrix Y′ shown in:
[0024] Y′=[vec[Y(t=1)] T; Vec[Y(t=2)] T;...;Vec[Y(t=N)] T ].
[0025] 2. Blind source separation
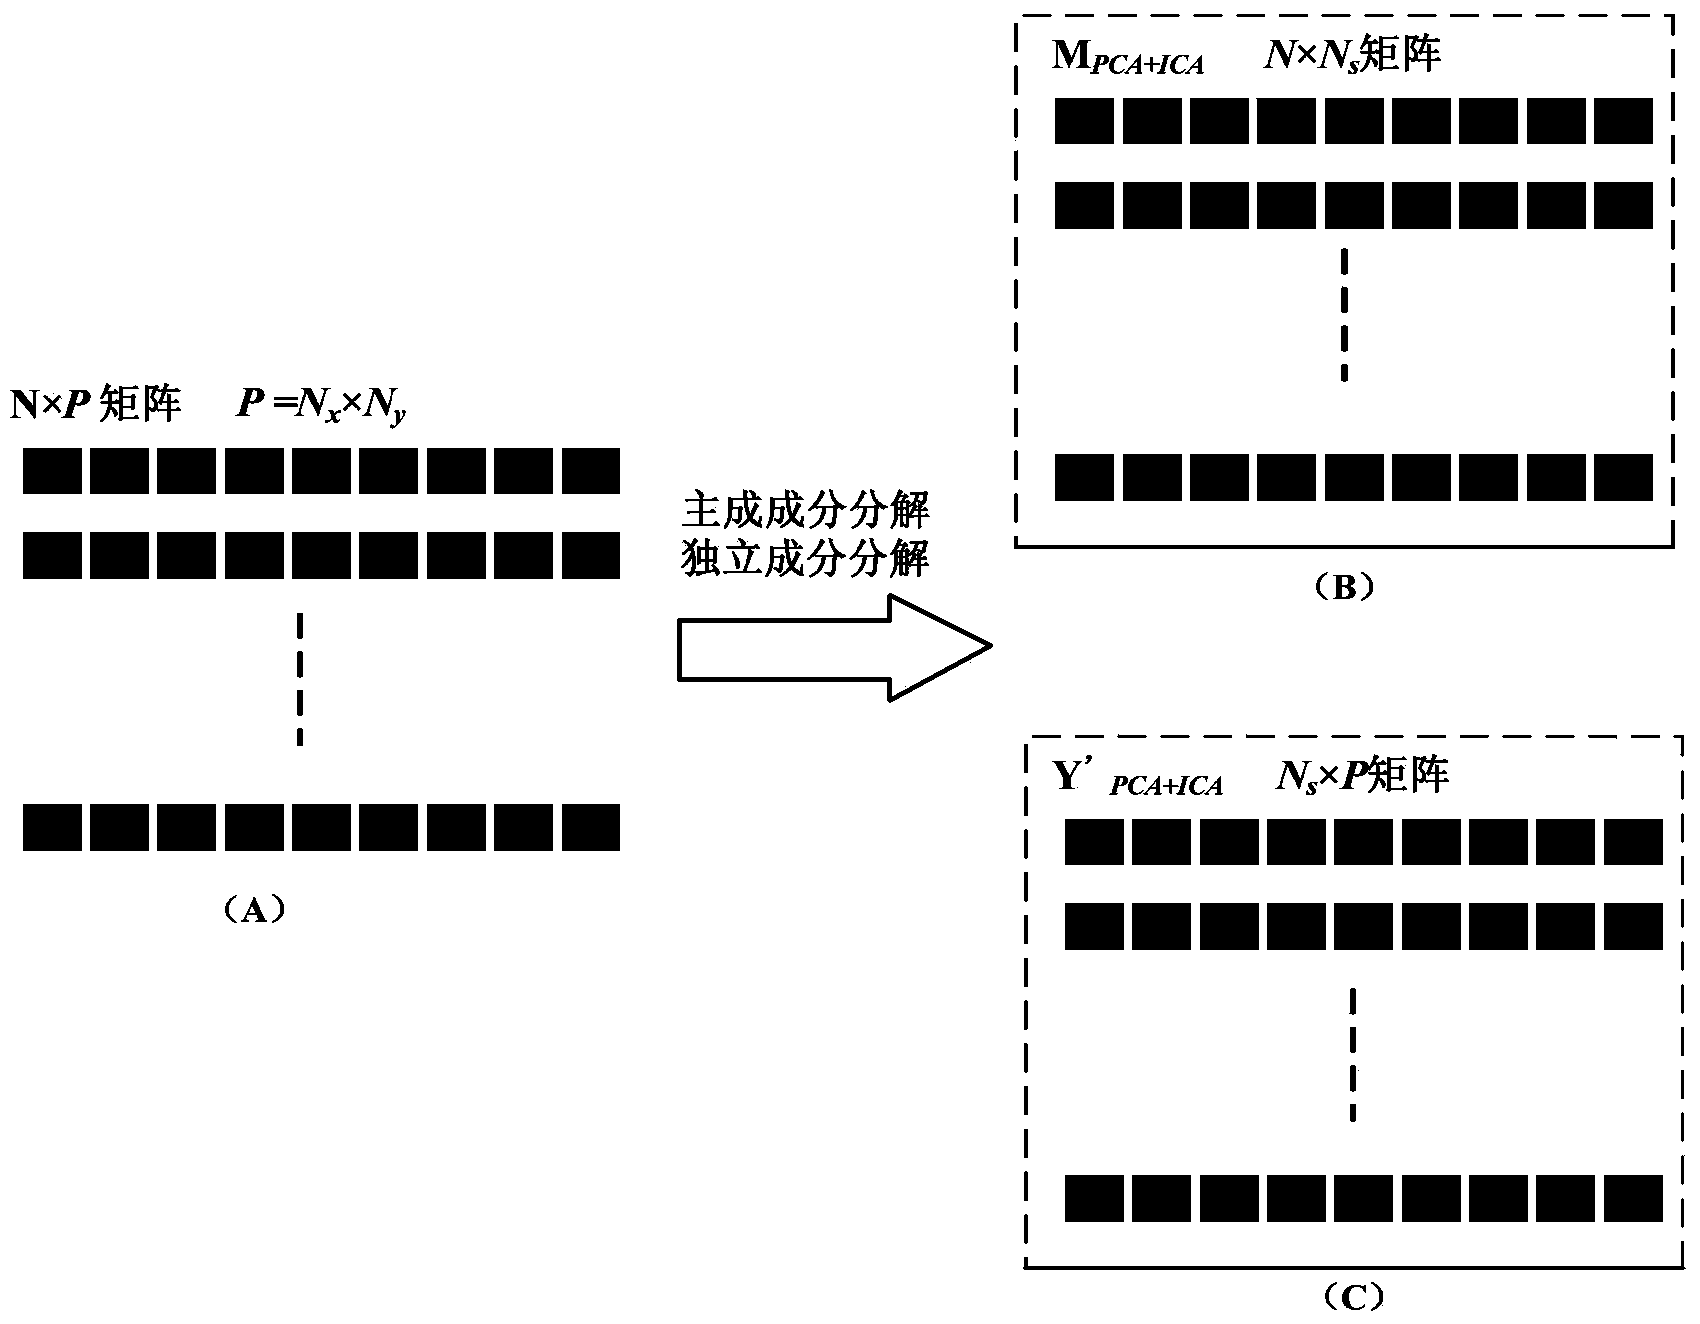
[0026] Principle Component Analysis plus Independent Component Analysis decompose the new matrix Y′ to obtain a dimension of N×N s Mixing matrix M PCA+ICA And the dimension is N s ×P independent component matrix Y′ PCA+ICA , Where N s In order to reduce the size, it needs to be manually set in advance.
[0027] Blind source separation such as image 3 Shown.
[0028] Gotten image 3 The dimension of the new matrix Y′ shown in (A) is N×P, P=N x ×N y , Through the principal component and independent component decomposition algorithm, such as image 3 The mixing matrix shown in (B):
[0029] M PCA + ICA = [ m 1 , m 2 , . . . , m N s ] ;
[0030] m i =[m 1 ,m 2 ,...,m N ] T
[0031] Where m i Is the mixed matrix M PCA+ICA The i-th column vector, i=1,...,N s , Here N s Need to manually set the number, column vector m i Contains j=1,...,N elements, so the entire mixing matrix M PCA+ICA Dimension is N×N s.
[0032] Similarly, we get image 3 (C) the independent component matrix Y′ shown PCA+ICA Dimension is N s ×P, namely N s Row P column matrix.
[0033] Principal component decomposition and independent component decomposition belong to the existing technology. The specific steps can be found in the paper "A. Hyvarinen, J. Karhunen, and E. Oja, "Independent component analysis and blind source separation," John Wiley & Sons, pp. 20 -60, 2001."
[0034] 3. Vector normalization and independent component matrix row vector selection
[0035] 3.1), vector normalization
[0036] The mixing matrix M PCA+ICA Normalize each column vector, such as Figure 4 (C) The formula is as follows:
[0037] m i ′ = [ m i - min ( m i ) ] max ( m i ) - min ( m i )
[0038] Where m i Is the mixed matrix M PCA+ICA The i-th column vector of m′ i Is the normalized mixed matrix M PCA+ICA The i-th column vector, i=1,...,N s;
[0039] min(m i ) Means to take the column vector m i The smallest element of max(m i ) Means to take the column vector m i The largest element of m i -min(m i ) Represents the column vector m i Each element of to subtract the column vector m i The smallest element min(m i ). The dotted frame area in (A) represents the mixed matrix M PCA+ICA The i-th normalized column vector m′ i And corresponding to the independent component matrix Y′ in the dotted frame area in (B) PCA+ICA I-th row vector
[0040] 3.2), independent component matrix row vector selection
[0041] in Figure 5 From Figure 5 (A) the mixed matrix M shown PCA+ICA Find all normalized column vectors m′ i , I=1,...,N s The location of the maximum value. In this embodiment, as Figure 5 As shown in (A), the framed first column vector m′ 1 The position of the maximum value is 39, frame the last column vector The position of the maximum value is 75, and the column vector m′ of the mixed matrix with the highest position of the maximum value in the column vector, that is, the smallest row number, is selected i Corresponding independent component matrix Y′ PCA+ICA I-th row vector That is, the correspondence shown is that the column number of the column vector of the mixed matrix is ​​the same as the row number of the row vector of the independent component matrix.
[0042] In the above example, the highest position of the column vector is 39, and the column vector is the mixed matrix column M PCA+ICA The first column vector corresponds to the independent component matrix Y′ PCA+ICA First row vector Draw the same frame, as shown in (B). Independent component row vector Will be used for defect location.
[0043] 4. Vector normalization and independent component matrix row vector selection
[0044] Take the selected row vector of the independent component matrix and take the value of the selected independent component row vector column by column according to the original heat map size to form a defect image matrix for detecting and identifying defects.
[0045] in Image 6 In, such as Image 6 (A) The first mixed matrix column vector m′ where the selected maximum value is located i Corresponding independent matrix Y′ PCA+ICA I-th row vector Rearrange the rows and columns according to the original heat map size to get the defect image matrix Such as Image 6 (B) Shown. Visualize the matrix, and the displayed heat collection bright spots are the positions of the two ends of the crack, so as to locate the defect and complete the defect detection.
[0046] Image 6 (C) Give the comparison result of ECPT's traditional artificially selected frame picture and the patented method, Image 6 The test sample in (C) is a fan blade, which contains two micro-cracks in the marked area (pre-determined by other detection methods). The artificially selected frame image method can only see a pair of heat-collecting bright spots, so the crack judgment is not accurate. The patented method not only solves the limitation of artificial selection, but also clearly reflects the two pairs of heat collecting bright spots, and accurately judges the position and quantity of defects.
[0047] Although the illustrative specific embodiments of the present invention have been described above to facilitate those skilled in the art to understand the present invention, it should be clear that the present invention is not limited to the scope of the specific embodiments. For those of ordinary skill in the art, As long as the various changes are within the spirit and scope of the present invention defined and determined by the appended claims, these changes are obvious, and all inventions and creations using the concept of the present invention are protected.

PUM

no PUM

Description & Claims & Application Information

We can also present the details of the Description, Claims and Application information to help users get a comprehensive understanding of the technical details of the patent, such as background art, summary of invention, brief description of drawings, description of embodiments, and other original content. On the other hand, users can also determine the specific scope of protection of the technology through the list of claims; as well as understand the changes in the life cycle of the technology with the presentation of the patent timeline. Login to view more.
Why Eureka
Try Eureka