Method and device for generating event group evolution diagram

A technology for event evolution and event generation, applied in the field of data processing, can solve problems such as high time complexity and achieve the effect of reducing time complexity

Active Publication Date: 2015-07-29
BAIDU ONLINE NETWORK TECH (BEIJIBG) CO LTD
View PDF6 Cites 11 Cited by
  • Summary
  • Abstract
  • Description
  • Claims
  • Application Information

AI Technical Summary

Problems solved by technology

Fixed a technical issue with high time complexity of run...

Method used


Image

  • Method and device for generating event group evolution diagram
  • Method and device for generating event group evolution diagram
  • Method and device for generating event group evolution diagram

Examples


Embodiment Construction

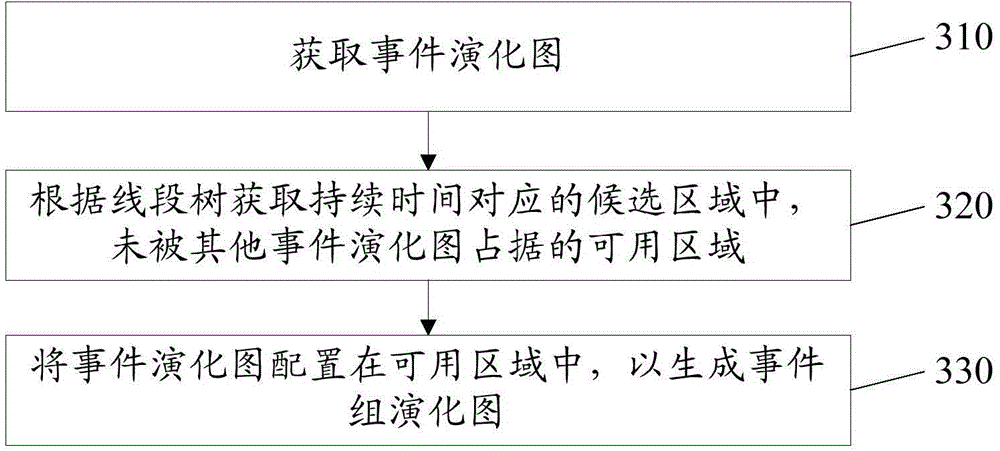
[0026] The application will be further described in detail below with reference to the drawings and embodiments. It can be understood that the specific embodiments described here are only used to explain the related invention, but not to limit the invention. In addition, it should be noted that, for ease of description, only the parts related to the relevant invention are shown in the drawings.

[0027] It should be noted that the embodiments in this application and the features in the embodiments can be combined with each other if there is no conflict. Hereinafter, the present application will be described in detail with reference to the drawings and in conjunction with embodiments.

[0028] In order to solve the technical problem of high time complexity of running the algorithm for configuring the event evolution graph in the prior art, the present application may use a line segment tree to predetermine the available area, and then the time event evolution graph is configured in...


PUM


Abstract

The invention discloses a method and device for generating an event group evolution diagram and solves the technical problem of high time complexity in operating an algorithm for configuring event evolution diagrams. The method includes: acquiring one event evolution diagram which represents corresponding relationship between duration and attention hotness of events; acquiring an available area unoccupied by other event evolution diagrams from candidate areas corresponding to the duration according to a segment tree; configuring the event evolution diagram in the available area so as to generate the event group evolution diagram. By the method and device, time complexity in operating the algorithm for configuring the event evolution diagrams is lowered.

Description

Technical field [0001] This application relates to the field of data processing technology, and specifically to a method and device for generating an event group evolution graph. Background technique [0002] At present, in the industry, a line chart is used to graphically display the evolution of event groups. figure 1 A schematic illustration of a line chart in the prior art is shown. Such as figure 1 As shown, the horizontal axis of the line graph can represent time, and the vertical axis can represent the degree of interest in the event. Different colored polylines represent events of different categories, and the number of events of the corresponding type corresponding to the corresponding time point can be displayed at the inflection point of the polyline. in figure 1 In the fold lines of different thicknesses are used to represent the fold lines of different colors. [0003] In academia, bubble charts are used to graphically display the evolution of event groups. figure 2...

Claims


Application Information

Patent Timeline
IPC IPC(8): G06T11/20
Inventor 车丽美沈剑平李炫莫洋郑楚煜齐沁芳宋元峰李永
Owner BAIDU ONLINE NETWORK TECH (BEIJIBG) CO LTD
Why Eureka
Try Eureka