Quality control method based on Z-score quality control chart for multiple variables

A multi-variable, control chart technology, applied in the direction of program control, comprehensive factory control, comprehensive factory control, etc., can solve problems such as multi-variable Z-score control charts that have not yet been seen

Active Publication Date: 2015-11-11
上海脉联科技有限公司
View PDF6 Cites 8 Cited by
  • Summary
  • Abstract
  • Description
  • Claims
  • Application Information

AI Technical Summary

Problems solved by technology

At present, there are many kinds of multivariate control charts, such as multivariate mean control charts (multivariate X2 control charts, multivariate T2 control charts), multivariate dispersion control charts (multivariate ISI control charts, multivariate W control charts) , multivariate cumulative sum control chart, multivariate weighted moving average control chart, etc., but there is no multivariate Z-score control chart

Method used


Image

  • Quality control method based on Z-score quality control chart for multiple variables
  • Quality control method based on Z-score quality control chart for multiple variables
  • Quality control method based on Z-score quality control chart for multiple variables

Examples


Embodiment Construction

[0044] Hereinafter, the present invention will be described in detail with reference to the drawings and embodiments. The following examples do not limit the invention. Without departing from the spirit and scope of the inventive concept, changes and advantages that can be imagined by those skilled in the art are all included in the present invention.

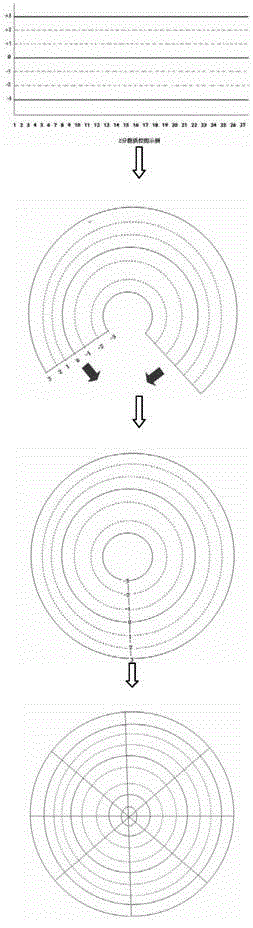
[0045] image 3 It is a flowchart of a quality control method based on a multivariate Z-score quality control chart according to an embodiment of the present invention. Such as image 3 As shown, the quality control method includes the following steps.

[0046] Step a: Obtain the Z scores of multiple detection items detected by the detection equipment, that is, multiple detection variables.

[0047] Here, the detection device may be a detection analysis system that generates various detection variables. For example, in the field of laboratory diagnosis in clinical medicine, it may be a biochemical analyzer. It can detect ...


PUM


Abstract

The invention provides a quality control method based on a Z-score quality control chart for multiple variables. The method comprises the steps of a: acquiring a plurality of test items that are conducted by a test device, namely the Z-scores of a plurality of test variables; b: establishing a concentrically ringed Z-score quality control chart for the multiple variables; c: respectively marking the Z-scores of the plurality of test variables on the Z-score quality control chart for the multiple variables; and d: acquiring the quality control states of all the test variables according to the Z-score mark positions of the plurality of test variables. According to the technical scheme of the invention, the controlled / out-of-control states of a plurality of test variables can be visually observed only by means of one Z-score quality control chart for the multiple variables. In addition, the system stability can be controlled based on the Z-score quality control chart for Zs variables.

Description

technical field [0001] The invention relates to the field of quality control, in particular to a quality control method based on a multivariate Z-score quality control chart. Background technique [0002] The development of statistical quality control theory benefits from the demand for product quality in industrial production. In 1924, American scholar Shewhart (Shewhart W.A.) applied the principles and methods of mathematical statistics to industrial production, and established the famous Shewhart quality control chart to predict changes in the production process and prevent fluctuations in product quality. In 1951, Levey-Jennings introduced the Shewhart quality control chart into the clinical laboratory to control the quality of the inspection process of the clinical laboratory. The Levey-Jennings (LJ) quality control chart is a mean-range control chart, which requires double parallel measurements of patient samples in each experiment, calculates the mean and range of th...

Claims


Application Information

Patent Timeline
IPC IPC(8): G05B19/418
CPCY02P90/02G05B19/41875G05B2219/32368
Inventor 王磊谢泽航汤琳
Owner 上海脉联科技有限公司
Why Eureka
Try Eureka