Data flow detection method based on fuzzy C-means clustering algorithm and entropy theory

A mean value clustering and detection method technology, which is applied in computing, computer parts, character and pattern recognition, etc., can solve problems such as performance degradation and data that cannot be processed as accurately as possible

Active Publication Date: 2015-11-18
天津津汉科技有限公司
View PDF4 Cites 14 Cited by
  • Summary
  • Abstract
  • Description
  • Claims
  • Application Information

AI Technical Summary

Problems solved by technology

Concept drift occurs in the data, and the old system cannot process

Method used


Image

  • Data flow detection method based on fuzzy C-means clustering algorithm and entropy theory
  • Data flow detection method based on fuzzy C-means clustering algorithm and entropy theory
  • Data flow detection method based on fuzzy C-means clustering algorithm and entropy theory

Examples


Embodiment 1

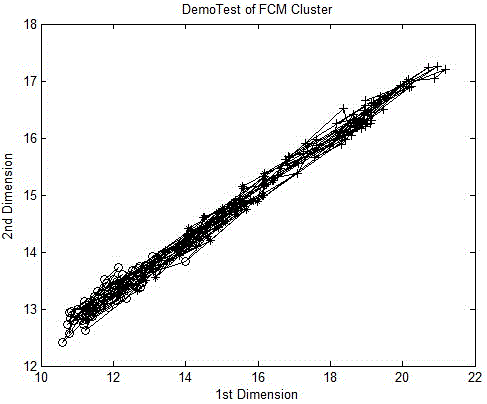
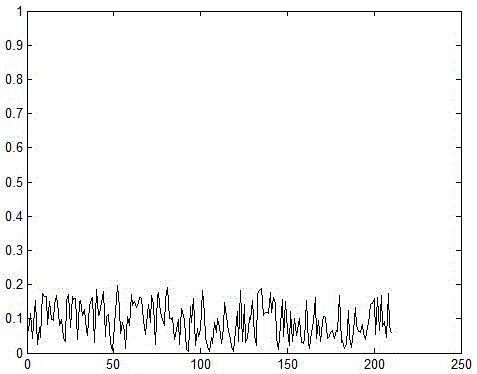
[0032] We selected an artificial data set and two real data for experiments. The real data is downloaded from the open database UCI. The first is real data without concept drift, SeedsData data set, this data set includes three categories, namely Kama, Rosa and Canadian, each category has 70 samples and seven attributes. From figure 1 It can be seen that FCM clustered the data more accurately; figure 2 It is the entropy curve of the data. It can be seen from the ordinate that when the concept drift occurs with good classification and no attribute changes, the entropy value is relatively low.

Embodiment 2

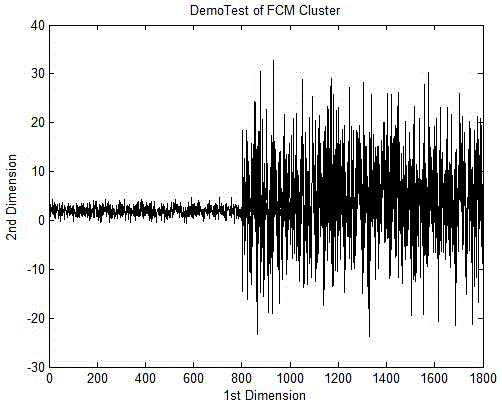
[0034] The Gaussian data set is used to detect concept drift. The two sets of Gaussian data obey the distribution of N([2;2],1) and N([4;4],8). The data stream length is 1000, and the conceptual drift length is 400. image 3 It is the classification of the two sets of Gaussian data. Because the mean and variance are different, it shows that the attributes of the data have changed, and the concept drift of attribute changes has occurred in the junction part. Figure 4 Is the curve of its data flow entropy. It can be seen that the peak of the entropy curve appears at the junction, indicating that the conceptual drift of the attribute change has occurred; after that, the entropy value tends to be stable again, indicating that the current system can adapt to the new data stream and does not require parameter updates.

Embodiment 3

[0036] Powersupply data set. This data set collects 24-hour power supply data for the main network and subnet. There are 1247 samples per hour. The experiment selected data for three time periods: 0 o'clock, 1 o'clock, and 21 o'clock. The first is to experiment with the data of 0 o'clock and 21 o'clock. Compared with 0 o'clock, 21 o'clock is the peak point of electricity consumption. It can be considered that the concept drift of attribute change has occurred compared with 0 o'clock. Figure 5 It is the entropy curve of the two sets of data at the junction. It can be seen that the entropy value increases significantly. After the data is stable, the entropy value decreases. Image 6 It is the data flow entropy curve at 0 and 1 point. The electricity consumption at 0 and 1 point is similar. It can be regarded as a data flow without conceptual drift, so the entropy curve is stable.


PUM


Abstract

The present invention discloses a data flow detection method based on a fuzzy C-means clustering algorithm and an entropy theory. An FCM clustering algorithm is introduced into the clustering analysis of a data flow, and data flow data is subjected to fuzzy C-means clustering analysis. The information entropy of the data flow is calculated by using the membership of the obtained data. Through analyzing the change trend of the entropy of the data flow, the detection of the concept drift with attribute change is carried out. The calculation of the membership and the entropy of the data flow are included. According to the method, the entropy theory is introduced, by using the membership of data to a class, the entropy of the data flow is calculated, the change of an entropy value is expressed in a time axis, and the concept drift with the attribute change is detected through the trend of a curve. The detection of the concept drift with the attribute change is visually carried out through observing the trend of an entropy value curve. The detection is mainly applied to timely prompt a system to update a parameter or not so as to ensure the correct clustering analysis possible of continuous influx of data streams.

Description

technical field [0001] The invention relates to a data stream clustering and attribute change concept drift detection technology. The method is simple, practical, vivid and intuitive, and overcomes the shortcomings of complex classification algorithms in previous data mining. Background technique [0002] In recent years, as data stream mining has become a research hotspot, its classification problem has naturally been widely concerned by the academic community. The emergence of the Internet and wireless communication networks has produced a large number of data flow types: transaction record data of large supermarkets, stock prices of stock exchanges, stock transaction information data, network monitoring data, call record data of telecommunications departments, credit card transaction flow , data sent back by sensors, etc. We have noticed that most of these data are related to geographic information, mainly because geographic information has a large dimension, and it is ea...

Claims


Application Information

Patent Timeline
IPC IPC(8): G06K9/62
CPCG06F18/2321
Inventor 王为秦姗张宝菊
Owner 天津津汉科技有限公司
Why Eureka
Try Eureka