A smart meter life cycle prediction method and device based on correlation coefficient analysis
A technology of correlation coefficient analysis and life cycle, which is applied in the direction of electrical digital data processing, special data processing applications, instruments, etc., can solve problems such as the inability to accurately predict the life cycle of smart meters, and achieve the effect of improving accuracy
- Summary
- Abstract
- Description
- Claims
- Application Information
AI Technical Summary
Problems solved by technology
Method used
Image
Examples
Embodiment 1
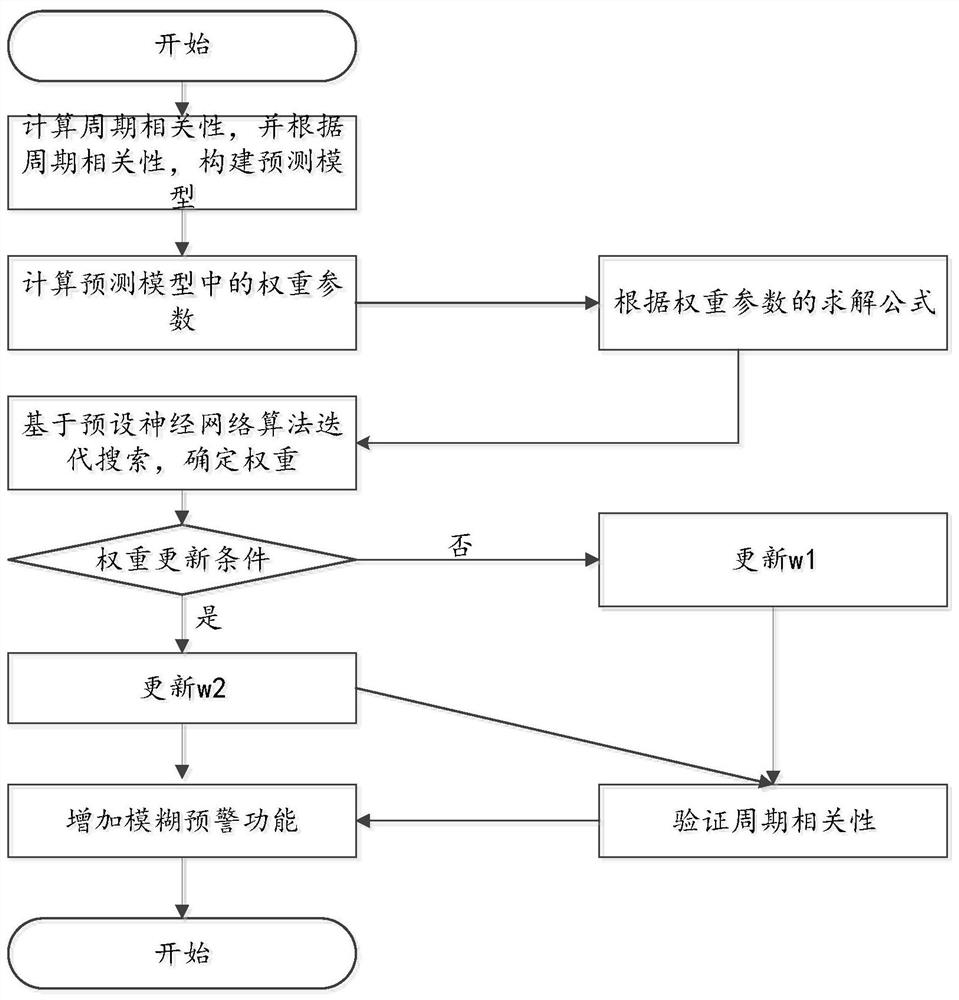
[0071] This embodiment provides a method for predicting the life cycle of a smart meter based on correlation coefficient analysis, see figure 1 , the method includes:
[0072] First perform step S1: calculate and verify the periodic correlation between the three factors of the unit, the meter manufacturer, and the cause of the failure, where the periodic correlation is specifically: μ' and σ' respectively represent the average value and variance of the life of each meter corresponding to the same meter manufacturer in the same units with different failure causes.
[0073] Specifically, correlation coefficient analysis is a statistical analysis method that studies the correlation between two or more random variables in the same status. For example, the correlation between human height and weight; the correlation between relative humidity in the air and rainfall are all problems of correlation analysis research. Correlation analysis can be applied to various fields such as in...
Embodiment 2
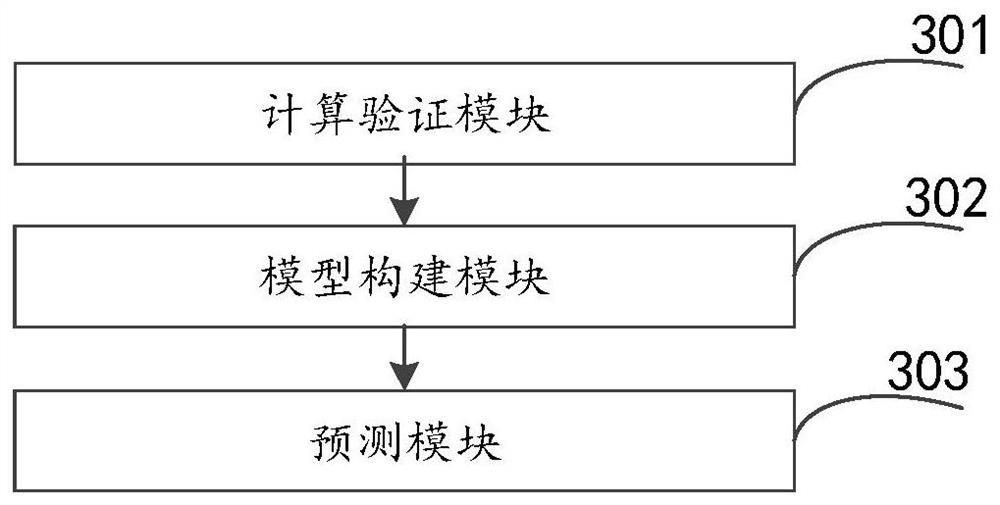
[0112] This embodiment provides a method and device for predicting the life cycle of a smart meter based on correlation coefficient analysis. Please refer to image 3 , the device includes:
[0113] The calculation and verification module 301 is used to calculate and verify the periodic correlation between the three factors of the unit, the meter manufacturer, and the fault cause, wherein the periodic correlation is specifically: μ' and σ' respectively represent the average value and variance of the life of each meter corresponding to the same meter manufacturer in the same units with different failure causes;
[0114] The model building module 302 is configured to build a life cycle prediction model of the smart meter according to the cycle correlation, and the prediction model is specifically:
[0115]
[0116] Among them, M represents the total number of meter manufacturers, N represents the total number of fault causes, W represents the total number of units, min(M, N...
Embodiment 3
[0138] Based on the same inventive concept, the present application also provides a computer-readable storage medium 400, please refer to Figure 4 , a computer program 411 is stored thereon, and the method in the first embodiment is implemented when the program is executed.
PUM
 Abstract
Description
Claims
Application Information
 - R&D
- Intellectual Property
- Life Sciences
- Materials
- Tech Scout
- Unparalleled Data Quality
- Higher Quality Content
- 60% Fewer Hallucinations
Browse by: Latest US Patents, China's latest patents, Technical Efficacy Thesaurus, Application Domain, Technology Topic, Popular Technical Reports.
© 2025 PatSnap. All rights reserved.Legal|Privacy policy|Modern Slavery Act Transparency Statement|Sitemap|About US| Contact US: help@patsnap.com


