Chart generation method and device

A technology of charts and icons, applied in the field of data processing, can solve problems such as poor results, and achieve the effect of improving user experience, readability and interpretation ability

Pending Publication Date: 2020-04-07
BEIJING GRIDSUM TECH CO LTD
View PDF4 Cites 0 Cited by
  • Summary
  • Abstract
  • Description
  • Claims
  • Application Information

AI Technical Summary

Problems solved by technology

In order to improve the display effect and ability of the chart, an icon (icon) can also be added to the data label, but the display position of the icon (icon) in the data label (label) is fixed, such as displayed on the left side of the text, the effect is not good

Method used


Image

  • Chart generation method and device
  • Chart generation method and device
  • Chart generation method and device

Examples


Embodiment Construction

[0048] Exemplary embodiments of the present disclosure will be described in more detail below with reference to the accompanying drawings. Although exemplary embodiments of the present disclosure are shown in the drawings, it should be understood that the present disclosure may be embodied in various forms and should not be limited by the embodiments set forth herein. Rather, these embodiments are provided for more thorough understanding of the present disclosure and to fully convey the scope of the present disclosure to those skilled in the art.

[0049] For ease of understanding, a number of technical terms involved in the embodiments of the present application are firstly introduced below.

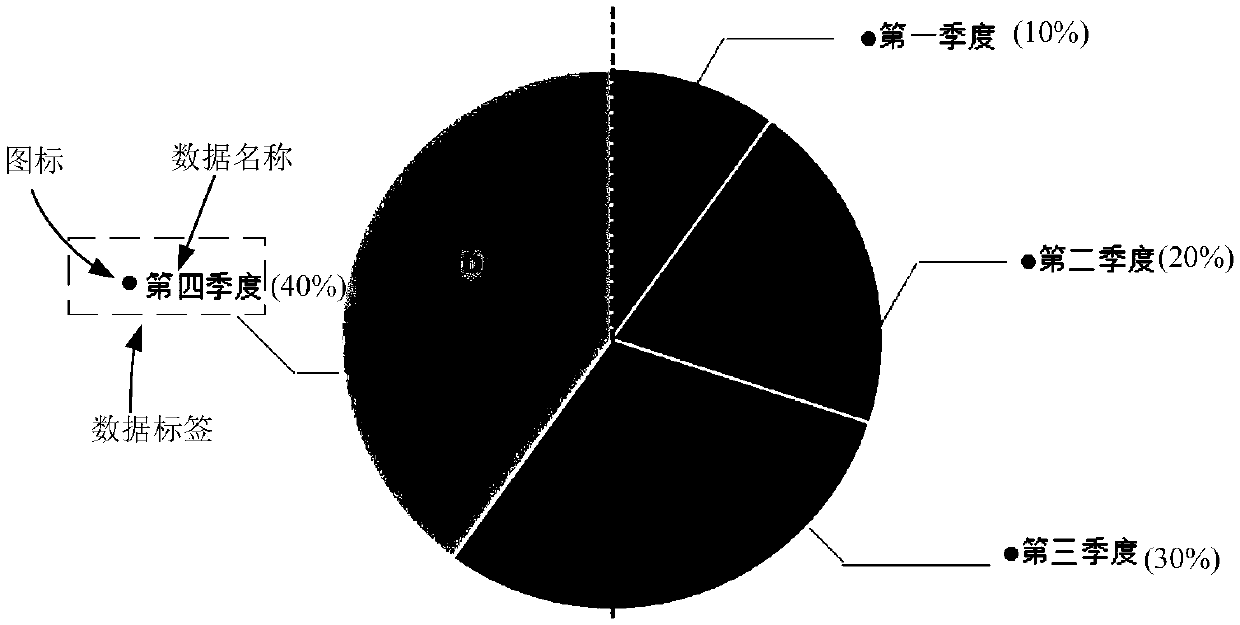
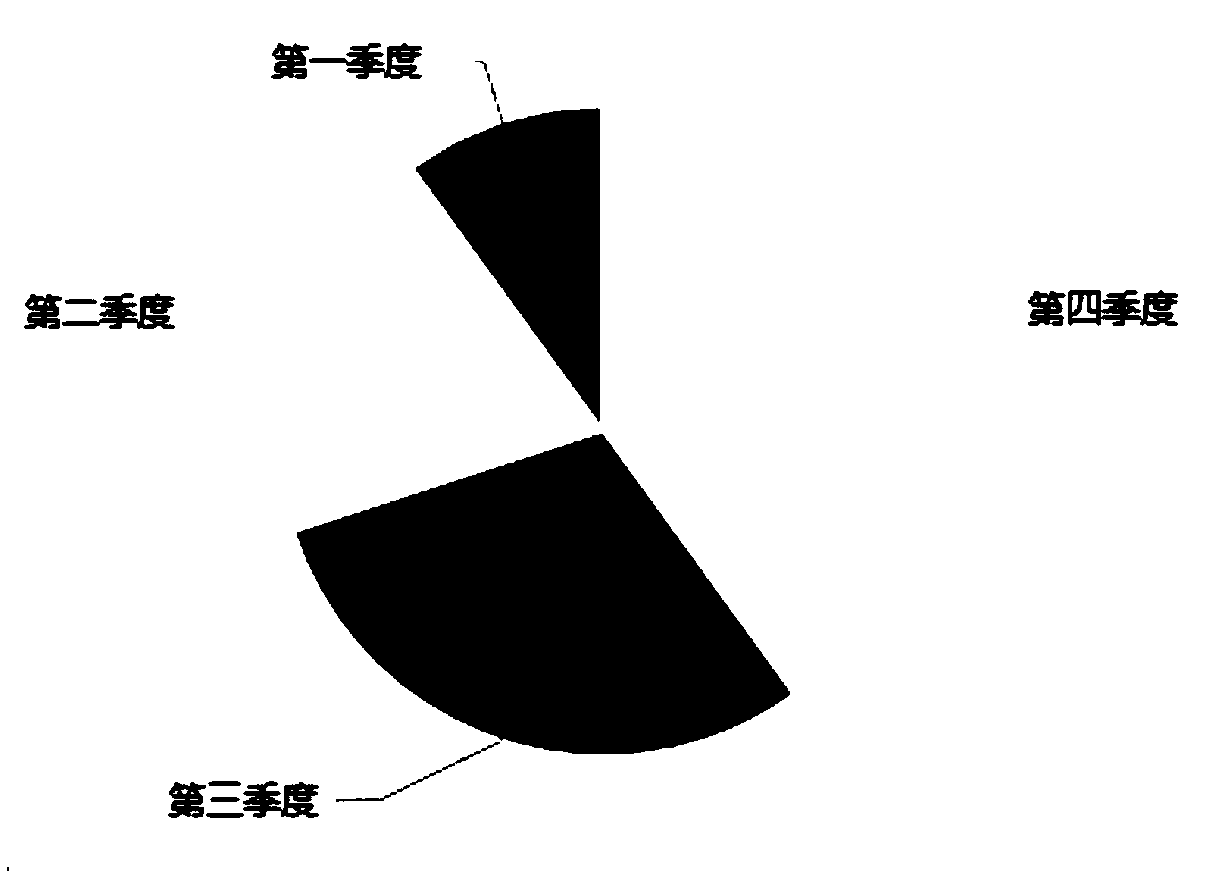
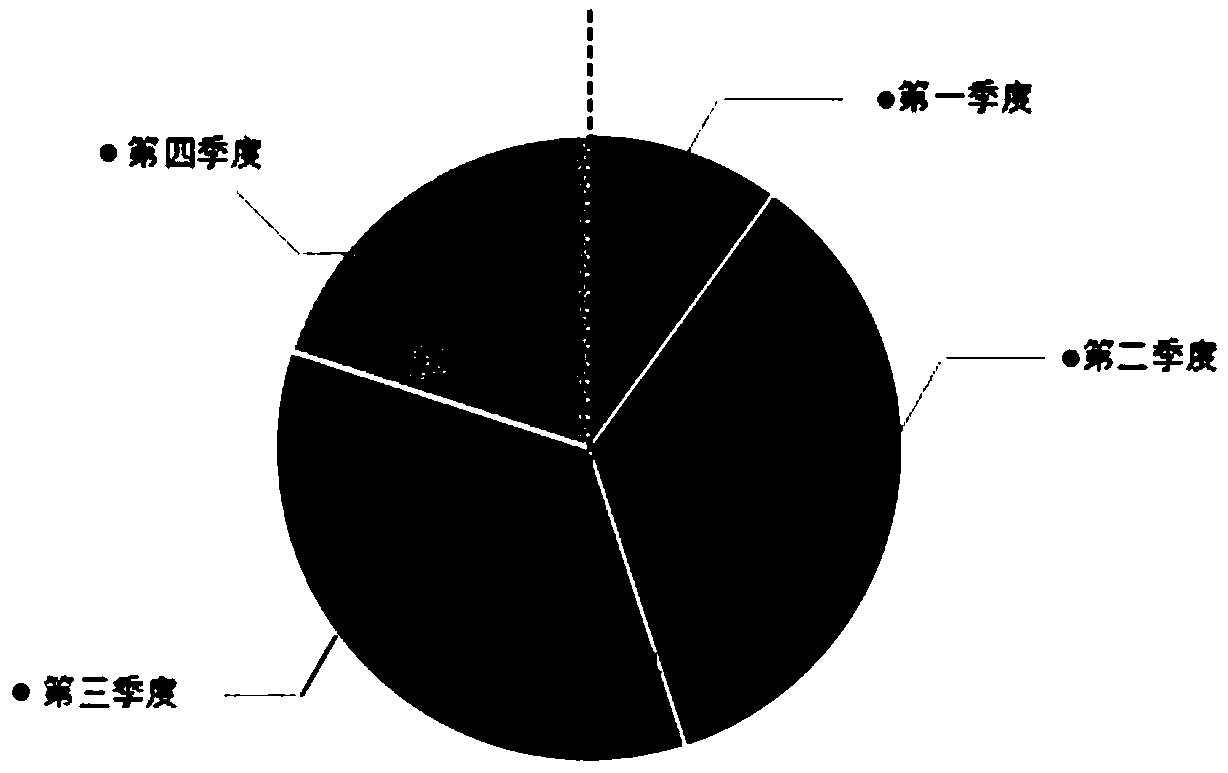
[0050] A pie chart, also known as a pie chart or a pie chart, is a circular statistical chart divided into several sectors, used to describe the relative relationship between quantities, frequencies or percentages. In a pie chart, the arc length (and central angle and area) of each sec...


PUM


Abstract

The invention discloses a chart generation method and apparatus. The method comprises the steps of obtaining at least one group of statistical data; wherein the statistical data comprises a data nameand a data proportion; judging the display position of the data label of each group of statistical data in a target chart according to a preset display sequence and the data proportion of the statistical data; wherein the target chart is a pie chart or a circular ring chart; According to the data proportion of the at least one group of statistical data, generating a target chart according to a preset display sequence, According to the display position, determining the relative position of an icon and a data name in the data label of each group of statistical data.

Description

technical field [0001] The present application relates to the technical field of data processing, and in particular to a method and device for generating graphs. Background technique [0002] A chart (Chart), or also known as a statistical chart, represents a piece of graphical data, and is often named after the image used, such as a pie chart, which mainly uses circular symbols, bar charts or histograms, Rectangular symbols are mainly used. A line chart, meant to use line symbols. Among them, the pie chart (also known as pie chart, pie chart) is a cut circle that uses the proportion of each cut block to represent data. It can also be used to interpret certain types of structures and provide different information at the same time. In conclusion, graphs are often used to facilitate understanding large amounts of data and the relationships between data. Allowing people to read raw data more quickly through visual symbols has been widely used in various fields. [0003] Bas...

Claims


Application Information

Patent Timeline
Patent Type & Authority Applications(China)
IPC IPC(8): G06F16/248G06F40/183
Inventor 贾艳凯
Owner BEIJING GRIDSUM TECH CO LTD
Why Eureka
Try Eureka