
A Causal Network Analysis Method for Multiscale Time Series Physiological Signals

A physiological signal, time series technology, applied in reasoning methods, medical science, diagnosis, etc.

Active Publication Date: 2021-07-02
UNIV OF ELECTRONICS SCI & TECH OF CHINA
View PDF2 Cites 0 Cited by
  • Summary
  • Abstract
  • Description
  • Claims
  • Application Information

AI Technical Summary

Problems solved by technology

However, when applied to complex processes with naturally inherited nonlinear and non-stationary properties, these decomposition procedures do not capture important features at different time scales

Method used


Image

  • A Causal Network Analysis Method for Multiscale Time Series Physiological Signals
  • A Causal Network Analysis Method for Multiscale Time Series Physiological Signals
  • A Causal Network Analysis Method for Multiscale Time Series Physiological Signals

Examples


Embodiment Construction

[0061] The technical solution of the present invention will be further described in detail below in conjunction with the accompanying drawings, but the protection scope of the present invention is not limited to the following description.

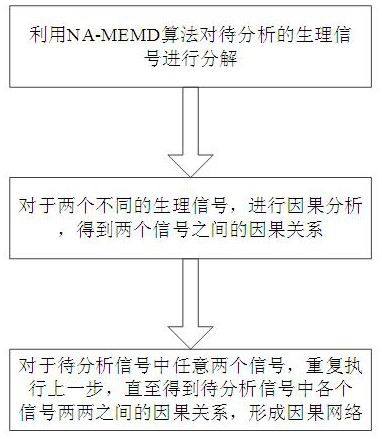
[0062] Such as figure 1 As shown, a causal network analysis method of multi-scale time series physiological signals, including the following steps:

[0063] S1. Input the physiological signal to be analyzed:

[0064] u 1 ={u 1,1 ,u 1,2 ,...,u 1,t}

[0065] u 2 ={u 2,1 ,u 2,2 ,...,u 2,t}

 …

[0066] u m ={u m,1 ,u m,2 ,...,u m,t}

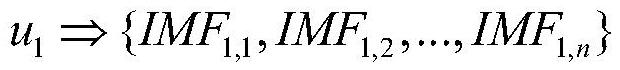
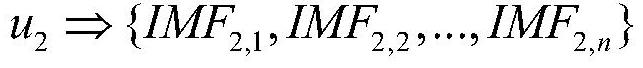
[0067] Physiological signal u to be analyzed using NA-MEMD algorithm 1 ,u 2 ,...,u m To break it down:

[0068]

[0069] in, Indicates that the NA-MEMD algorithm is used to decompose the signal. The NA-MEMD algorithm refers to the noise-assisted multivariate empirical mode decomposition algorithm. m represents the number of input physiological signals, and satisfies m≥2, t∈N + , N + rep...


PUM


Abstract

The invention discloses a causal network analysis method of a multi-scale time series physiological signal, comprising the following steps: S1. Utilizing the NA-MEMD algorithm to analyze the physiological signal u 1 , u 2 ,...,u m Decompose; S2. For two different physiological signals u i , u j , carry out causal analysis, i=1,2,...m, j=1,2...,m, and i≠j, to obtain the causal relationship between the two signals; S3. For u 1 , u 2 ,...,u m In any two signals, repeat step S2 until u is obtained 1 , u 2 ,...,u m The causal relationship between each pair of signals in the network forms a causal network. The invention can effectively analyze the causal network of the physiological signal, and provides convenience for the application of the physiological signal.

Description

technical field [0001] The invention relates to physiological signal processing, in particular to a causal network analysis method of multi-scale time series physiological signals. Background technique [0002] The causal network analysis method of multi-scale time series physiological signals can be applied in brain-computer interface technology, brain function and structural mechanism research, brain-machine interaction technology (physiological network composed of brain and eyes, heart, lungs, muscles and other human organs) and promotion. [0003] Based on the neuroscience functional separation and functional integration proposed by Gall, different brain functions are localized in specialized cortical areas, so the scientific standard for assessing brain perception, cognition and behavior by functional connectivity (FC) has been established Granger causality analysis dominates. FC was used as a visual tool to show the temporal correlation of the spatial distance betwee...

Claims


Application Information

Patent Timeline
Patent Type & Authority Patents(China)
IPC IPC(8): A61B5/00A61B5/372
CPCA61B5/7235G06N5/04G16H40/63
Inventor 张羿杨琴张力夫王冠冉宇斯蒂芬·苏布兰科·塞勒徐鹏尧德中
Owner UNIV OF ELECTRONICS SCI & TECH OF CHINA
Learn More