Method for determining initial movement time and brain region excitability
An excitatory and regional technology, applied in the direction of radiological diagnostic instruments, neural learning methods, applications, etc., can solve the problems that cannot be fully automatically utilized
- Summary
- Abstract
- Description
- Claims
- Application Information
AI Technical Summary
Problems solved by technology
Method used
Image

Examples
example 1
[0070] Example 1: Test data
[0071] For testing purposes, synthetic data was generated by the same model used for inference. A connectome matrix from 10 subjects was used, using Desikan-Killiany segmentation, with 84 nodes. Two sets of 10 episodes were generated from these 10 linkers, all with three different sets of activation function parameters: one for uncoupling (q = (-5.0, -5.0, -3.0, -3.0)) , one for weak coupling (q = (-6.5, -3.0, -3.5, 12.0)), and one for strong coupling (q = (-11.2, 5.3, -6.2, 69.3)). Finally, among the 84 regions in the segmentation, the number of observed regions was set to 21, 42 and 63. A total of (2 groups) x (3 coupling strengths) x (3 number of observed areas) = 18 groups of 10 seizures were obtained. For all cases, excitability c was randomly drawn from a standard normal distribution, and observation nodes were randomly selected. Inferences were made separately for each of the 18 groups.
example 2
[0072] Example 2: Results
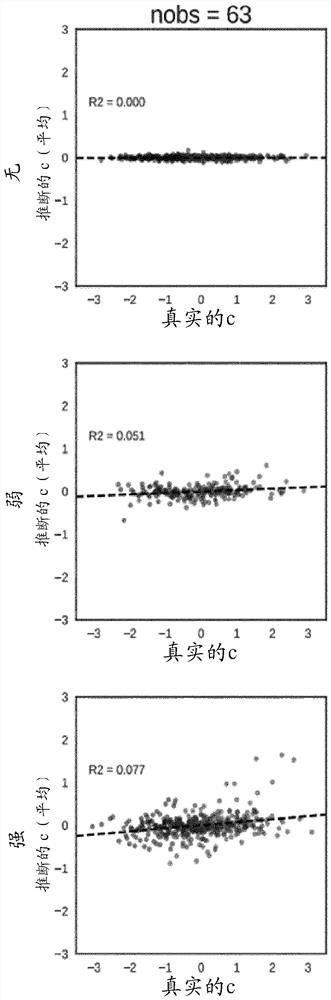
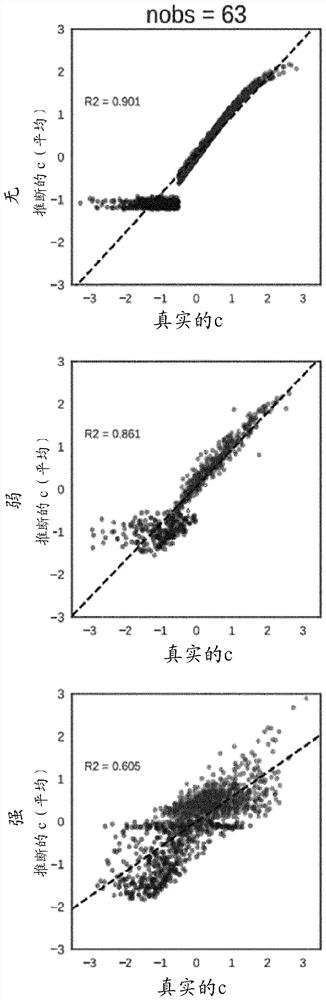
[0073] image 3 Exemplary results for extrapolation of a single episode are shown in part, while Figure 4 , 5 , 6A, 6B, 6C, 7A, 7B and 7C show cumulative results from all tests.
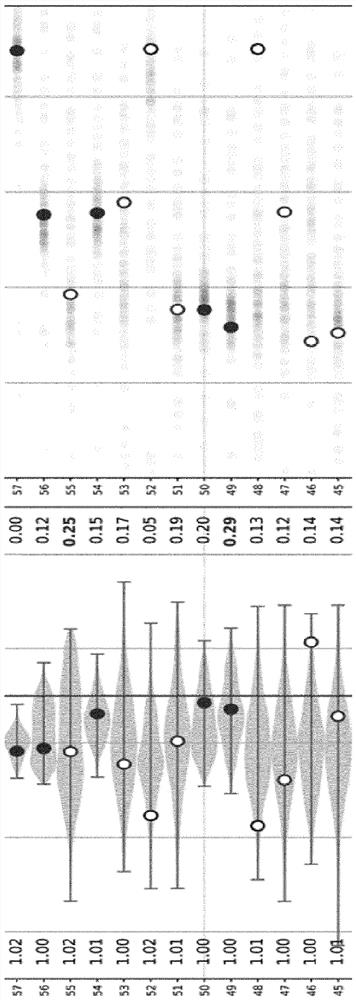
[0074] exist image 3 In , examples of inferred results are shown in part for a single episode with strong coupling and 21 observed regions. Left partial panels show true (dots) and inferred (plots) excitability for 84 brain regions. Solid dots mark observed areas, while hollow dots mark hidden areas. The light grey areas are those that have seizures, and the dark grey areas are those that do not. The numbers in the left column are Diagnostic value. The numbers in the right column are the inferred probability p(c>1), which is equivalent to the probability that the node is an epileptogenic node. The right panel shows the real (light / dark grey dots) and inferred (grey dots) region onset times. The rules for solid / hollow and light / dark grey dots are the same as in...
PUM
 Abstract
Description
Claims
Application Information