Method for detecting a solid tumor cancer

a solid tumor and detection method technology, applied in the field of detection and identification of various forms of proteins, can solve the problems of limiting the use of active surveillance patients in the management of patients, significant risk of misclassification of patients, and difficult so as to improve the ability to detect solid tumor cancer, reduce the risk of having cancer, and be easily treated

Active Publication Date: 2019-10-22
PHADIA AB
View PDF18 Cites 2 Cited by
  • Summary
  • Abstract
  • Description
  • Claims
  • Application Information

AI Technical Summary

Benefits of technology

[0009]This invention provides predictive models for the identification of solid tumor cancer, such as prostate cancer (PCa), in particular aggressive prostate cancer (aPCa), through analysis of a biomarker which has been repeatedly quantified in an individual. The present invention is based on the discovery that the combination of diagnostic markers measured at different points in time may improve the ability to detect solid tumor cancer in a general population. This can result in major savings for the society, because cancers that are identified early are more easily treatable. More importantly, the present invention is based on the discovery that a change in the amount or concentration of a biomarker within a short time frame, such as a PCa-related biomarker in an individual, which not necessarily is originating from the presence or growth of a tumor is related to the reduced risk of having solid tumor cancer, such as PCa. This finding has made it possible to present herein an improved and more reliable model for indicating a presence or non-presence of a solid tumor cancer, such as PCa, in an individual.
[0010]The current invention is a method to combine information from biomarker values taken at different points in time, to form a risk assessment, in particular for individuals who are not diagnosed with cancer. This risk assessment improves the possibility to determine, in an individualized manner, a suitable time for the next step in the cancer monitoring, wherein a next step could be a new doctor's appointment after 1, 3, 6, 12 or 24 months, or immediate invasive diagnostics (such as referring the individual to a biopsy), or immediate imaging of the individual using for example X-ray imaging, CT-imaging, PET-imaging, SPECT-imaging, MRI-imaging or any other imaging technology suitable for the purpose of identifying a tumor in said individual. The current invention may also be applied for individuals with a cancer diagnosis, for example to determine if the tumor is growing in situations where the progression of the cancer is typically slow.

Problems solved by technology

The screening and early detection of prostate cancer is a complicated task, and to date no single biomarker has been proven sufficiently good for specific and sensitive mapping of the male population.
However, the report concluded that the uncertainty of calculated PSA doubling time during active surveillance results in a significant risk of patients being misclassified according to the progression risk definitions, which subsequently limits its use in the management of patients on active surveillance.
However, due to the negative consequences of PSA screening there is no organized PSA screening recommended in Europe or North America today.
All in all, this leads to a large number of individuals being tested regularly for the presence of a variety of cancers, causing stress for the individuals and adding cost to the health care system.
The identification of aPCa is however difficult, partly because larger cohorts are required to provide a sufficient number of cases and controls in the development of statistical models.
Hence, the availability of predictive models for aPCa is low.

Method used


Image

  • Method for detecting a solid tumor cancer
  • Method for detecting a solid tumor cancer
  • Method for detecting a solid tumor cancer

Examples


example 1

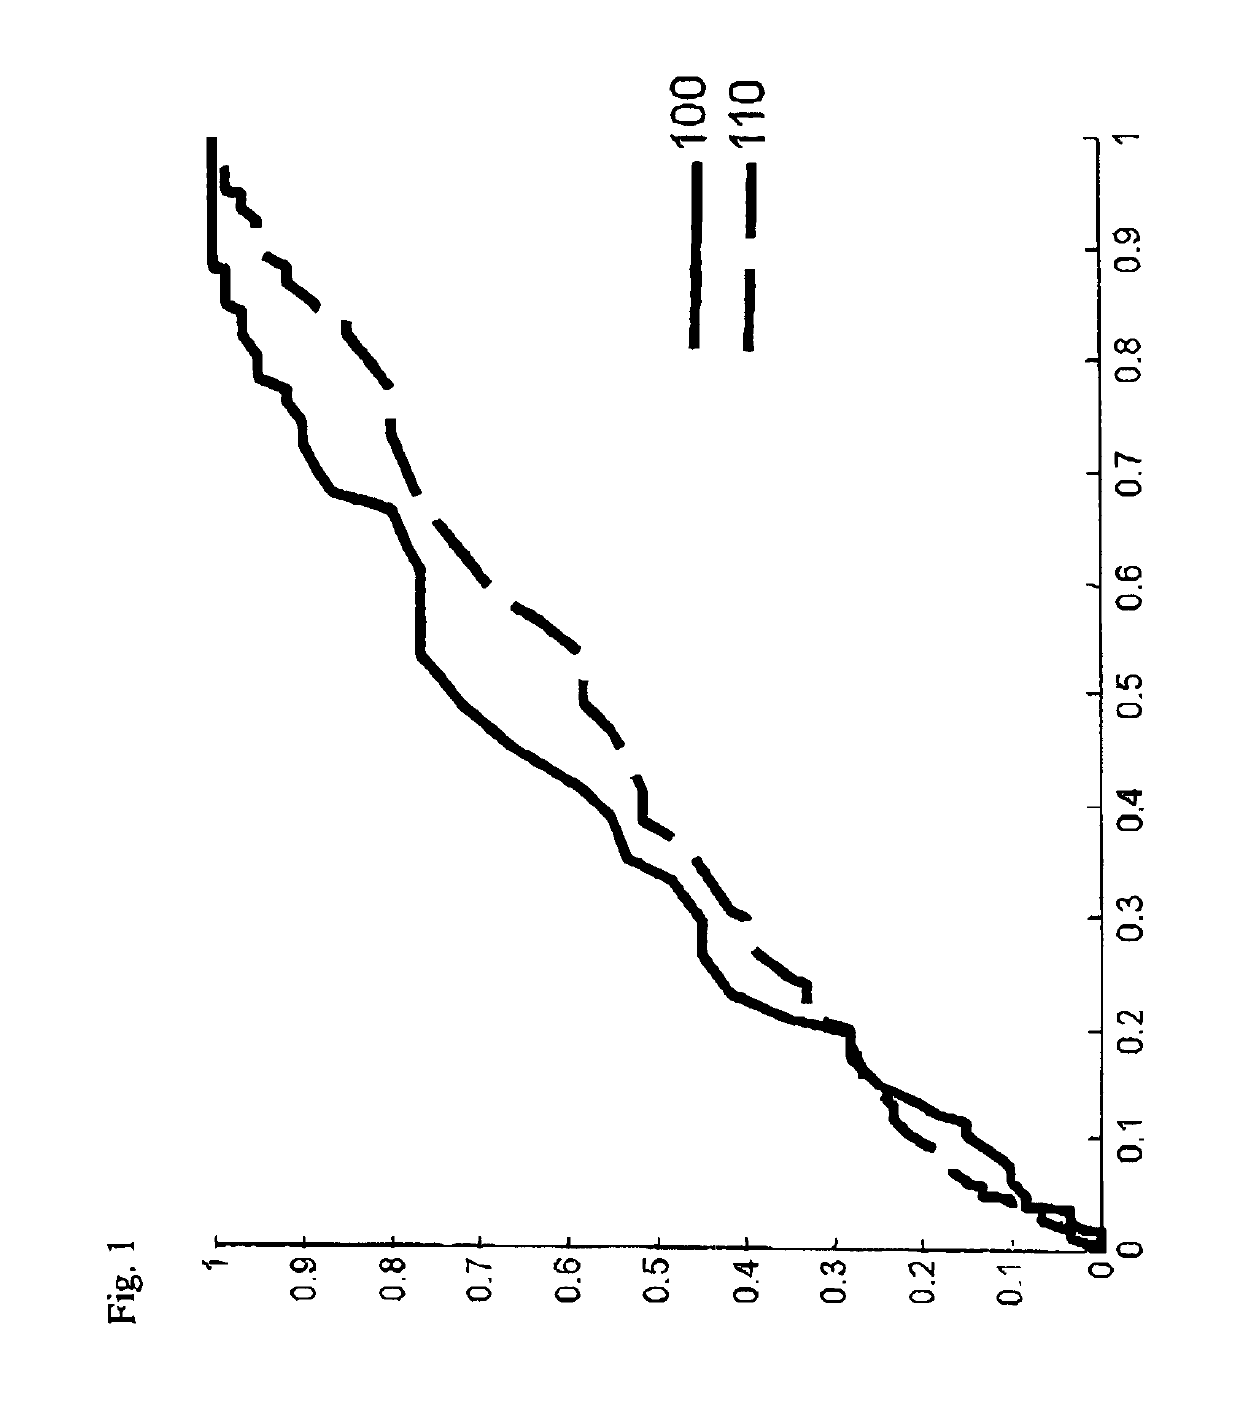
[0168]To illustrate the current invention, a data set comprising 436 individuals who were subjected to prostate cancer screening within the STHLM3 clinical trial was studied. The selected individuals matched the following criteria:[0169]a. The initial PSA test resulted in a value of total PSA below 10 ng / mL.[0170]b. The individual was selected for biopsy.[0171]c. At the time of biopsy, a second blood test was taken and a second PSA test was taken and the corresponding PSA value was determined.[0172]d. The change in PSA value was less than 100%.

[0173]The individuals were admitted to biopsy and second PSA test typically within 10-30 days, but in some cases the time between the initial PSA test and the second PSA test was two or three months. In this cohort, 175 individuals had less than 10% change of the PSA values. 129 individuals had PSA values that decreased between 10% and 73% of the initial PSA value and 101 had PSA values that increased between 10% and 100% of the initial PSA va...

example 2

[0179]In order to illustrate that the invention is of a more general nature, a data set comprising 326 individuals who were subjected to prostate cancer screening within the STHLM3 clinical trial was studied. The selected individuals matched the following criteria:[0180]a. The initial PSA test resulted in a value of total PSA below 10 ng / mL. At the same time, MIC-1 and MSMB values were determined.[0181]b. The individual was selected for biopsy.[0182]c. At the time of biopsy, a second blood test was taken and a second blood test was taken and the corresponding values of PSA, MIC-1 and MSMB were determined.[0183]d. The change in the biomarker value under study was less than 100%.

[0184]The individuals were admitted to biopsy and a second PSA test typically within one month, but in some cases the time between the initial PSA test and the second PSA test was two or three months. Approximately 13% of the individuals in this cohort proved to have aPCa. As shown in Table 1, the three biomar...

example 3

[0186]After collecting patient samples during a longer time, the data set of example 1 had been extended to comprise 1616 individuals who were subjected to prostate cancer screening within the STHLM3 clinical trial. Values for these was studied. The selected individuals matched the following criteria:[0187]a. The initial PSA test resulted in a value of total PSA below 10 ng / mL.[0188]b. The individual was selected for biopsy.[0189]c. At the time of biopsy, a second blood test was taken and a second PSA test was taken and the corresponding PSA value was determined.[0190]d. The change in PSA value was less than 100%

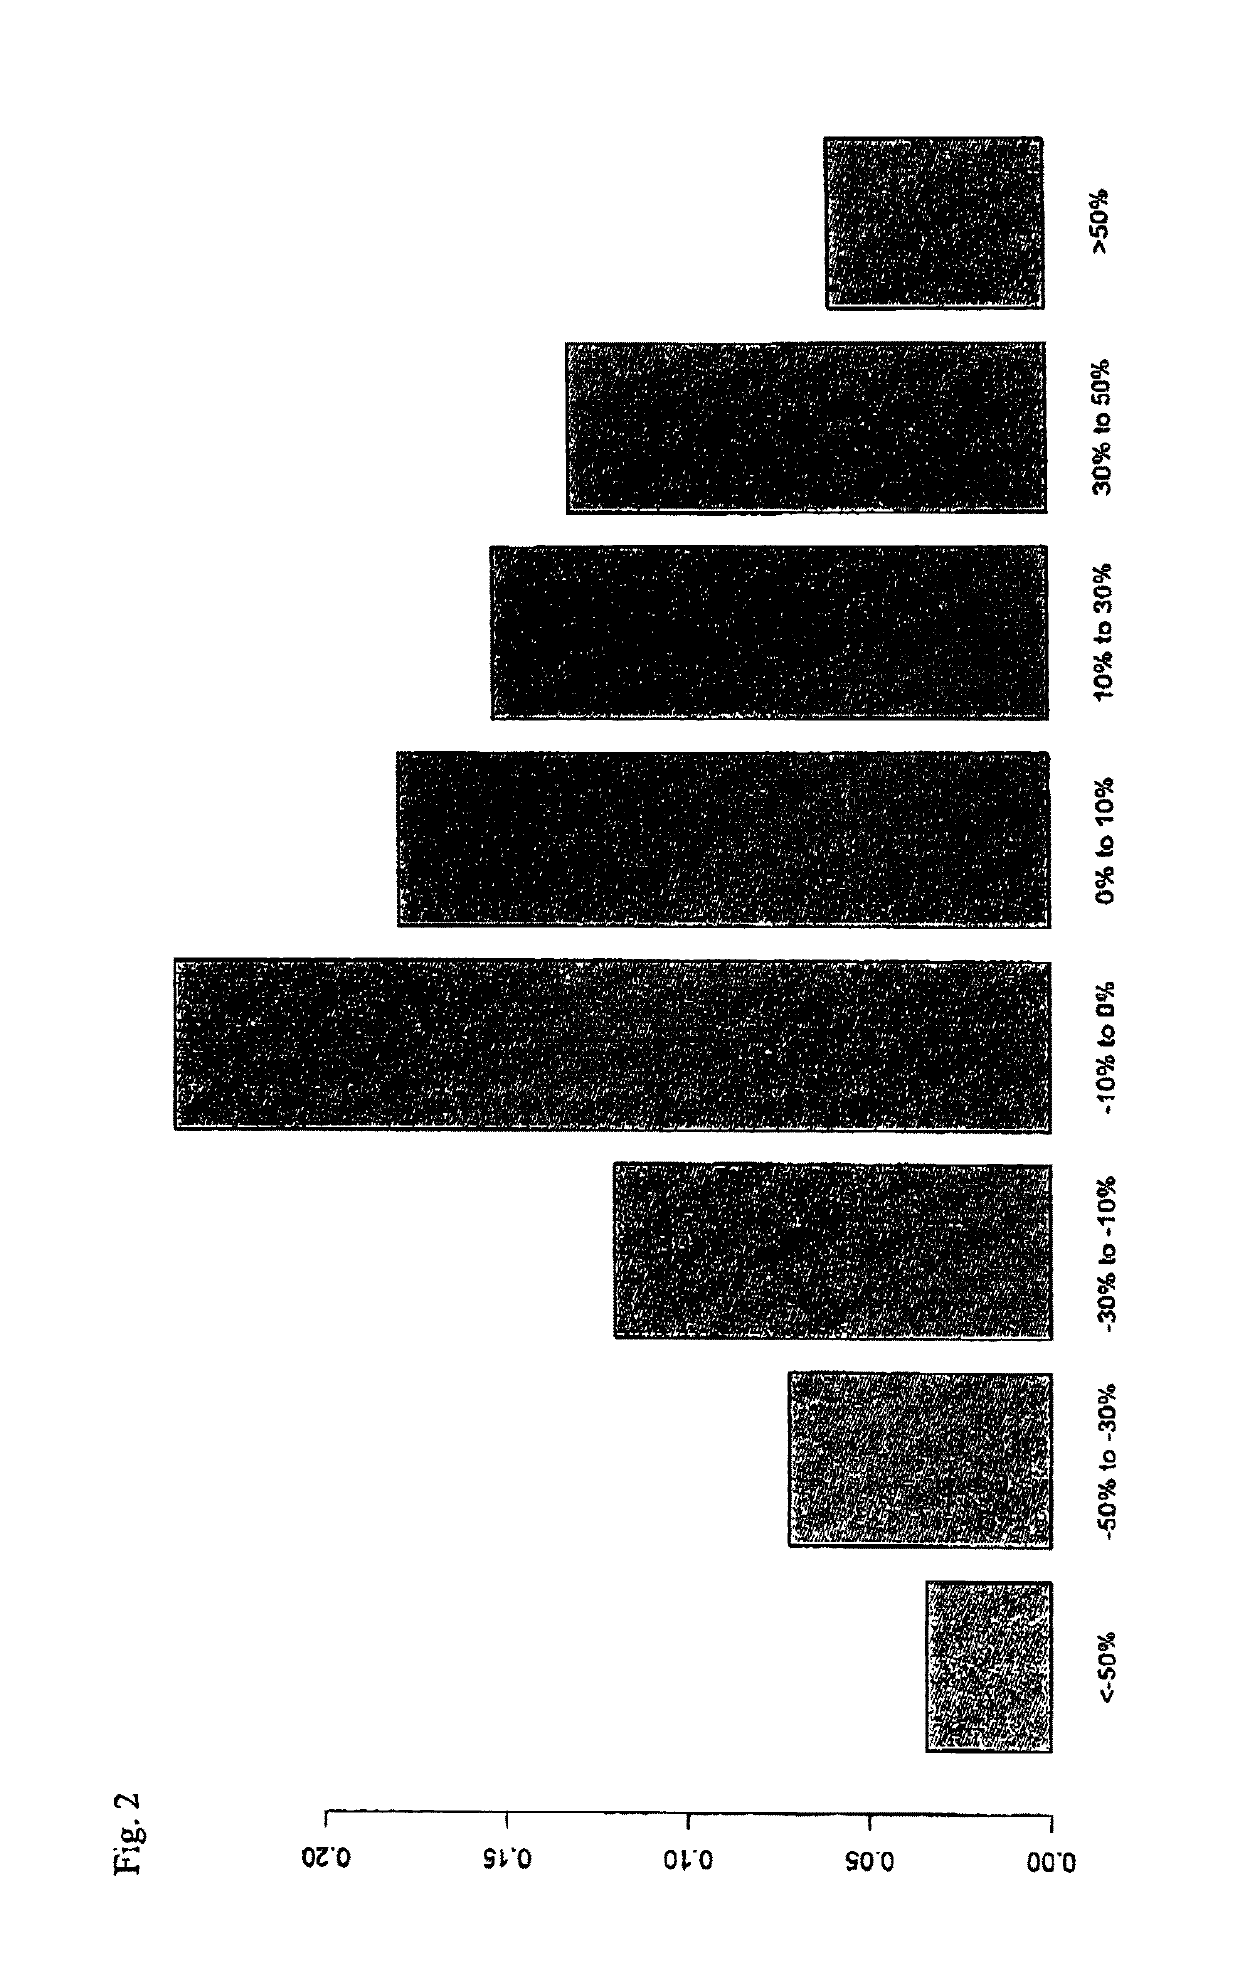
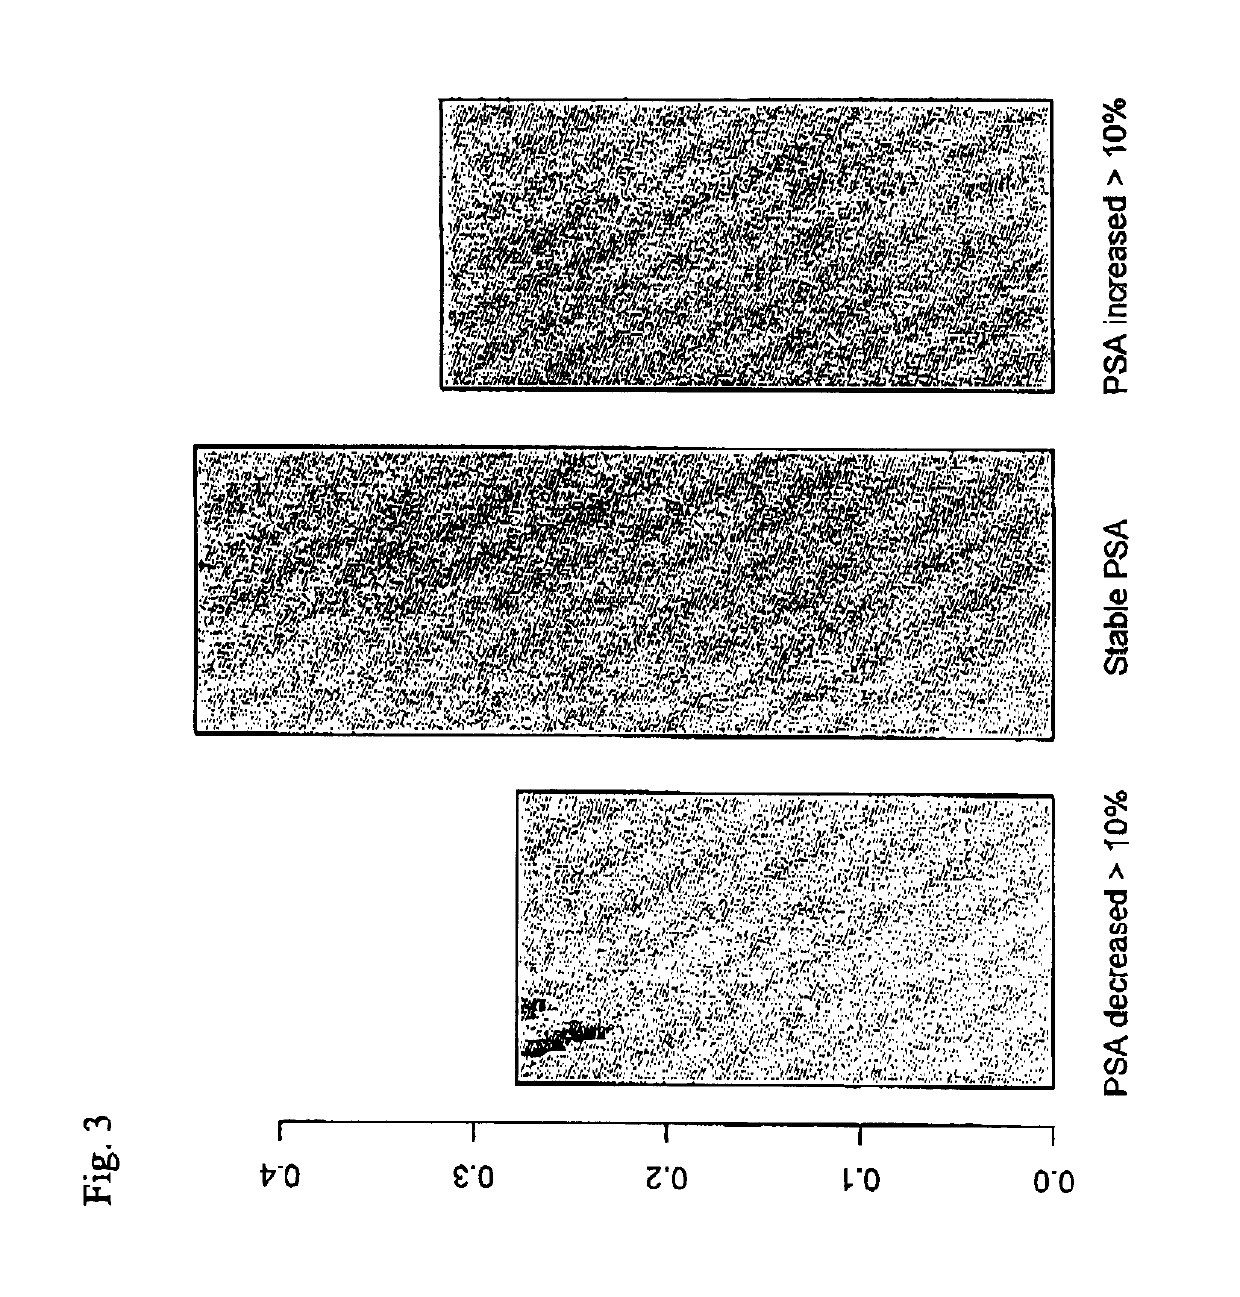
[0191]The individuals were admitted to biopsy and second PSA test typically within 10-30 days, but in some cases the time between the initial PSA test and the second PSA test was two or three months. FIG. 2 shows the risk for aPCa (y-axis), in this case defined as Gleason score=7, 8, 9, or 10, as a function of the extent of change in PSA value. Individuals who had almost the...


PUM

PropertyMeasurementUnit
timeaaaaaaaaaa
timeaaaaaaaaaa
doubling timeaaaaaaaaaa

Abstract

A method for indicating a presence or non-presence of a predefined solid tumor cancer in an individual, comprising the steps of: A. Providing at least one biological sample originating from said individual at a first point in time; B. Providing at least one biological sample originating from said individual at a second point in time; C. In said at least two biological samples, measuring a presence or concentration of at least one biomarker related to said predefined solid tumor cancer; D. Combining data regarding the presence or concentration of the at least one biomarker to form a kinetic composite value that reflects the change of biomarker presence or concentration; E. Correlating the kinetic composite value to the presence or non-presence of said predefined solid tumor cancer in said individual by comparing the kinetic composite value to a pre-determined cut-off value established with control samples of known predefined solid tumor cancer and benign disease diagnosis; wherein the time period between the first point in time and the second point in time is in the range from 0.5% to 25%, or more preferably in the range from 0.1% to 15%, of a typical tumor volume doubling time of said predefined solid tumor cancer; and the at least one biomarker determined is the same biomarker in each of the biological samples.

Description

FIELD OF THE INVENTION[0001]The present invention relates generally to the detection and identification of various forms of proteins, which have the potential utility as diagnostic markers. In particular, the present invention relates to the repeated test of one or more biomarkers where the variation in time is used for improved detection of solid tumor cancer, such as prostate cancer. More particularly, the present invention relates to the use of at least two biomarker tests collected within a time period corresponding to approximately 0.5-25%, or particularly approximately 0.1% to 15%, of the typical tumor volume doubling time for a predefined type of solid tumor cancer, for improved detection of solid tumor cancer.BACKGROUND OF THE INVENTION[0002]The measurement of serum prostate specific antigen (PSA) is widely used for the screening and early detection of prostate cancer (PCa). As discussed in the public report “Polygenic Risk Score Improves Prostate Cancer Risk Prediction: Res...

Claims


Application Information

Patent Timeline
Patent Type & Authority Patents(United States)
IPC IPC(8): G01N33/574C12Q1/6886
CPCG01N33/57434G01N33/57484G16H20/00G01N33/57473C12Q1/6886G01N2333/96455C12Q2600/156G01N2333/52G16H50/20G01N33/574
Inventor GRÖNBERG, HENRIK
Owner PHADIA AB
Why Eureka
Try Eureka