
Methods and system for visualizing data sets

a data set and data technology, applied in the field of data management, can solve the problems of data being often reduced to a scale that is unreadable and difficult to work, and achieve the effect of maximizing the use of the display area

Inactive Publication Date: 2006-02-16
AGILENT TECH INC
View PDF56 Cites 5 Cited by
  • Summary
  • Abstract
  • Description
  • Claims
  • Application Information

AI Technical Summary

Benefits of technology

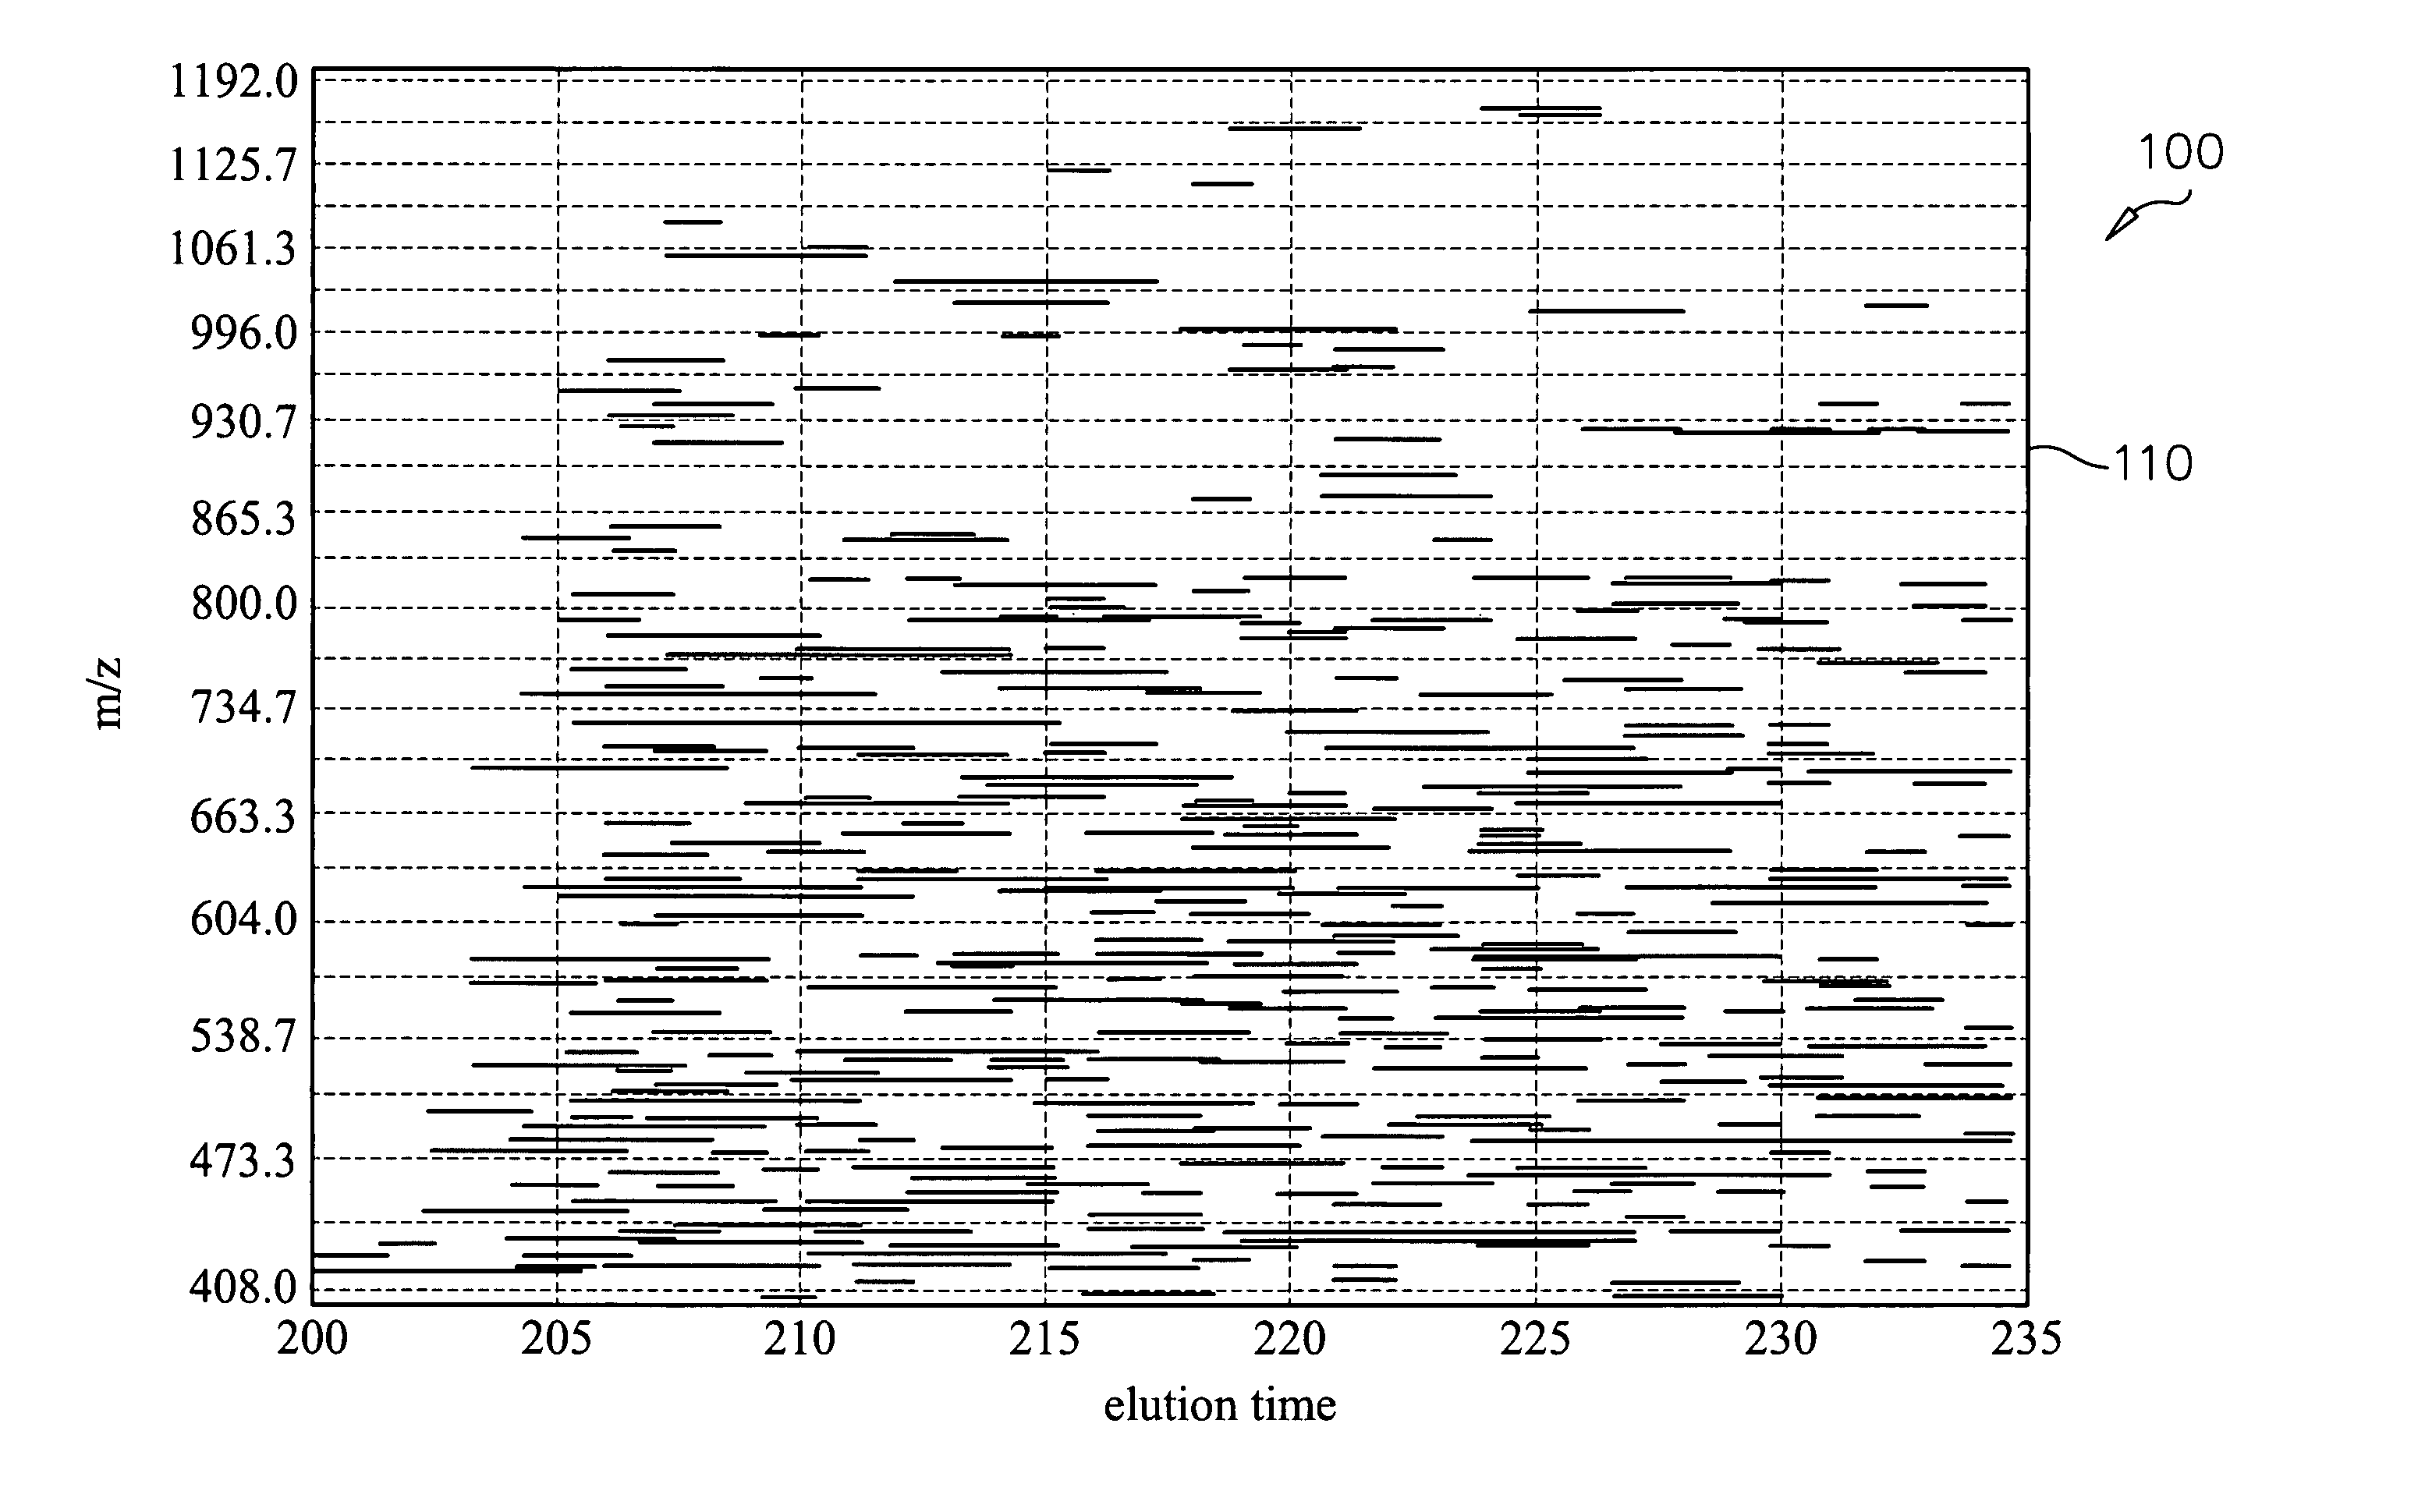
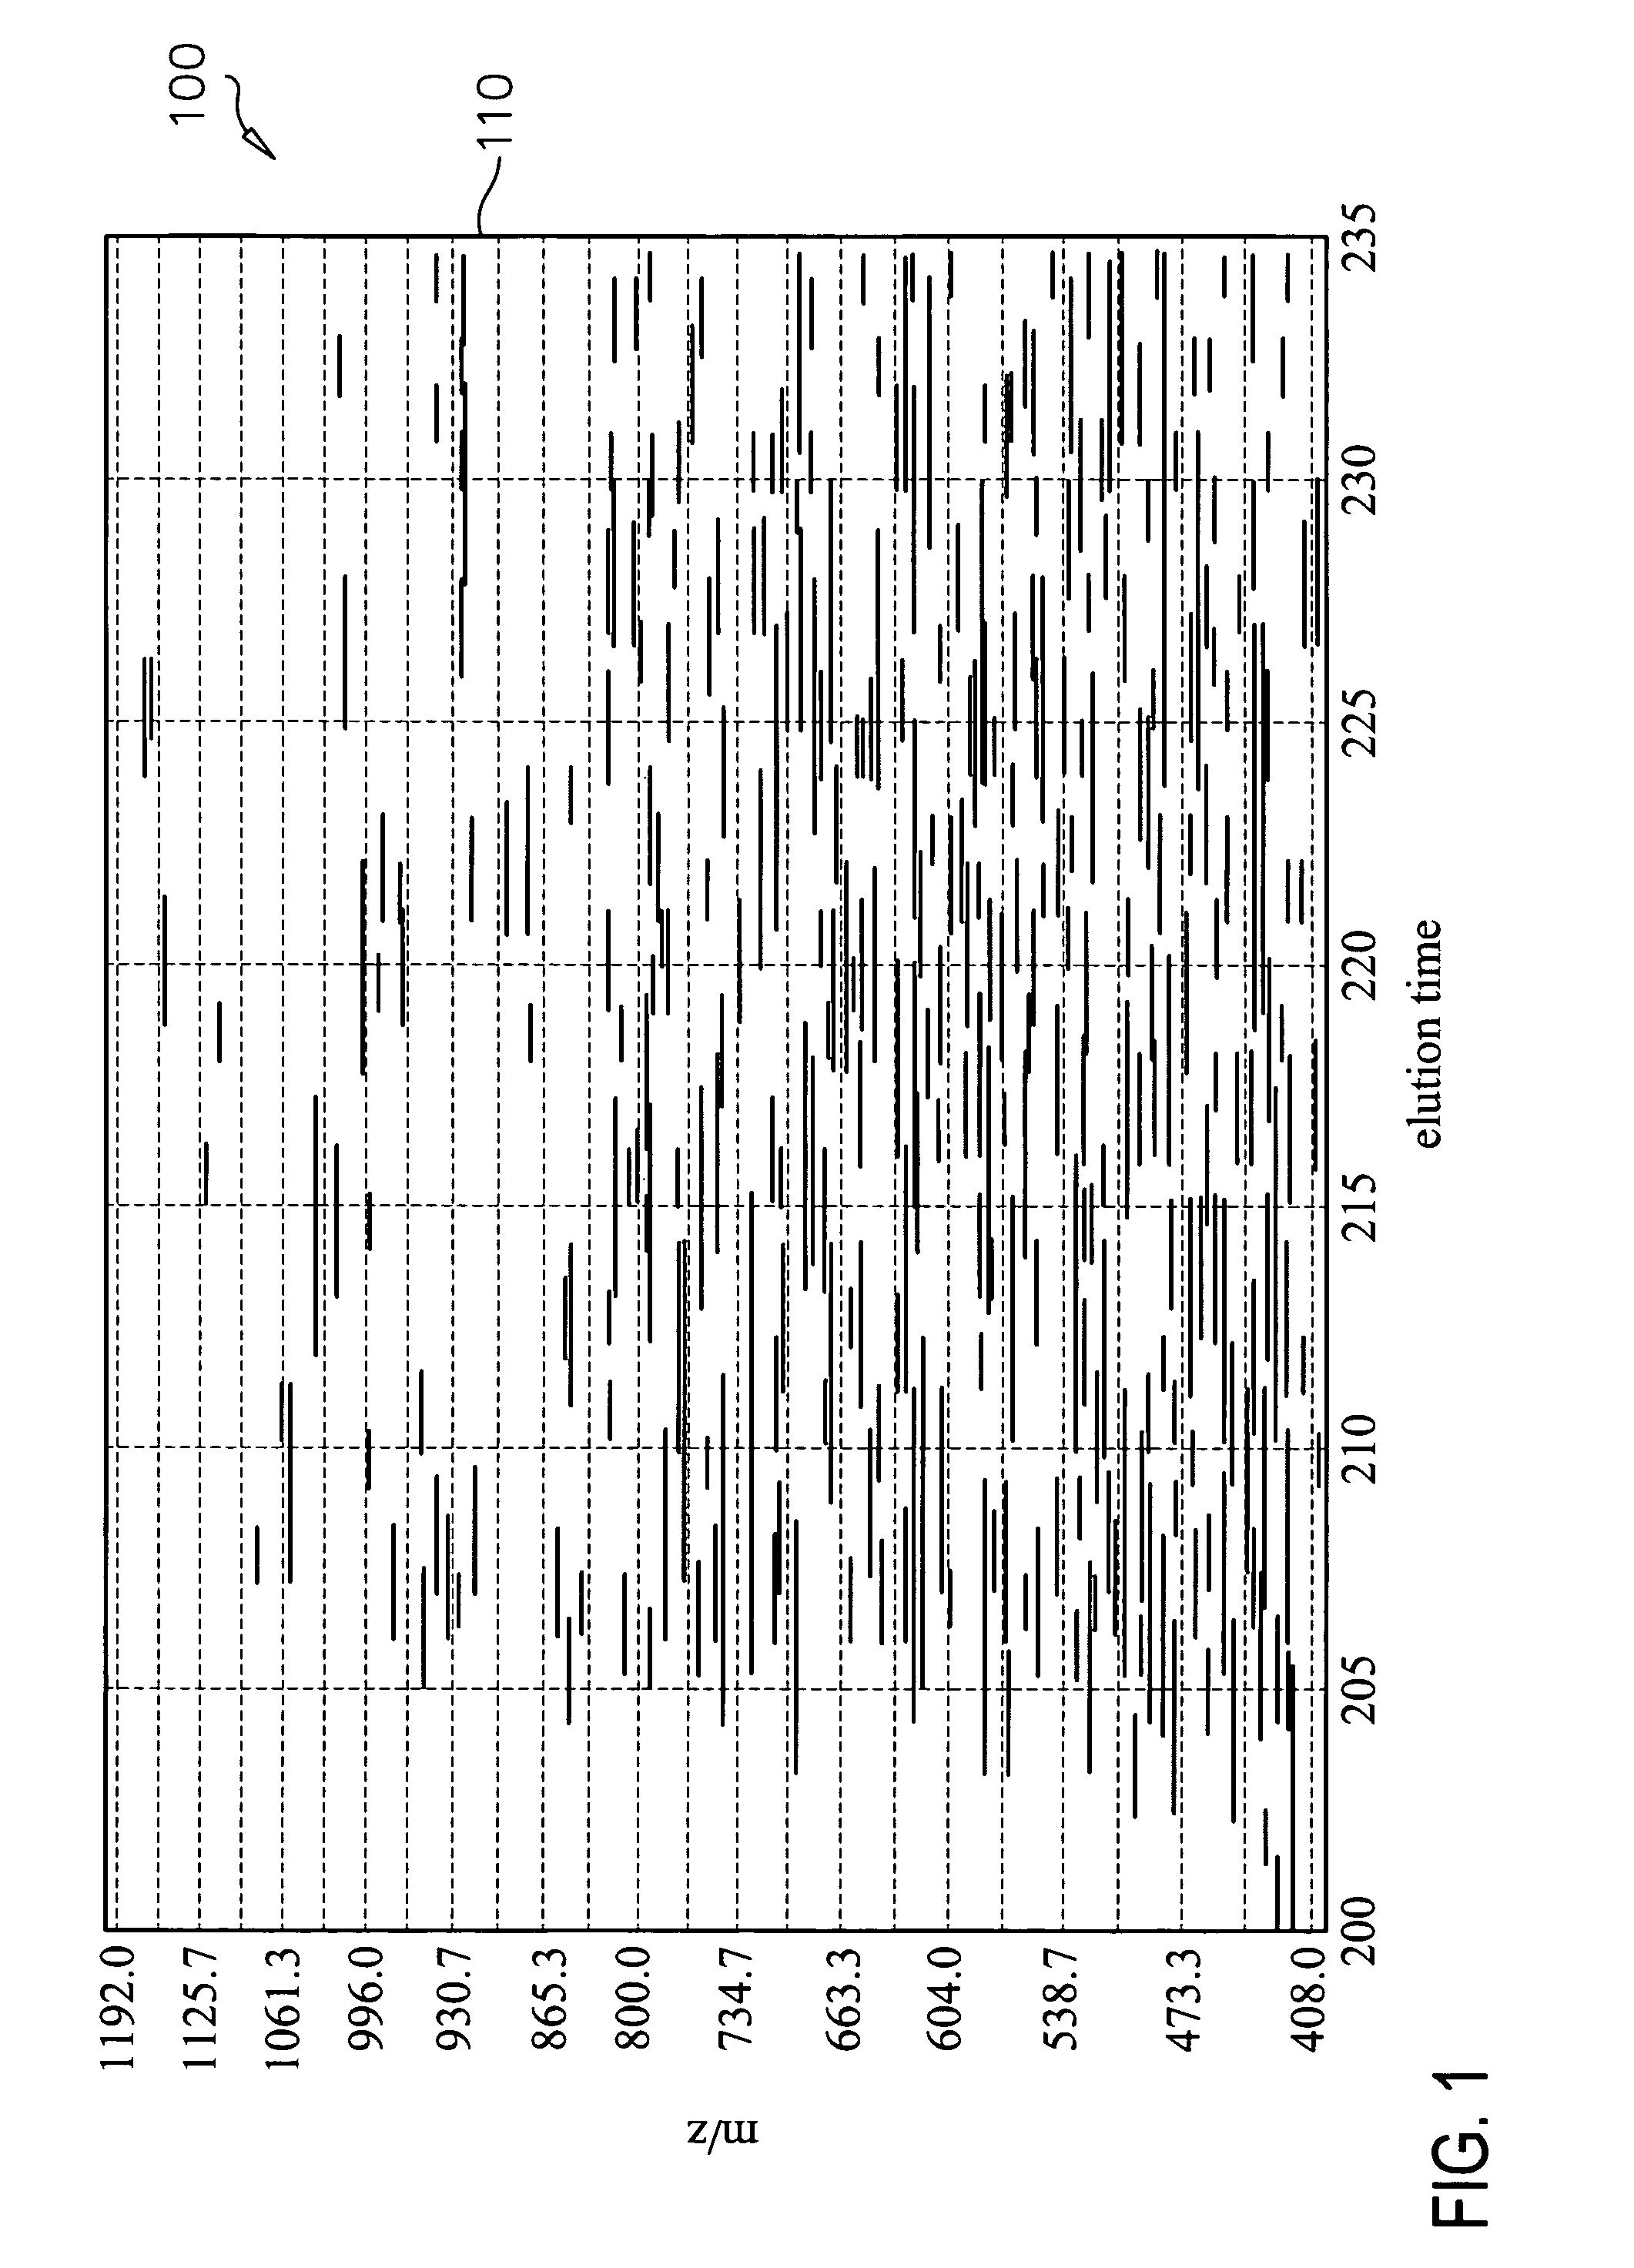
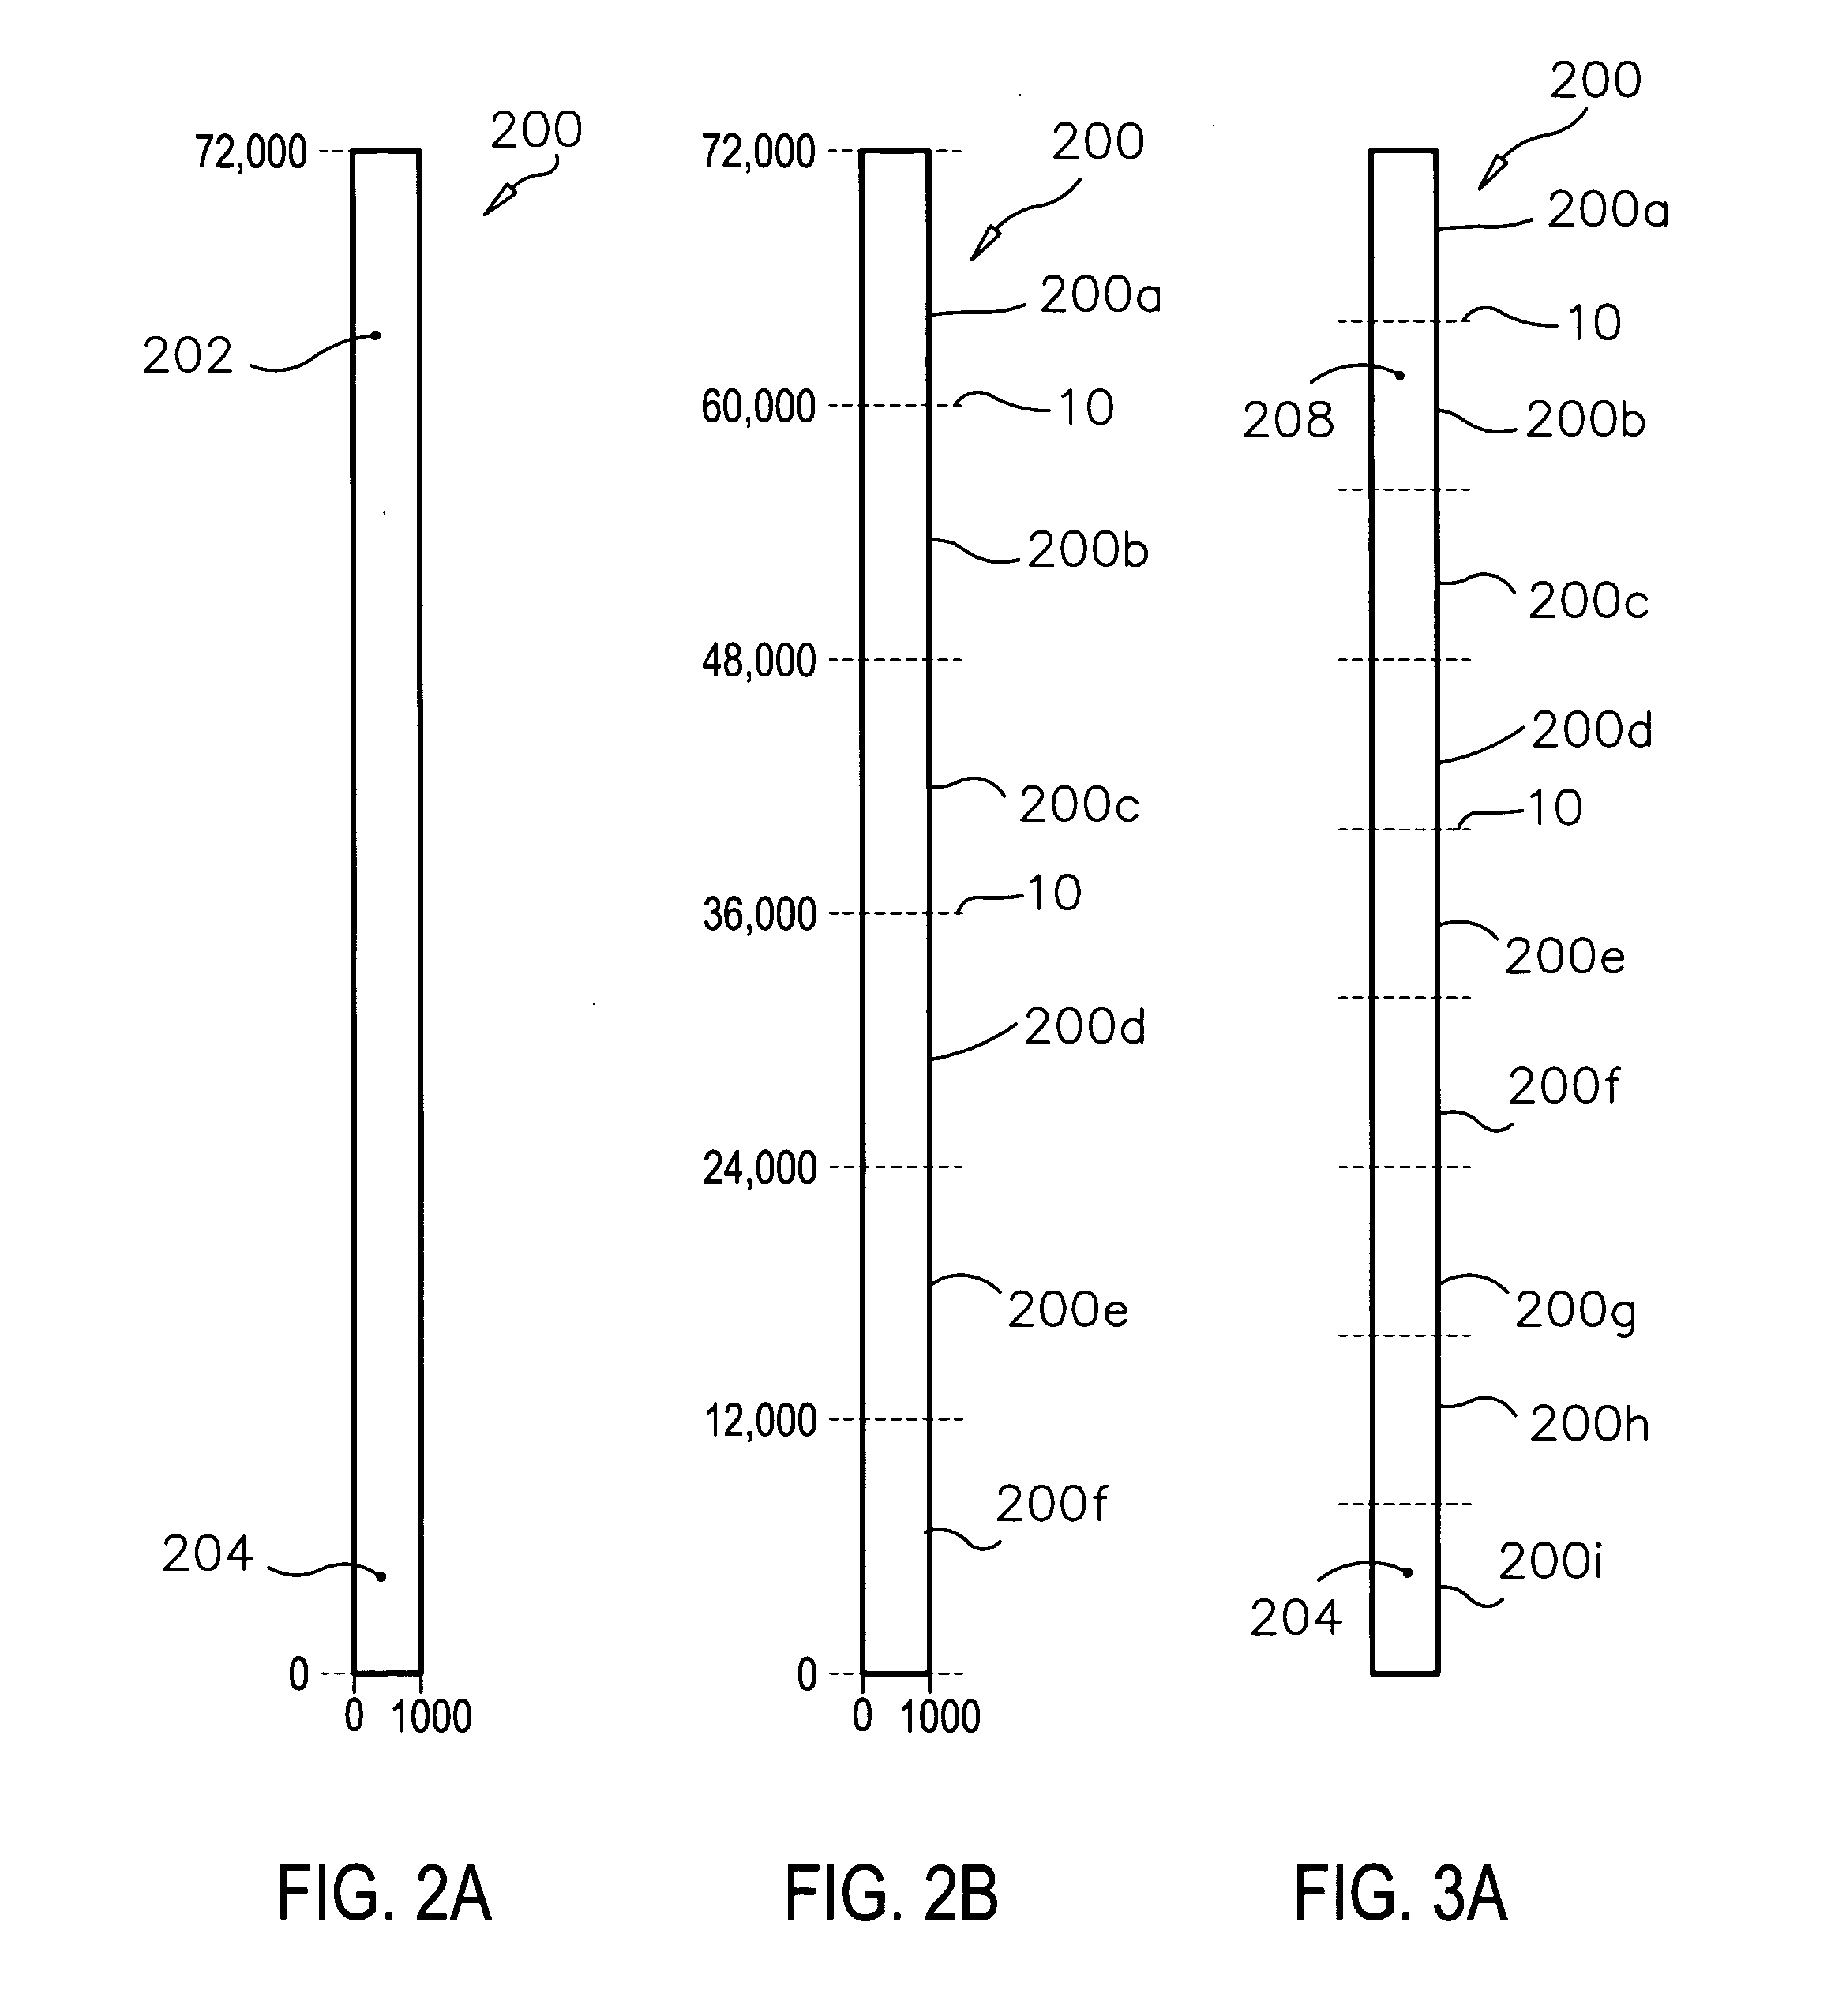
[0005] Methods, systems and recordable media are provided for manipulating large datasets for display, and displaying them. The present invention is particularly useful for datasets wherein a first dimension of the data to be displayed is much larger than a second dimension of the data to be displayed causing the dataset to be disproportional to a display on which the dataset is to be viewed. The dataset is subdivided along the first dimension to form segments of the dataset, each segment having a fraction of the first dimension and all of the second dimension. At least a subset of the segments formed are displayed adjacent one another on the display, thereby using the area of the display more efficiently.
[0014] The system further provides for user selection of less than all of the segments that are displayed, and zooming the selected segments to maximize use of the display, by displaying only the zoomed, selected segments. A variation for optimizing display of the selected segments includes subdividing the selected segments and then zooming them to maximize the display of the subdivided, selected segments.

Problems solved by technology

Such scaling may require compression, or even if no compression is used, the data is often reduced to a scale that is unreadable in the single image display.
However, when the number of rows and columns of data become significantly unequal or disproportionate, scaling of such datasets to fit on a single display gives results which are very difficult to work with, since scaling to reduce the larger number (of rows or columns, as it may be) overscales the smaller number (of rows or columns, respectively) to make the smaller dimensional virtually undetectable and unusable, since the overscaling often makes the smaller dimension virtually invisible with regard to individual cells of the rows (or columns) and even makes trends undetectable in many cases.

Method used


Image

  • Methods and system for visualizing data sets
  • Methods and system for visualizing data sets
  • Methods and system for visualizing data sets

Examples


Embodiment Construction

[0032] Before the present systems and methods are described, it is to be understood that this invention is not limited to particular data, software, hardware or method steps described, as such may, of course, vary. It is also to be understood that the terminology used herein is for the purpose of describing particular embodiments only, and is not intended to be limiting, since the scope of the present invention will be limited only by the appended claims.

[0033] Where a range of values is provided, it is understood that each intervening value, to the tenth of the unit of the lower limit unless the context clearly dictates otherwise, between the upper and lower limits of that range is also specifically disclosed. Each smaller range between any stated value or intervening value in a stated range and any other stated or intervening value in that stated range is encompassed within the invention. The upper and lower limits of these smaller ranges may independently be included or excluded...


PUM


Abstract

Methods, systems and recordable media for viewing large data sets having extremely disproportional dimensions on a symmetrical display. Data sets in matrix form having many more rows than columns or vice versa may be manipulated to make maximum use of a symmetrical display. Further data management processes facilitate navigation through large datasets and provide the ability to look at one or more portions of the data set in detail while still maintaining the context of the entire data set, or a larger portion of the dataset.

Description

FIELD OF THE INVENTION [0001] The present invention pertains to the field of data management. More particularly, the present invention relates to manipulation of large datasets having disproportional dimensions, for more efficient viewing and navigation of the data. BACKGROUND OF THE INVENTION[0002] Visualization of large scale datasets may be currently managed by scaling the data to fit on a single display. Such scaling may require compression, or even if no compression is used, the data is often reduced to a scale that is unreadable in the single image display. However, select regions of such a display may be panned to and / or zoomed in to make the data readable. This may provide a sense of the total context of the data, from the overall single display image of all the data, as well as some level of detail of a select portion or portions of the data. These approaches work fairly well for datasets that are more or less “square”, i.e., where the number of columns of the data is rough...

Claims


Application Information

Patent Timeline
IPC IPC(8): G06T11/20
CPCG06T11/203G06T11/20
Inventor OLD, WILLIAM M.THOMPSON, DEAN R.
Owner AGILENT TECH INC
Learn More