Graphical indicator
a graphical indicator and indicator technology, applied in the field of graphical indicators, can solve the problems of difficult printing of graphical indicators, errors in the analysis of images captured by optical devices, and small space between adjacent dots, so as to reduce the density of dots, improve the visual effect, and be flexible.
- Summary
- Abstract
- Description
- Claims
- Application Information
AI Technical Summary
Benefits of technology
Problems solved by technology
Method used
Image
Examples
Embodiment Construction
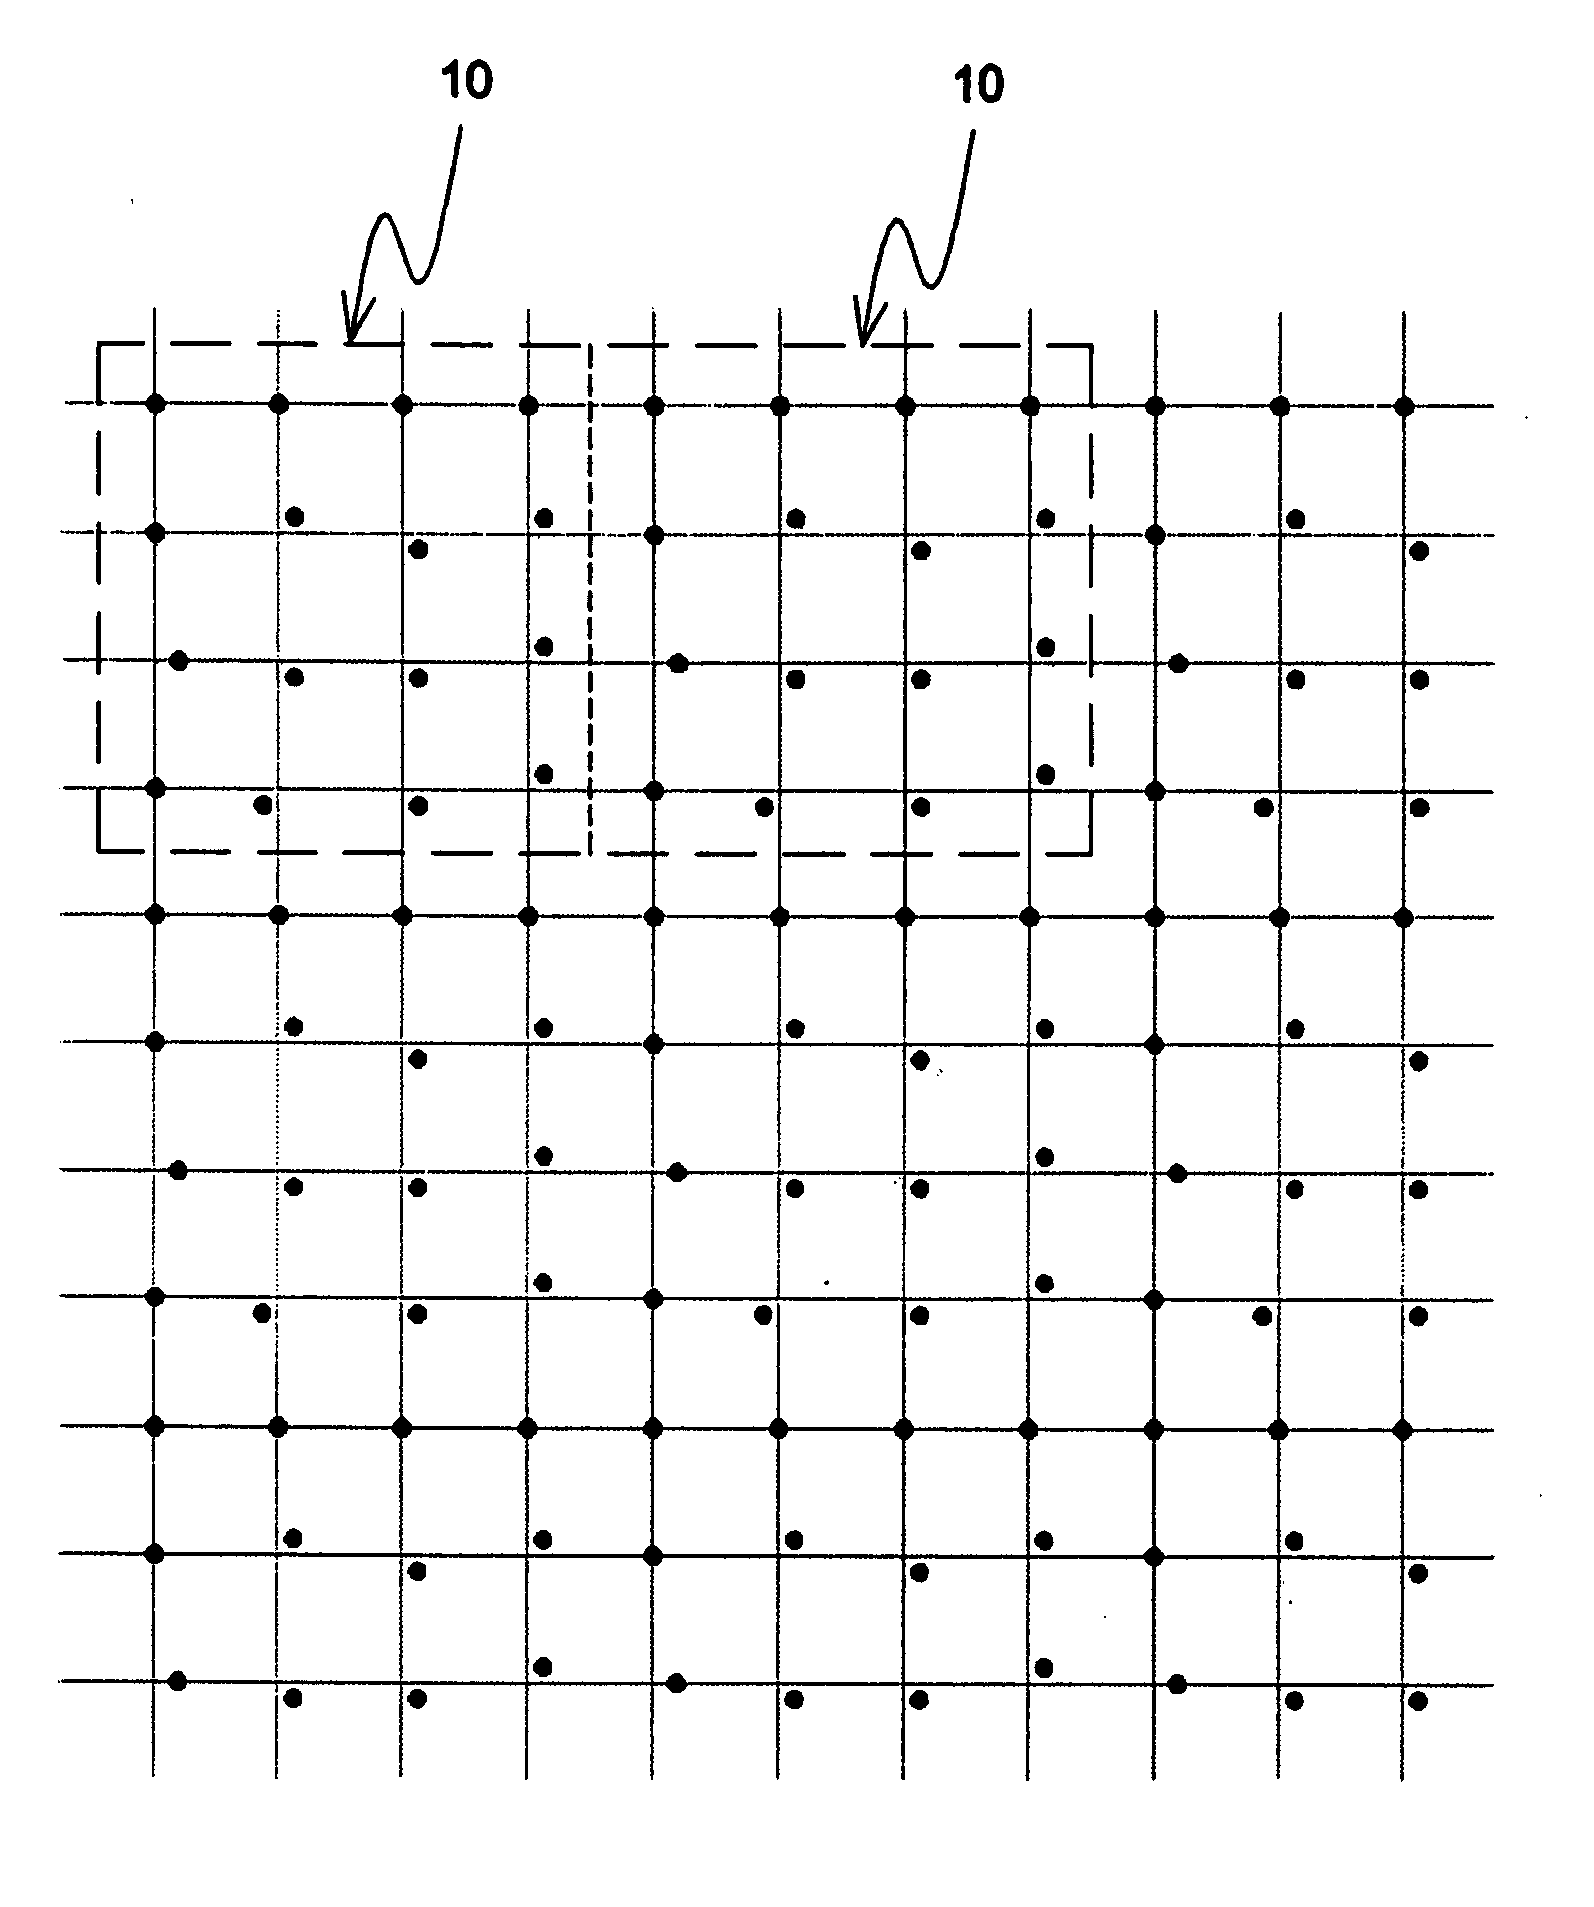
[0028]FIG. 4 shows a schematic diagram illustrating an arrangement of multiple graphical indicators 10 according to an embodiment of the invention. FIG. 5 shows an enlarged view of a graphical indicator 10 for clearly illustrating the design of the invention. Referring to FIG. 5, each graphical indicator 10 includes a content part 12 and a header part 14. In this embodiment, each content part 12 is spread with nine micro-units, namely nine dots 16, and is divided into nine state zones 18 arranged in a 3×3 two-dimensional array, so each state zone 18 is spread with one dot 16. According to this embodiment, when a dot 16 is to be placed in one state zone 18, it is placed to deviate from the center of one state zone 18 and toward its upper right, upper left, lower right, or lower left corner. In other words, as shown in FIG. 6, in case each state zone is equally divided into four hypothetical sections, a dot 16 placed in any of the four hypothetical sections may form four candidate sta...
PUM
 Abstract
Description
Claims
Application Information
 - R&D
- Intellectual Property
- Life Sciences
- Materials
- Tech Scout
- Unparalleled Data Quality
- Higher Quality Content
- 60% Fewer Hallucinations
Browse by: Latest US Patents, China's latest patents, Technical Efficacy Thesaurus, Application Domain, Technology Topic, Popular Technical Reports.
© 2025 PatSnap. All rights reserved.Legal|Privacy policy|Modern Slavery Act Transparency Statement|Sitemap|About US| Contact US: help@patsnap.com


