
Method and System for Display Of Business Intelligence Data

a business intelligence and data technology, applied in the field of business intelligence, can solve the problems of difficult to read charts, inability to follow particulars, and inability to always be satisfactory, and achieve the effect of viewing data with eas

Inactive Publication Date: 2008-02-21
LINKEDIN
View PDF8 Cites 39 Cited by
  • Summary
  • Abstract
  • Description
  • Claims
  • Application Information

AI Technical Summary

Benefits of technology

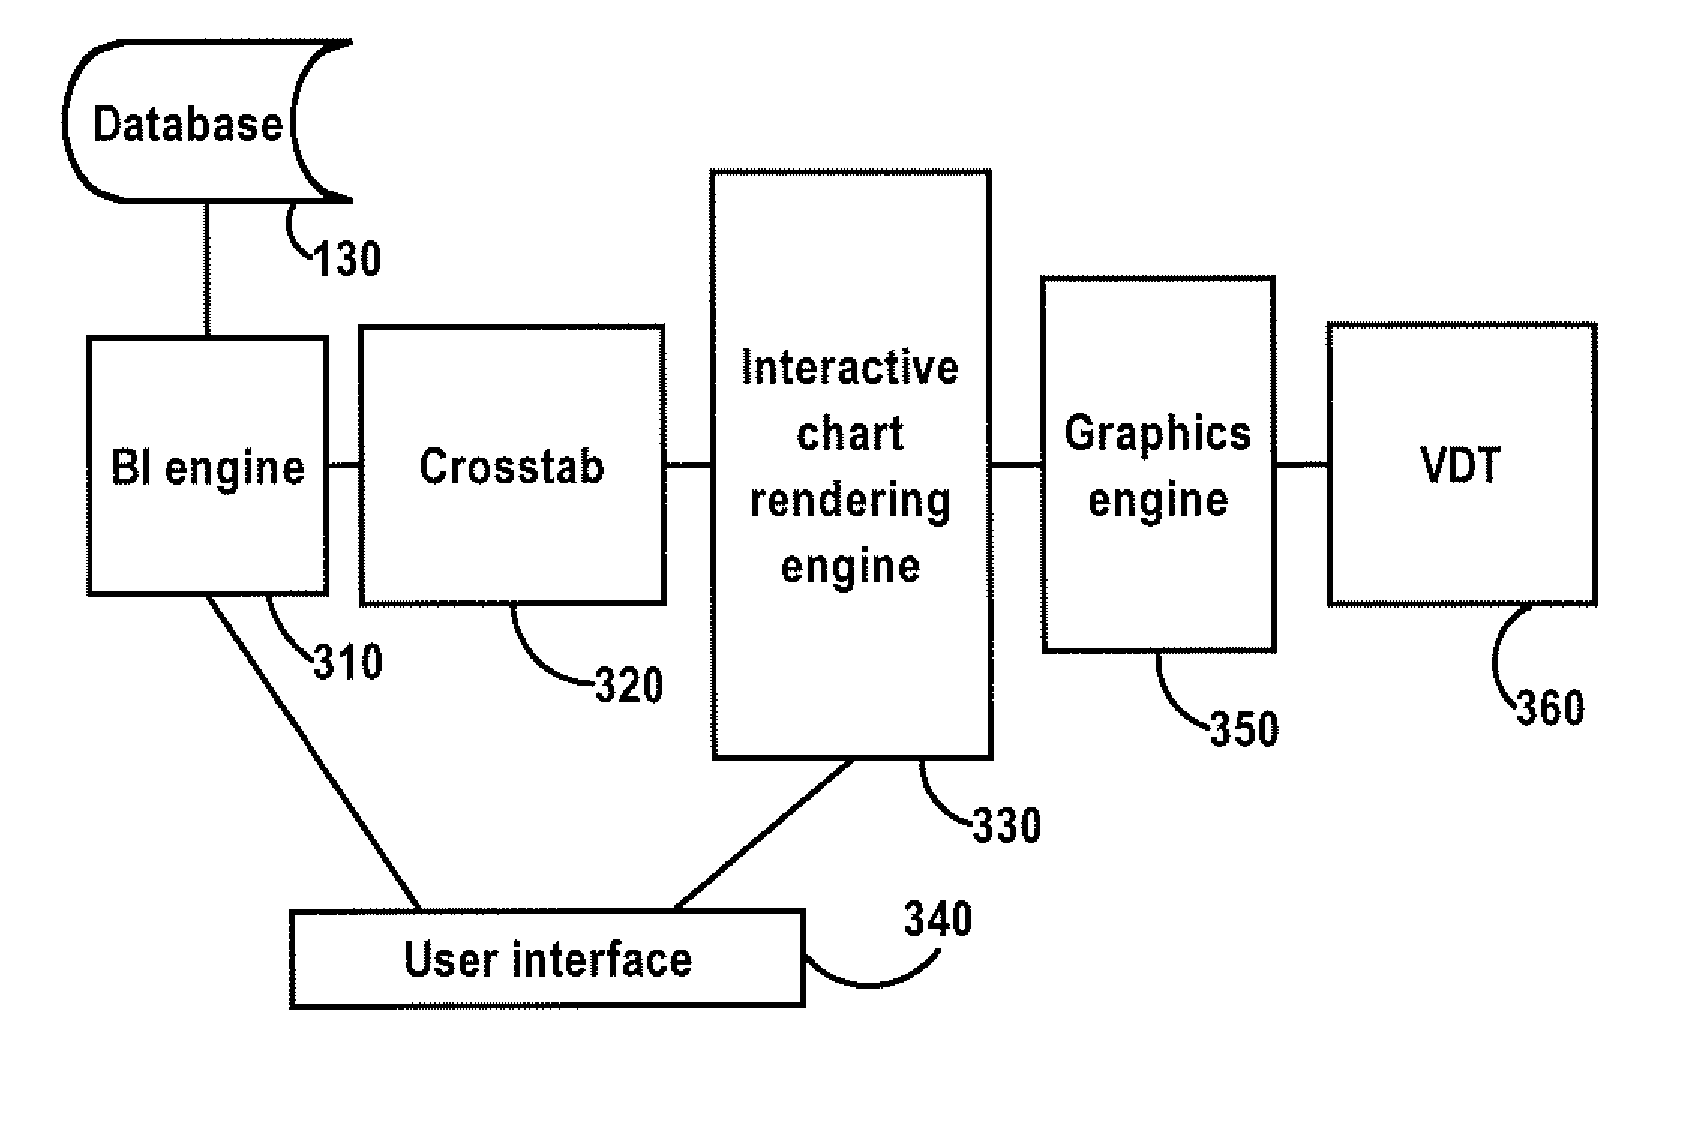
[0019]Thus, when asked to create a chart with large amounts of data, applications making use of the invention render the data such that the user can view the data with ease.
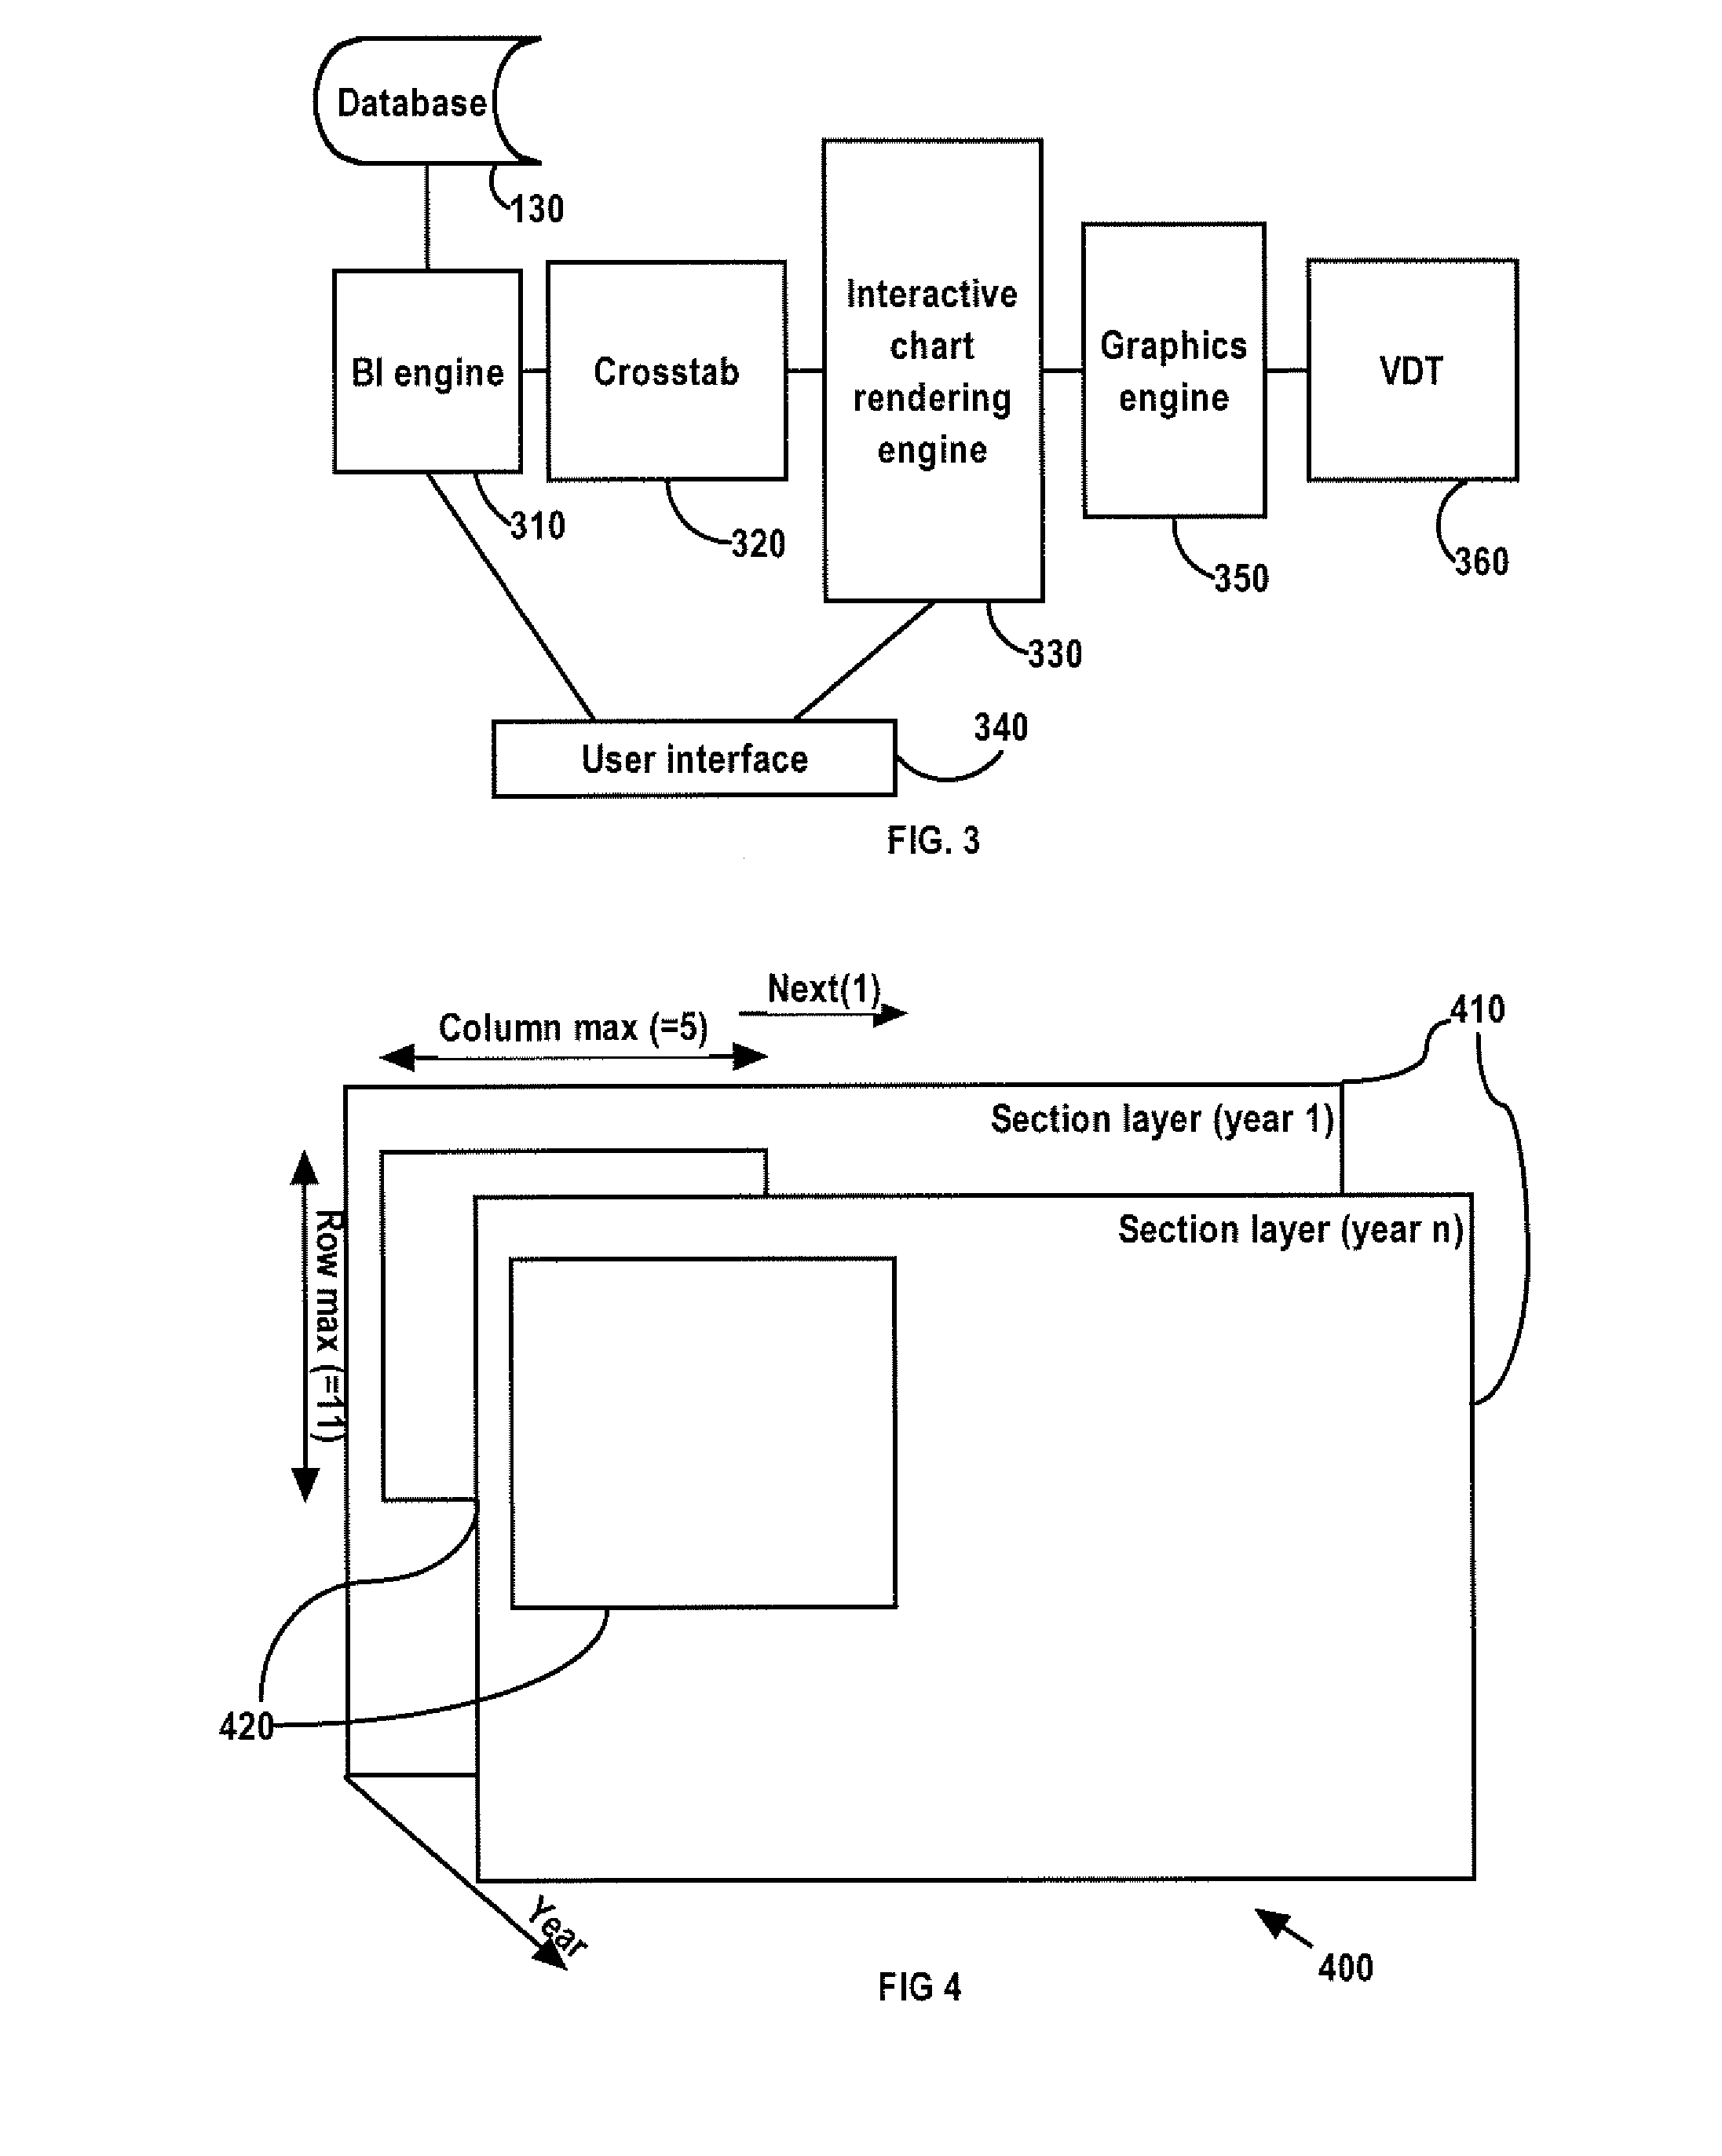
[0023]Providing ‘edge tools’ that permit a degree of continuity between pages and limit the potential confusion of users, or

Problems solved by technology

Currently companies often use different reporting tools for different applications However, in rendering result sets, the user is all too often presented with a chart that contains illegible information, such as having columns that are so narrow that their colour is not distinguishable, or having so many lines that it is impractical to follow a particular series.
For instance, if a chart has 1000 categories and 1000 legend entries, rendering all this data in one chart would produce a chart that is almost impossible to read.
The results have not always been satisfactory.

Method used


Image

  • Method and System for Display Of Business Intelligence Data
  • Method and System for Display Of Business Intelligence Data
  • Method and System for Display Of Business Intelligence Data

Examples


Embodiment Construction

[0040]Reference will now be made in detail to some specific embodiments of the invention including the best modes contemplated by the inventors for carrying out the invention. Examples of these specific embodiments are illustrated in the accompanying drawings. While the invention is described in conjunction with these specific embodiments, it will be understood that it is not intended to limit the invention to the described embodiments. On the contrary, it is intended to cover alternatives, modifications, and equivalents as may be included within the spirit and scope of the invention as defined by the appended claims. In the following description, numerous specific details are set forth in order to provide a thorough understanding of the present invention. The present invention may be practiced without some or all of these specific details. In other instances, well known process operations have not been described in detail in order not to unnecessarily obscure the present invention....


PUM


Abstract

The invention provides improved mechanisms for the construction and rendering of graphical results sets for business intelligence reports derived from large volumes of data. This is achieved by various means including, determining the amount of useful data that can be rendered within the available display space while still being legible, determining the most effective way of displaying that data within the display space, and providing for limited control of the format and quantity of data displayed.

Description

CROSS-REFERENCE TO RELATED APPLICATIONS[0001]Not ApplicableSTATEMENT REGARDING FEDERALLY SPONSORED RESEARCH OR DEVELOPMENT[0002]Not ApplicableREFERENCE TO A SEQUENCE LISTING[0003]Not ApplicableFIELD OF INVENTION[0004]This invention relates to business intelligence. More specifically, this invention relates to the construction and rendering of graphical results sets for business intelligence reports.BACKGROUND OF THE INVENTION[0005]In complex business intelligence systems, it is common to produce charts to assist in interpreting data.[0006]Web-based enterprise reporting solutions can be designed to address a full range of reports, including production reports such as invoices and statements, statutory reports, and business and analytical reports. Currently companies often use different reporting tools for different applications However, in rendering result sets, the user is all too often presented with a chart that contains illegible information, such as having columns that are so na...

Claims


Application Information

Patent Timeline
IPC IPC(8): G06F17/00G06Q10/00G06F17/30G06F9/44G06T11/20G06F3/048
CPCG06F3/0481G06F17/30572G06F3/0485G06F16/26
Inventor SHEWCHENKO, NADIAHOFFMANN, HENNINGCHANG, ROGERGRIGNON, LESLEY
Owner LINKEDIN
Learn More