Graphical Database Interaction System and Method

a database and interaction system technology, applied in the field of graphical database interaction system and method, can solve the problems of not allowing the user to query the data itself, not allowing the user to query other data, and the database can easily contain far too much information for a human analyst to easily explore and interpret the contents, etc., to achieve clear understanding of the model and quickly explore the contents of the database.

Active Publication Date: 2008-08-14
IQVIA MARKET INTELLIGENCE LLC
View PDF18 Cites 36 Cited by
  • Summary
  • Abstract
  • Description
  • Claims
  • Application Information

AI Technical Summary

Benefits of technology

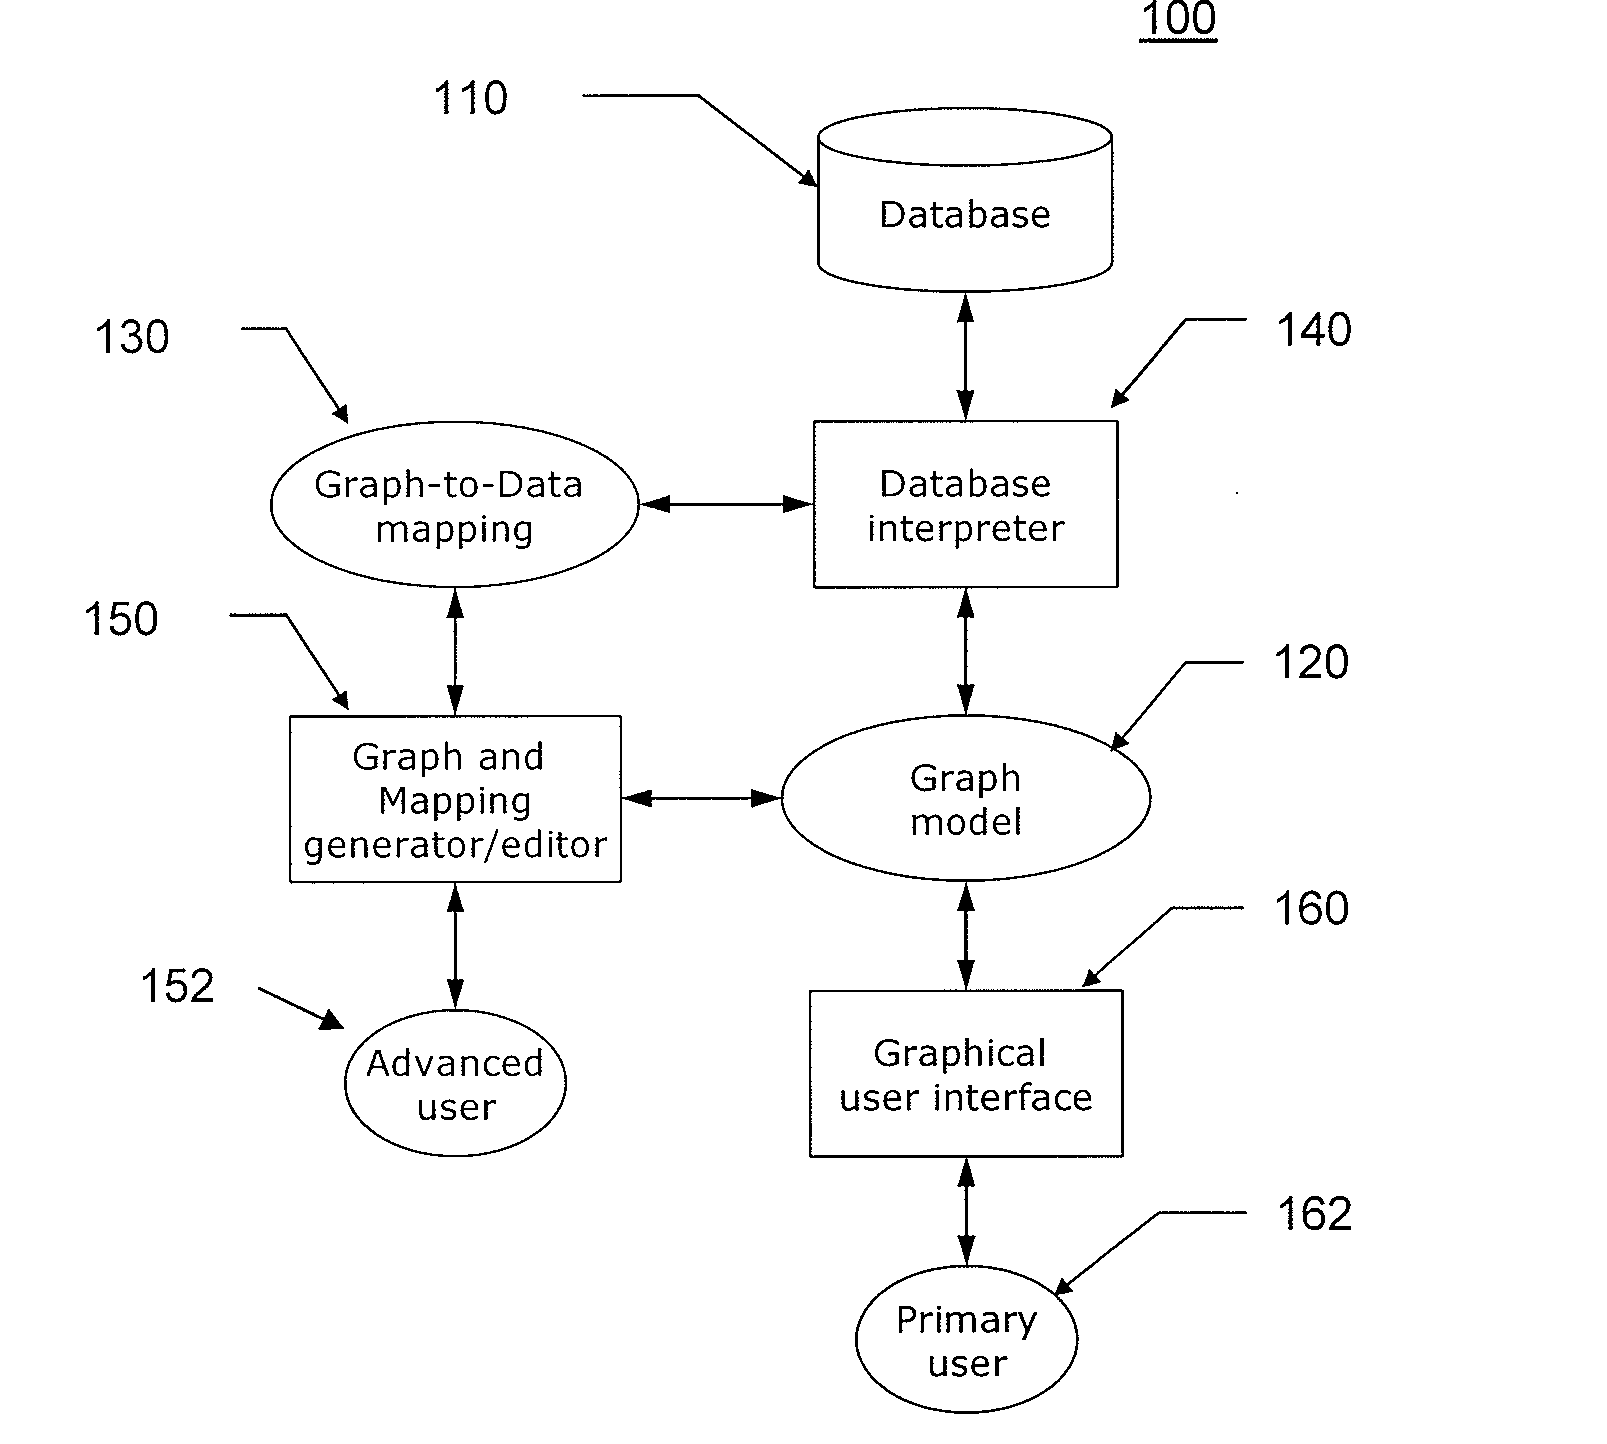
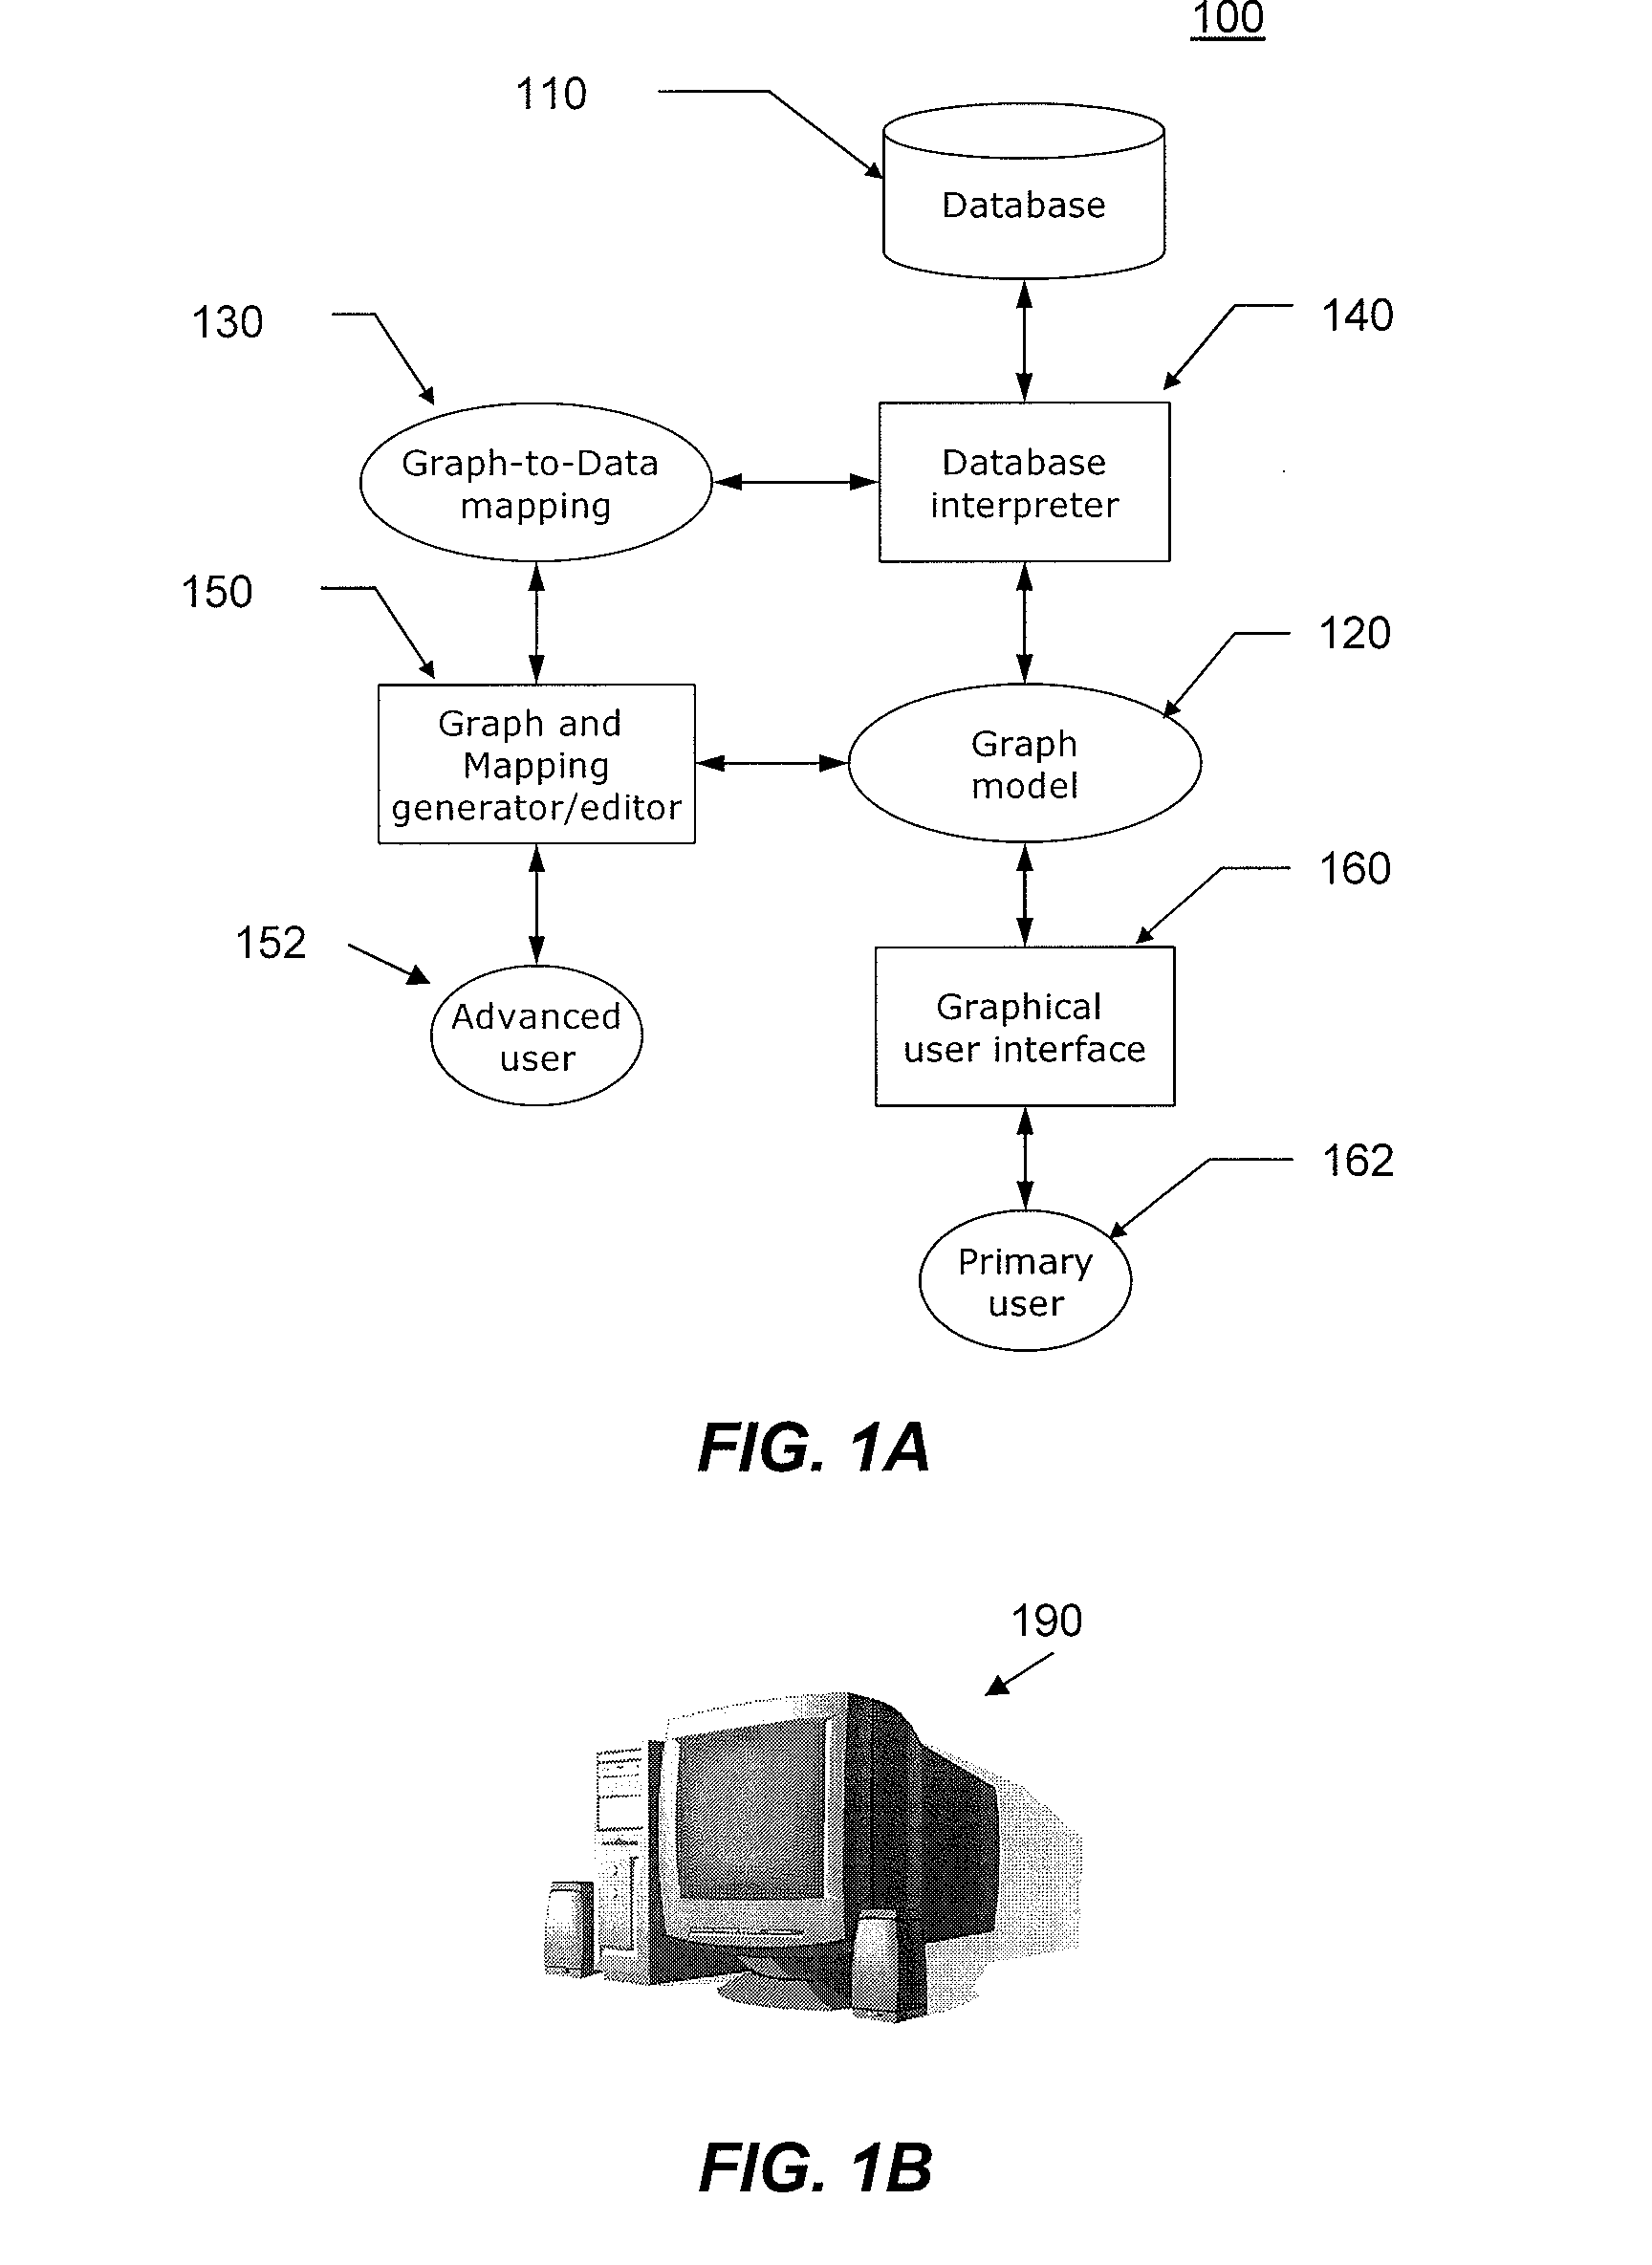
[0015]The user interfaces for interacting with Bayesian networks provide a convenient means for selecting a subset of possible values and displaying the impact on the distributions of related nodes. Through such graphical interaction, a human analyst is able to explore the interrelationships and gain a clearer understanding of the model. However, such interactive interfaces are lacking in database and data reporting packages. Consequently, there is a need to provide such an interactive interface that enables a user to quickly explore the contents of a database, without the need for estimating models or viewing results that do not exactly match the data.

Problems solved by technology

However, a database can easily contain far too much information for a human analyst to easily explore and interpret the contents.
Although these applications allow the user to specify a set of inclusion criteria and formatting of the graphical representation, the graphical summaries are essentially static depictions, and they generally do not allow the user to query the data itself via the graphical representation.
However, clicking on a particular bar in the chart does not allow the user to query other data in the database that is associated with the data represented by the bar.
Thus, current applications offer an inefficient means of analyzing data because a user must repeat the steps of creating a particular graphical representation of data many times over in order to organize data in a variety of ways.
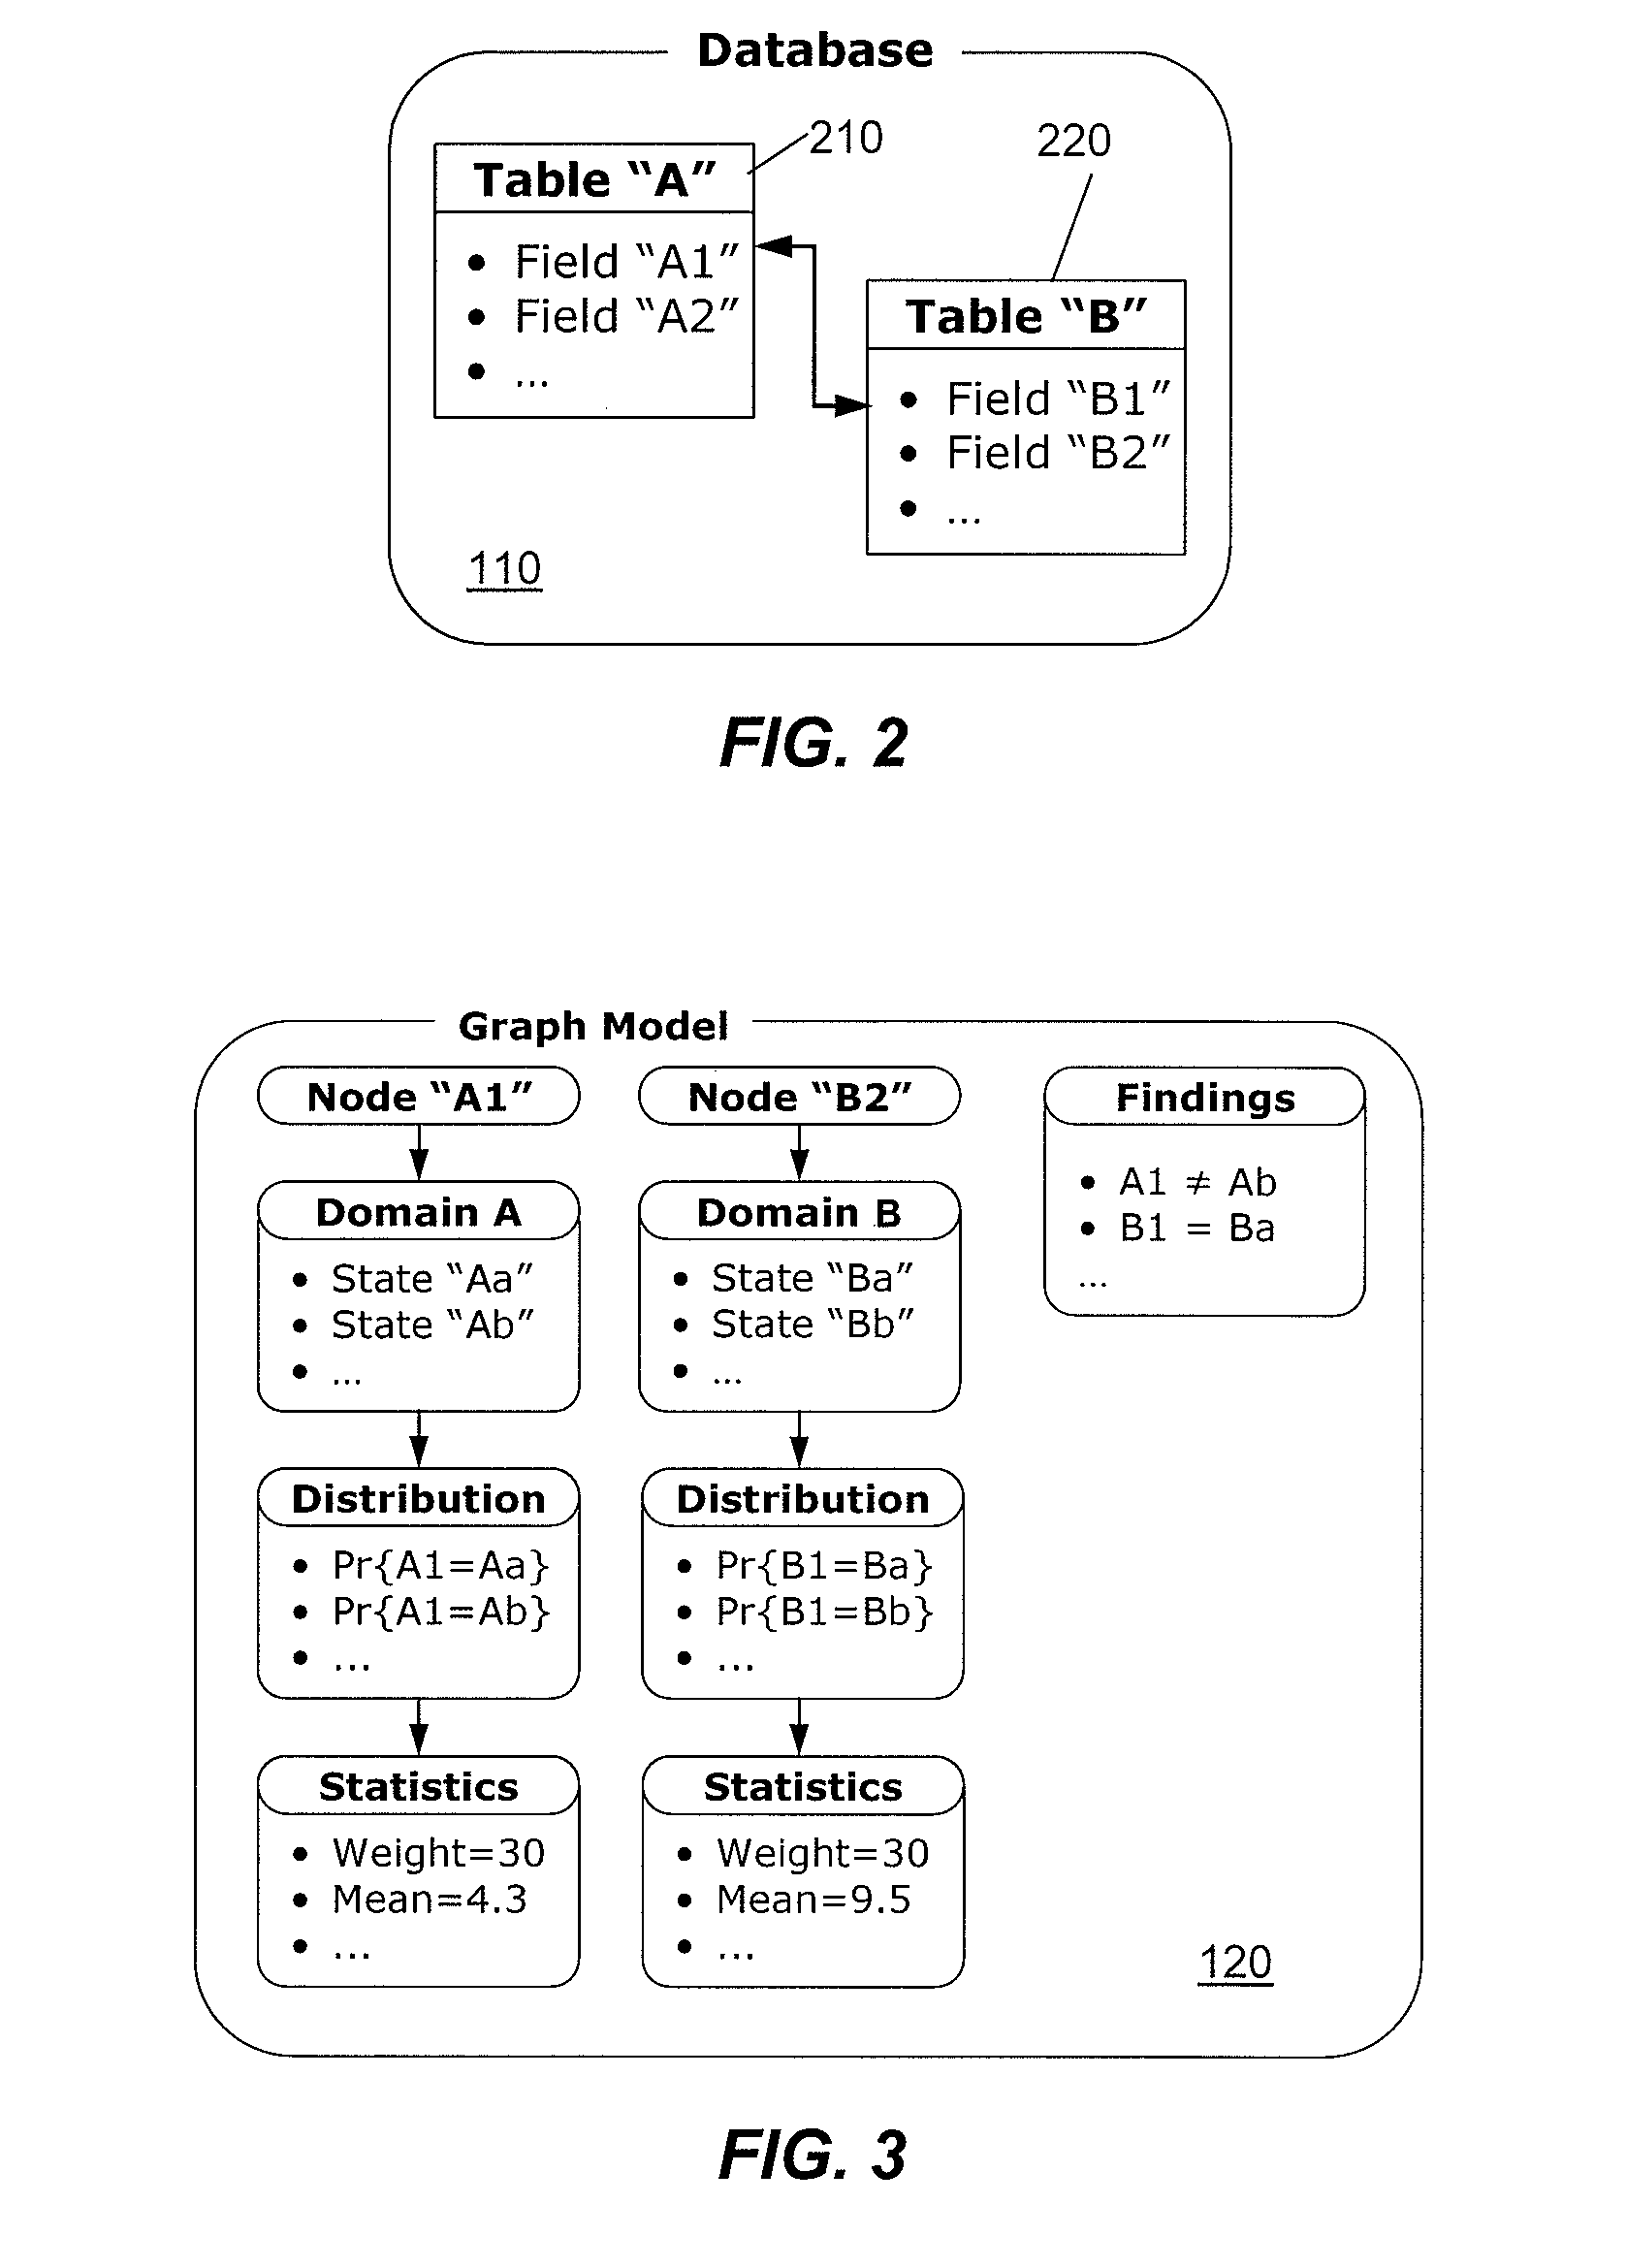
However, these applications do not provide a graphical model in which nodes represent fields rather than tables, and arcs represent statistical relationships rather than foreign-key relationships.
However, these graphical Bayesian networks do not directly display the contents of the database.
For large and / or complex networks, the approximation error due to modeling can be substantial, particularly when the analysis drills down into subsets of the probability space associated with the model.
However, such a Bayesian network would require a number of parameters that increases exponentially with the number of nodes and states in the network and, as a result, is not practical.
However, such interactive interfaces are lacking in database and data reporting packages.

Method used


Image

  • Graphical Database Interaction System and Method
  • Graphical Database Interaction System and Method
  • Graphical Database Interaction System and Method

Examples


Embodiment Construction

[0095]It will be understood that, although the terms first, second, etc. can be used herein to describe various elements, these elements should not be limited by these terms. These terms are used to distinguish one element from another, but not to imply a required sequence of elements. For example, a first element can be termed a second element, and, similarly, a second element can be termed a first element, without departing from the scope of the present invention. As used herein, the term “and / or” includes any and all combinations of one or more of the associated listed items.

[0096]It will be understood that when an element is referred to as being “on” or “connected” or “coupled” to another element, it can be directly on or connected or coupled to the other element or intervening elements can be present. In contrast, when an element is referred to as being “directly on” or “directly connected” or “directly coupled” to another element, there are no intervening elements present. Oth...


PUM


Abstract

Various aspects of the present invention include a database interaction system and method comprising: a display, a set of user input devices, and a database comprising a data set including a plurality of fields and associated field values; a graph model configured to define a plurality of nodes and states, each node representing a field from the plurality of fields; a graph-to-data mapper configured to map the field values to states contained in the nodes of the graph model; and a graphical interface module configured to generate for display one or more nodes from the plurality of nodes, wherein a display of a node includes a graphical representation of field values associated with a specific field represented by the displayed node and states contained therein.

Description

CROSS REFERENCE TO RELATED APPLICATION[0001]This application claims the benefit under 35 U.S.C. §119(e) of U.S. Provisional Application No. 60 / 888,822, filed Feb. 8, 2007, entitled GRAPHICAL DATABASE INTERACTION SYSTEM AND METHOD.FIELD OF INTEREST[0002]The present inventive concepts relate to the field of databases and approaches for graphical representation, navigation and manipulation of same.BACKGROUND[0003]Many graphical user interfaces have been developed for presenting the contents of a database. Such systems include (a) spreadsheet packages, such as Microsoft Excel and Lotus 1-2-3, (b) database systems, such as Microsoft Access and Microsoft SQL Server, (c) statistical packages such as SAS and SPSS, (d) statistical crosstab analysis packages such as Quantum, (e) business intelligence systems, such as Microstrategy and Hyperion, and (f) data mining systems such as SAS Enterprise Miner.[0004]All of these packages provide graphical user interfaces by which users can query the re...

Claims


Application Information

Patent Timeline
Patent Type & Authority Applications(United States)
IPC IPC(8): G06F17/30
CPCY10S715/967G06F17/3056G06F16/252
Inventor SHETH-VOSS, PIETERCOONEY, GEOFFREY
Owner IQVIA MARKET INTELLIGENCE LLC
Why Eureka
Try Eureka