

Analysis of Database Performance Reports for Graphical Presentation of Summary Results
a database and summary results technology, applied in the field of problem determination methods, can solve problems such as difficult problem diagnosis in a distributed database environment, inability to examine problems, and problems that appear for a limited amount of time to disappear
- Summary
- Abstract
- Description
- Claims
- Application Information
AI Technical Summary
Problems solved by technology
Method used
Image

Examples
Embodiment Construction
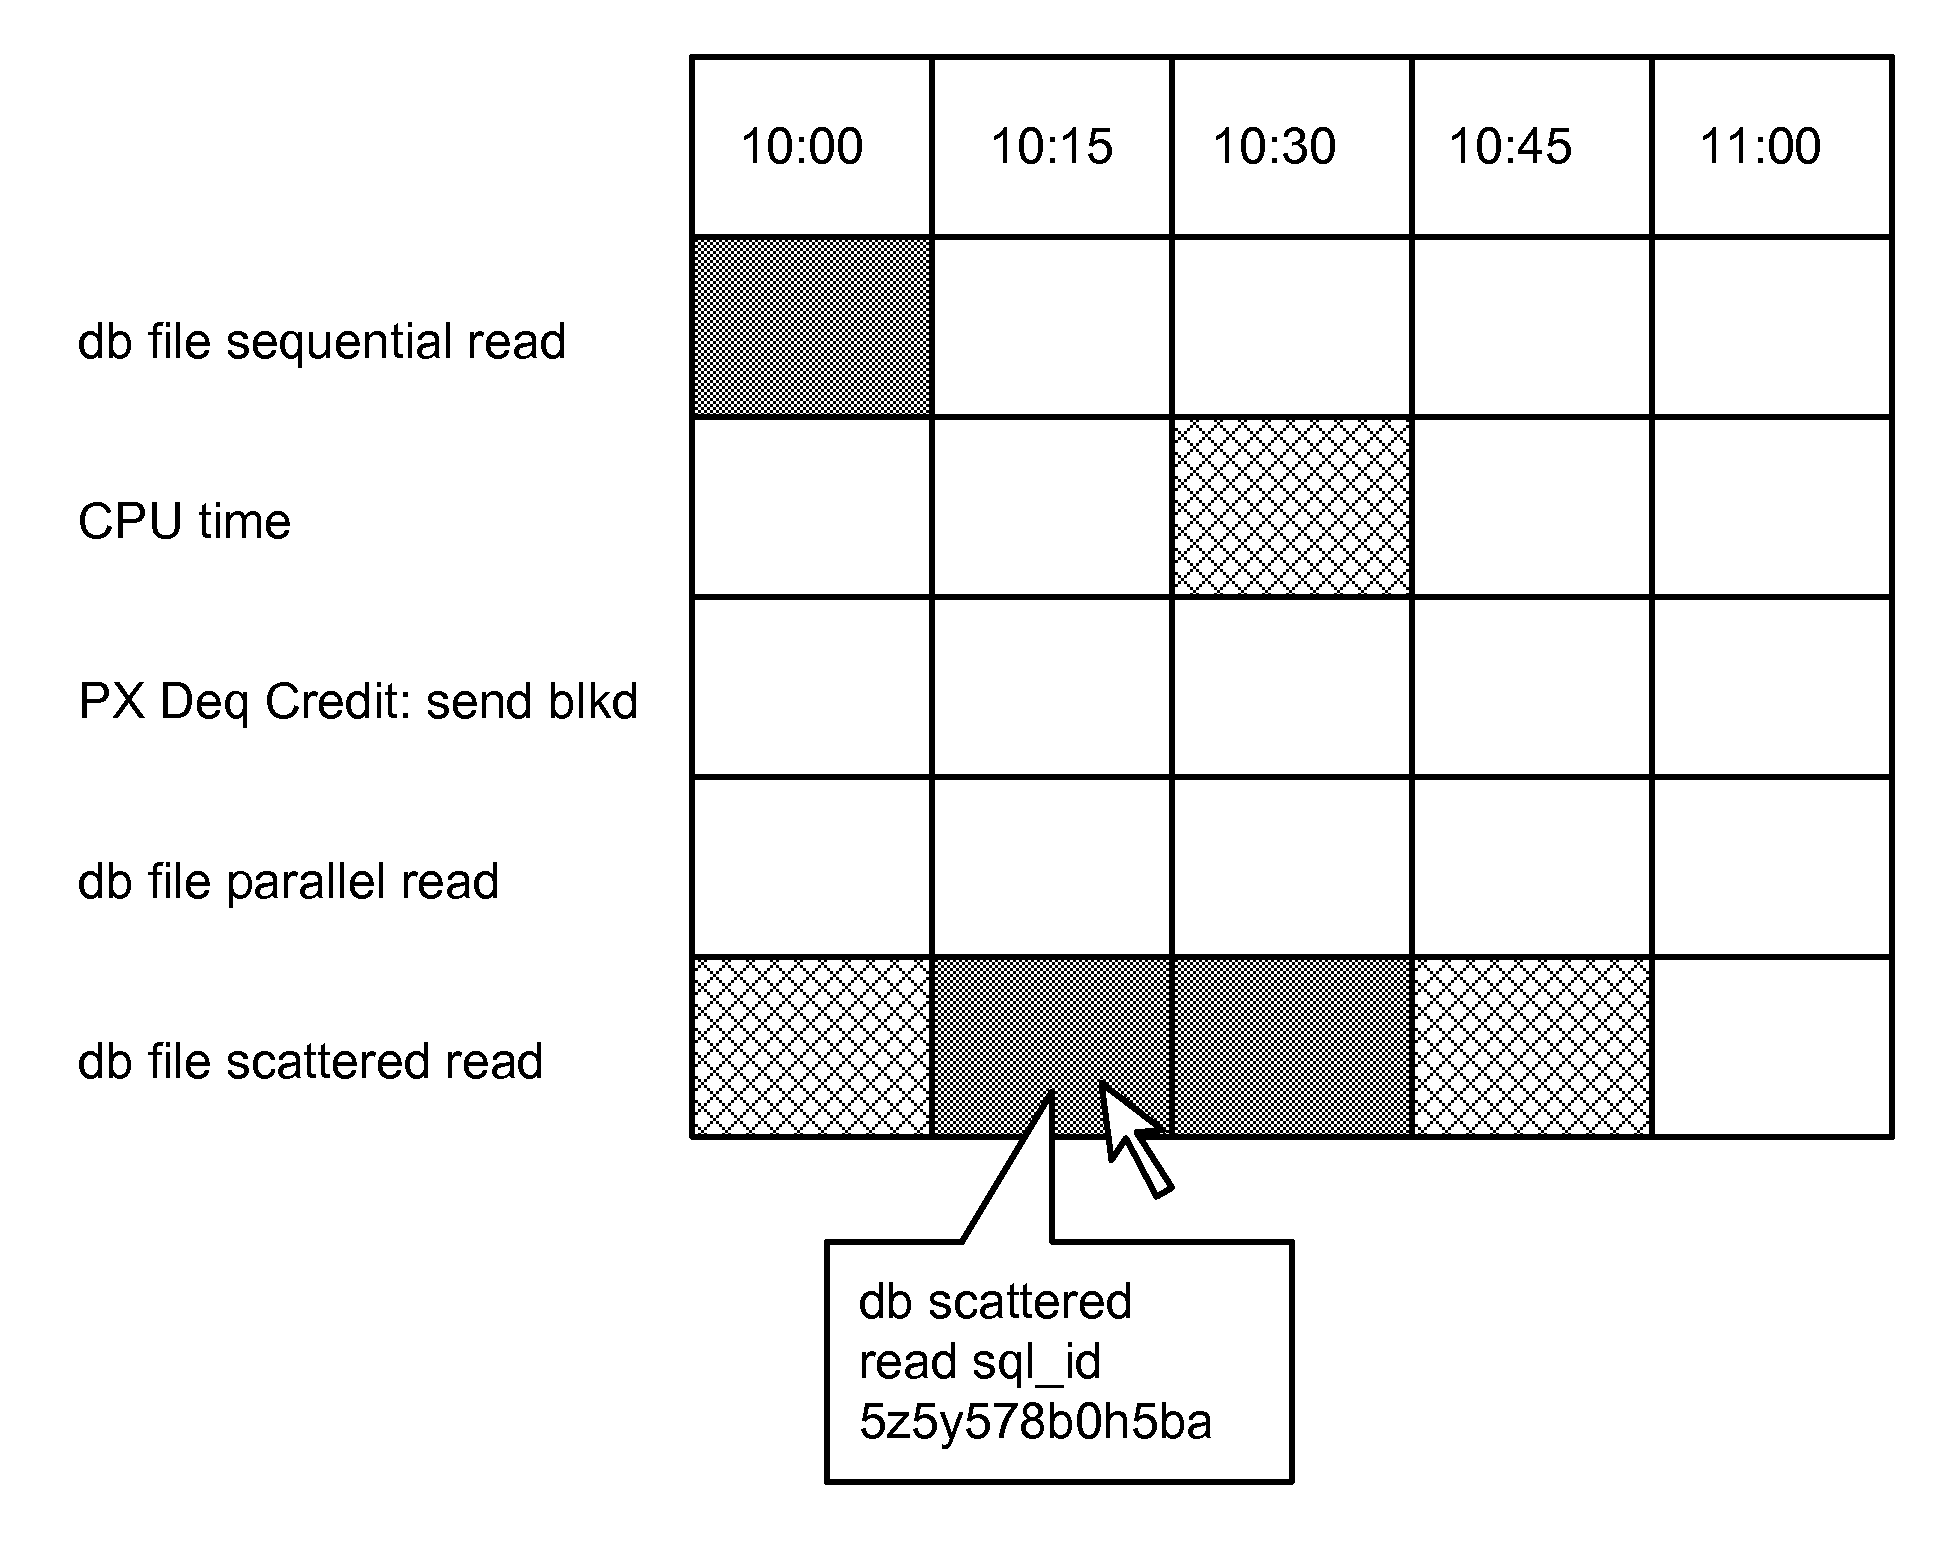
[0019]Computer implemented methods, programs and systems for displaying statistical data in a graphical user interface are provided. According to the method, baseline data is imported from a first report which corresponds to a trouble-free period where the system is operating satisfactorily. Critical data is imported from a second report corresponding to a trouble period that has been identified as encompassing one or more performance problems. The imported data is compared and analyzed to create a results table, each cell in the results table corresponding to a timestamp and a statistical item. The cells in the results table contain a visual identifier according to the criticality of the comparison of the statistical items from the baseline data and the critical data. The results table is presented on a display to the user in a graphical manner for easy access.
[0020]The following embodiments describe a method and apparatus for displaying statistical data in a graphical user interfa...
PUM
 Abstract
Description
Claims
Application Information