

Computer system performance analysis
a computer system and performance analysis technology, applied in the field of computer system performance analysis, can solve the problems that existance performance analysis tools only can provide, and achieve the effect of improving the recognition rate and accuracy of hotspot identification
- Summary
- Abstract
- Description
- Claims
- Application Information
AI Technical Summary
Benefits of technology
Problems solved by technology
Method used
Image

Examples
first embodiment
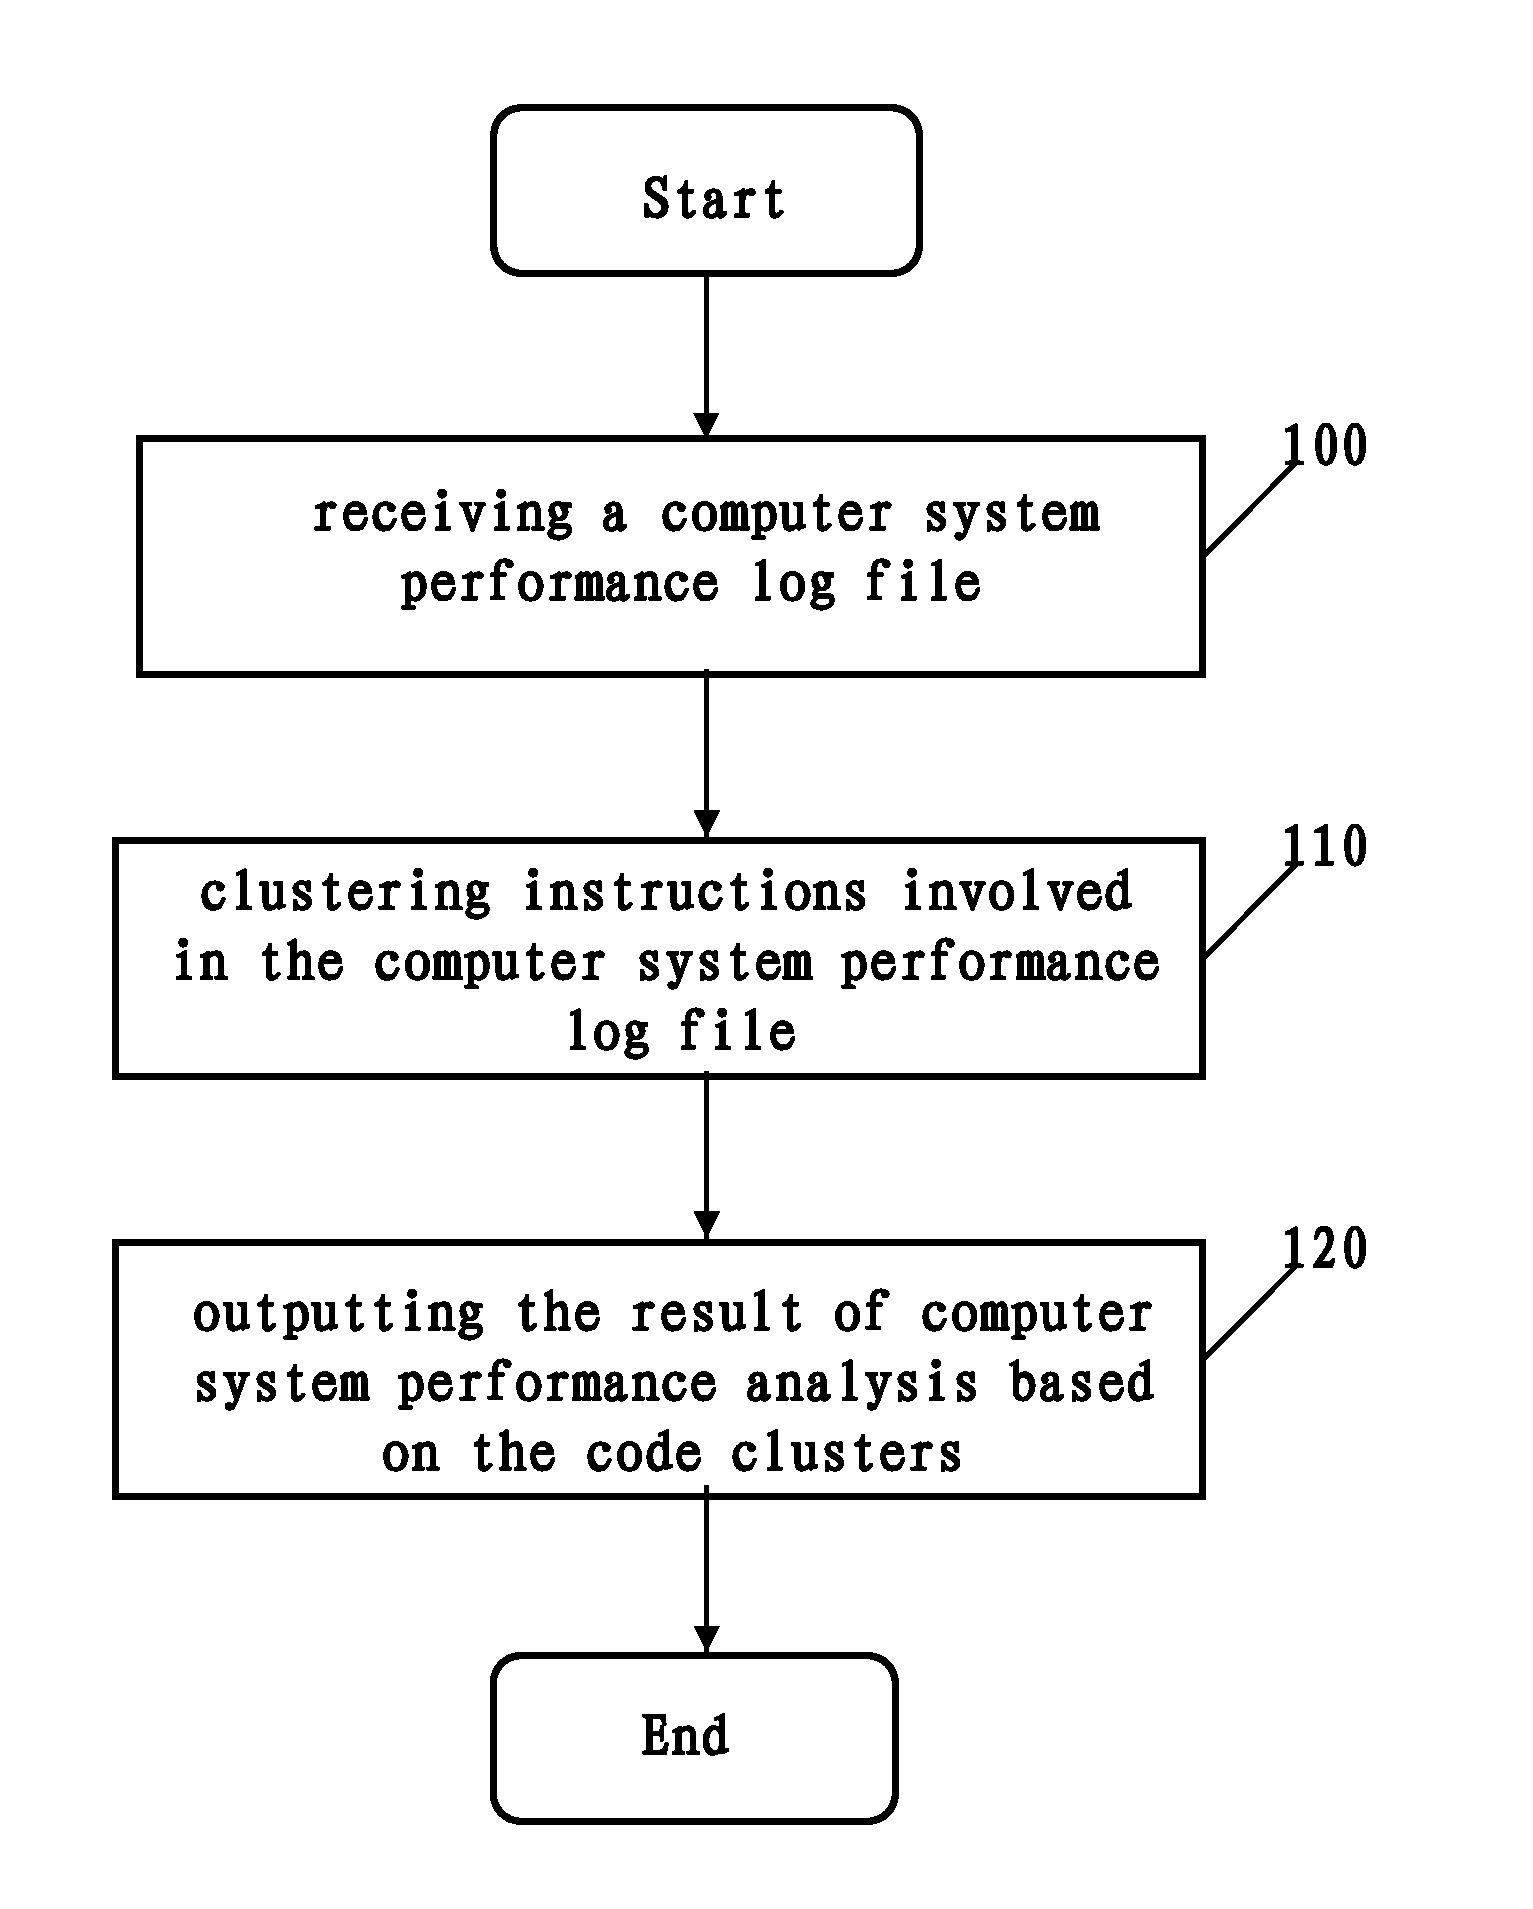
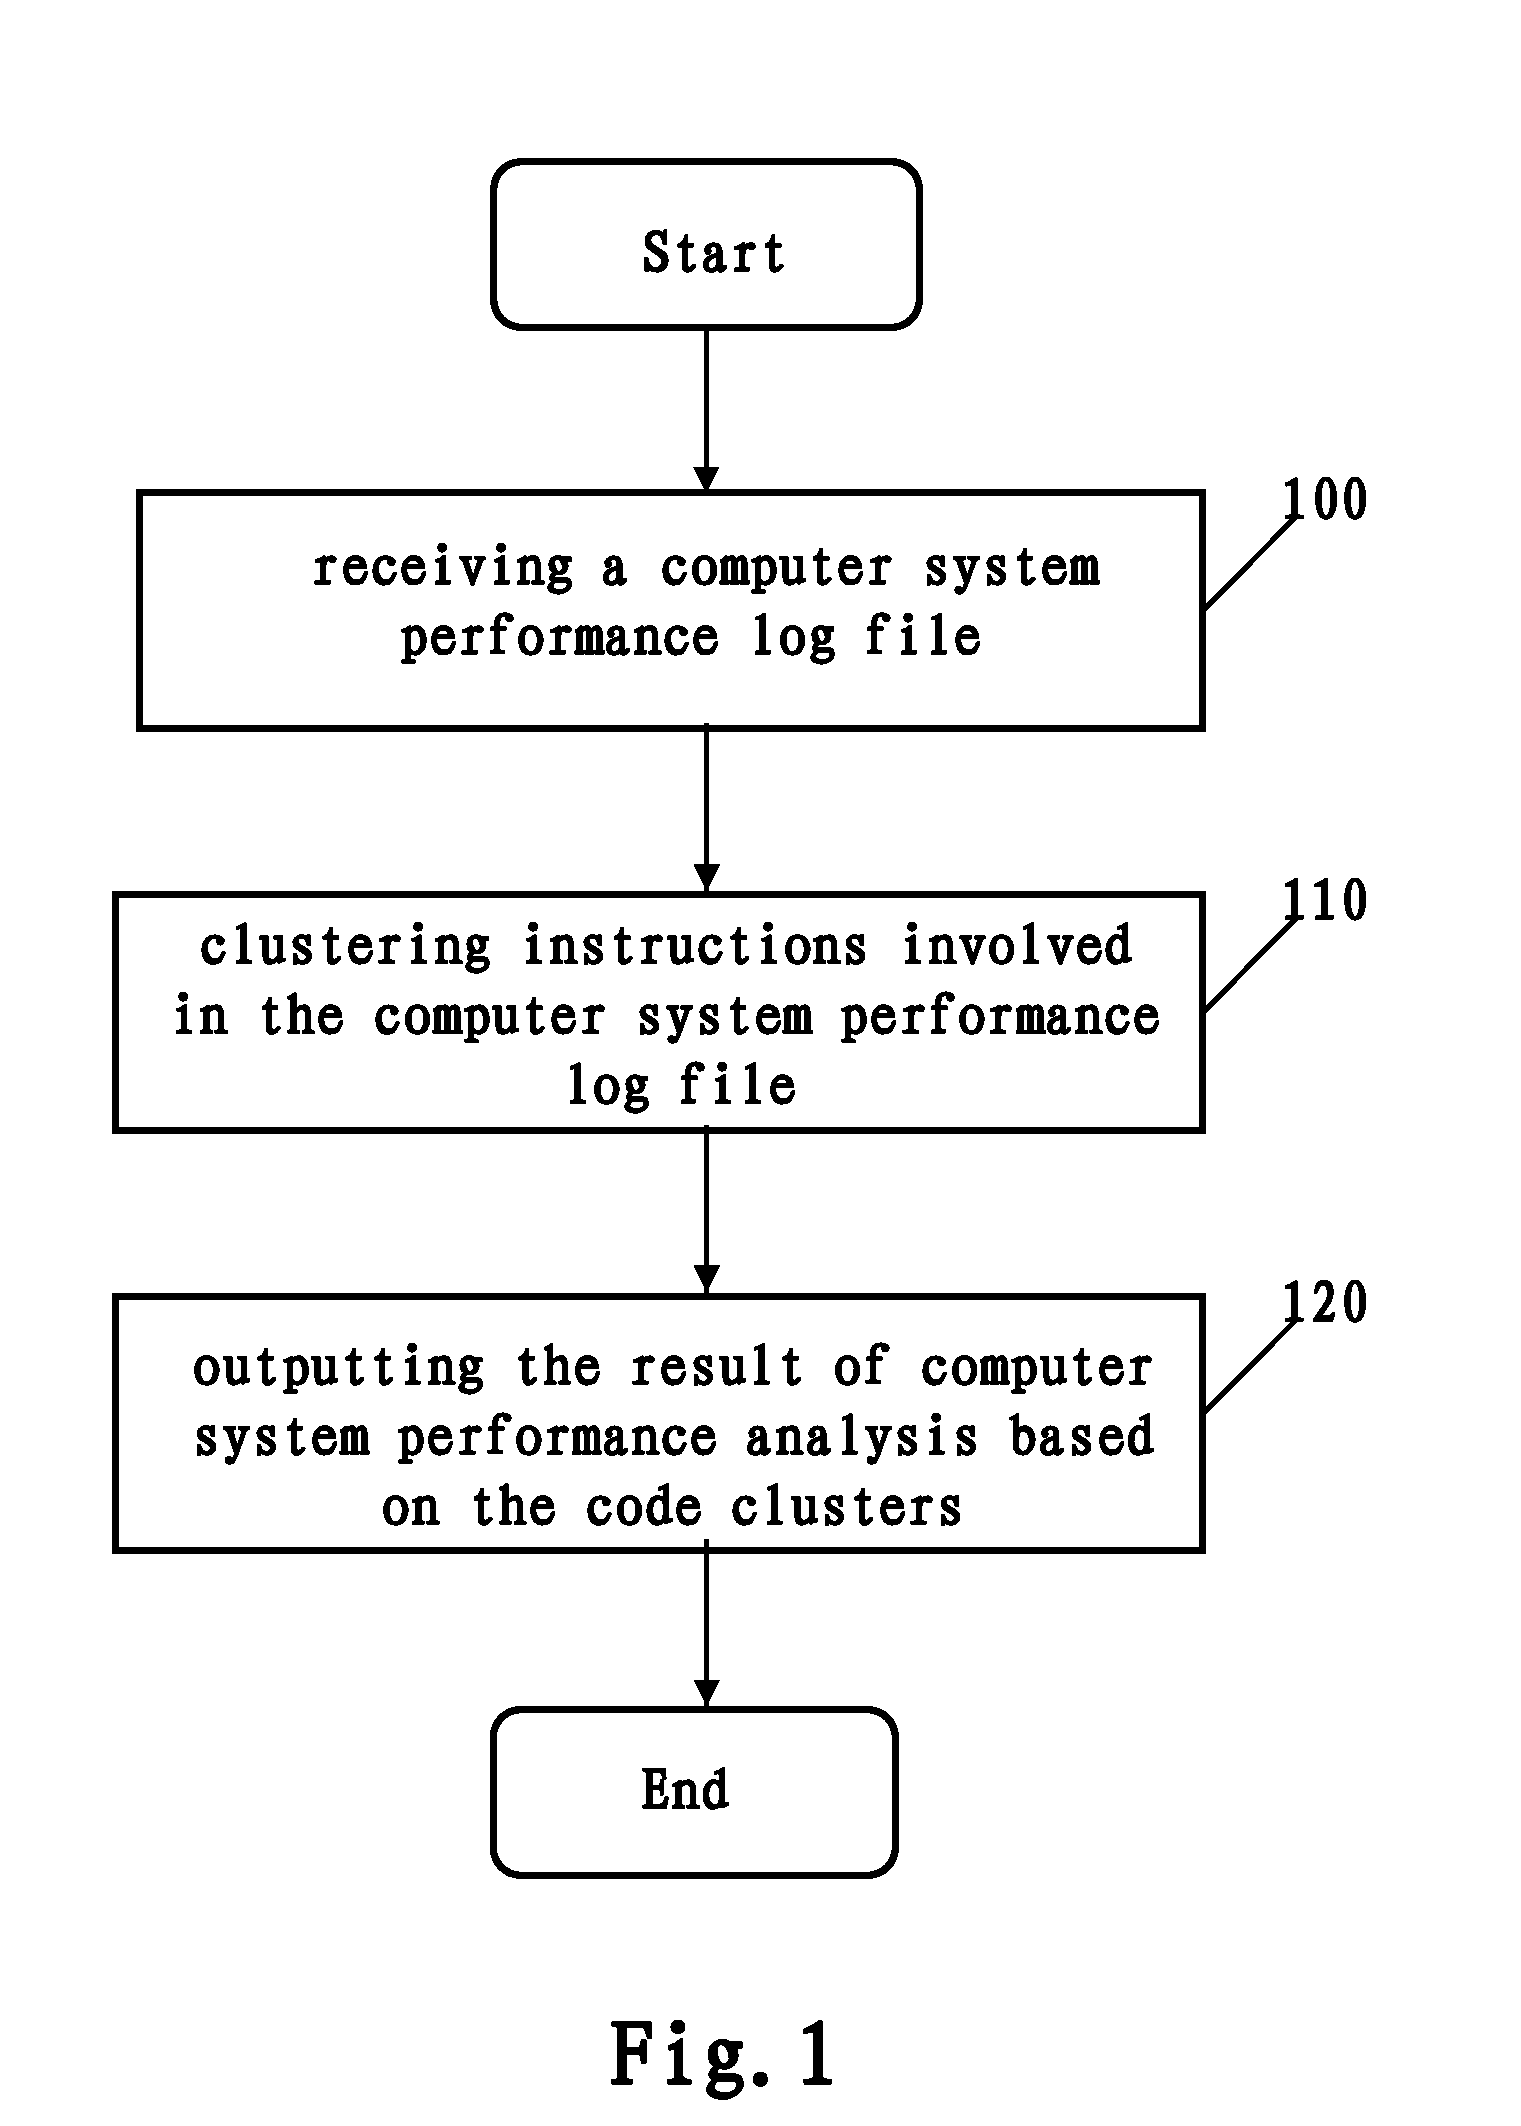
[0026]FIG. 1 is a schematic flowchart showing the method of computer system performance analysis according to a first embodiment of this invention.
[0027]At step 100, a computer system performance log file is received, which is generated during computer system execution. For example, a hardware performance counter (not shown) may monitor events such as ticks, instruction cache miss (i-cache miss), data cache miss (d-cache miss), branch miss and the like that occur during system execution, and a performance log file generator (not shown) may translate related signals into a computer system performance log file.
[0028]At step 110, a clustering process with flexible granularity is applied on instructions involved in the computer system performance log file to acquire code clusters. The code clusters may comprise executed codes that are consecutively sampled by the hardware performance counter. That is, the sampled execution codes within a code cluster have successive numbers. Those code ...
second embodiment
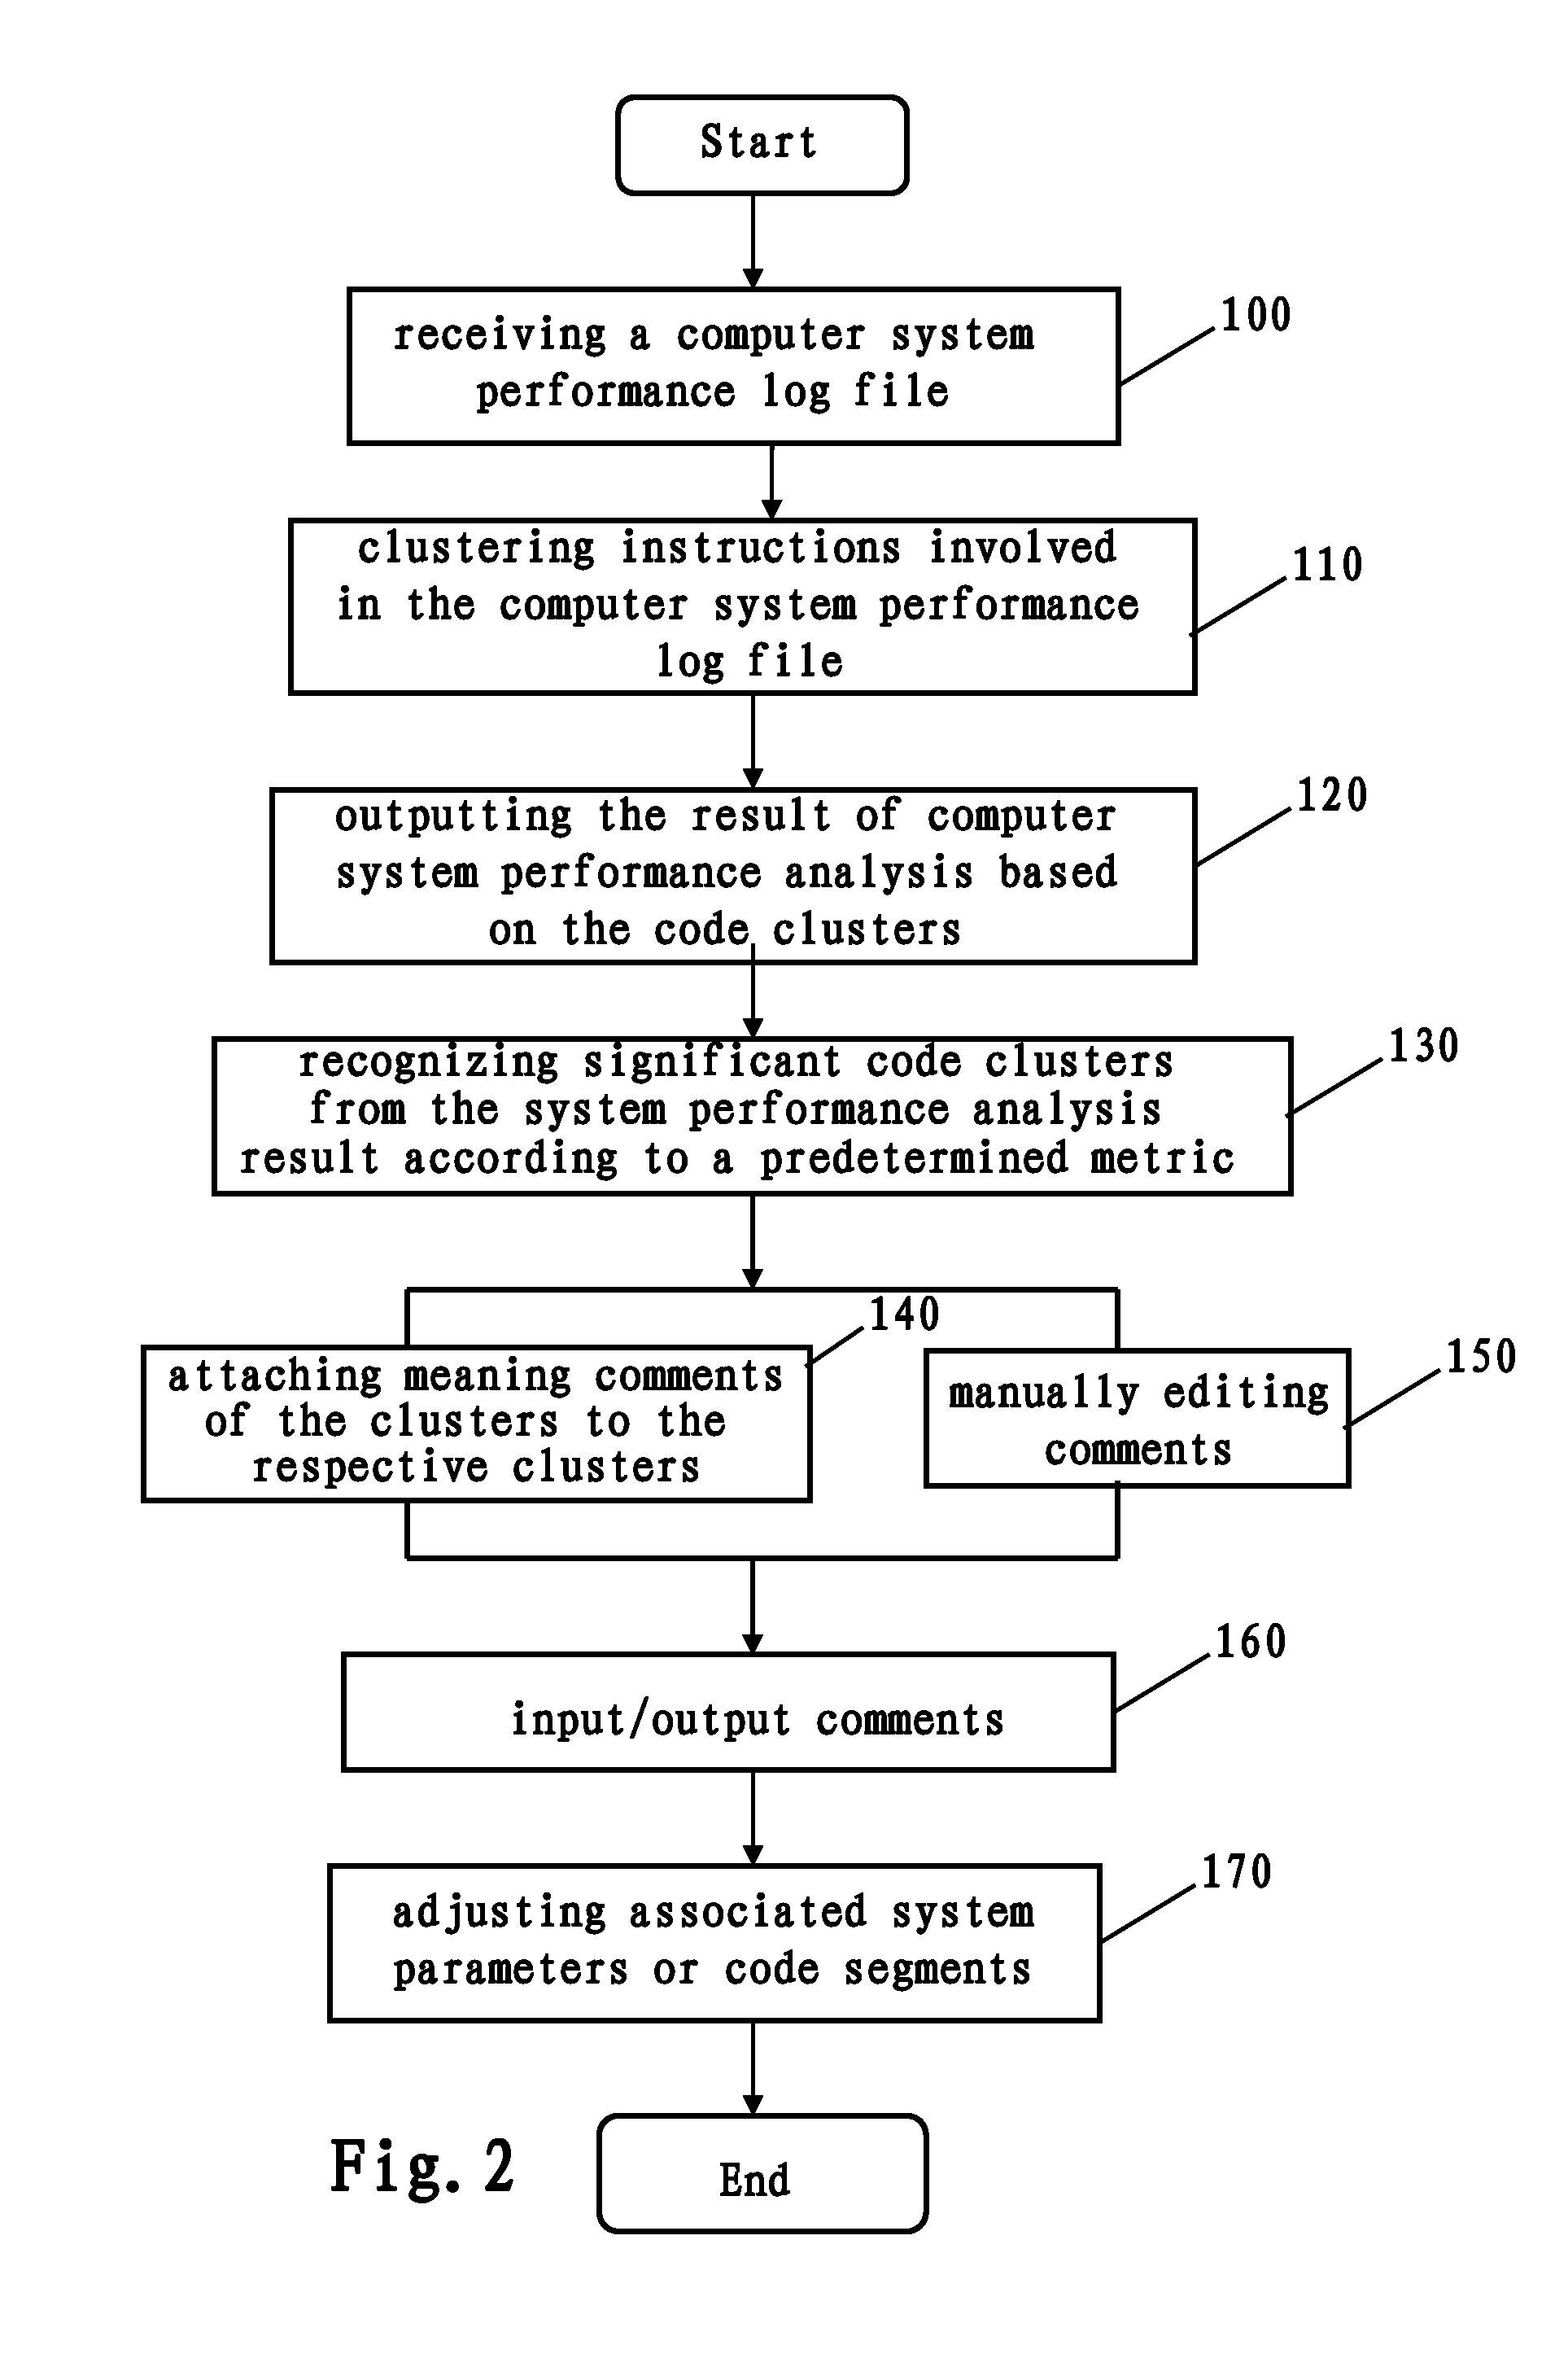
[0030]FIG. 2 is a schematic flowchart showing the method of computer system performance analysis according to a second embodiment of this invention. In this embodiment, the same reference signs are used to refer to the same steps as those of FIG. 1, and thus the detailed description of which are omitted herein.
[0031]The method of computer system performance analysis according to the present embodiment differs from the first embodiment in that it is possible to further recognize significant code clusters, such as hotspots, large warm areas, code-reordering potential areas and the like, from the system performance analysis result. Hereinafter, examples of recognizing hotspots, large warm areas, code-reordering potential areas will be described below in detail.
[0032]In the method of this embodiment, after the implementation of the same steps as steps 100-120 of the first embodiment, at step 130, significant code clusters are recognized from the system performance analysis result accord...
third embodiment
[0063]FIG. 8 is a schematic block diagram of a device 800 of computer system performance analysis according to the third embodiment of this invention.
[0064]As shown in FIG. 8, the device 800 of computer system performance analysis according to this embodiment comprises a clustering handler 810 and a performance viewer 820.
[0065]The device 800 of computer system performance analysis may further comprise a performance log file receiver (not shown) for receiving a computer system performance log file. For example, a hardware performance counter (not shown) may monitor events (such as ticks, instruction cache miss (i-cache miss), data cache miss (d-cache miss)) during system operation, and a performance log file generator (not shown) may translate related signals into a computer system performance log file.
[0066]The clustering handler 810 can cluster the instructions involved in the computer system performance log files at flexible granularity to acquire code clusters. The clustering ma...
PUM
 Abstract
Description
Claims
Application Information