Suggesting alternate data mappings for charts

a chart and data technology, applied in the field of alternative data mappings for charts, can solve the problems of inability to communicate compelling stories based on data effectively without, save users a tremendous amount of time, and the quality of information visualization has not kept pa

Active Publication Date: 2013-04-18
MICROSOFT TECH LICENSING LLC
View PDF6 Cites 117 Cited by
  • Summary
  • Abstract
  • Description
  • Claims
  • Application Information

AI Technical Summary

Benefits of technology

[0007]The above described problems are solved by a process that analyzes the user's data as well as the chart type. The process suggests different representations of the chart based on alternative mappings of the data to the chart's constructs. These alternate mapping suggestions are then presented to the user in a rich manner which allows for easy selection of the desired chart both within the initial chart insertion experience as well as after a chart is inserted.

Problems solved by technology

Moreover, spreadsheets have the ability to re-calculate the entire spreadsheet automatically after a change to a single cell is made, which saves save users a tremendous amount of time.
While the data analytic tools, such as the spreadsheet, have become ubiquitous in every organization and will likely remain so, the quality of information visualization has not kept pace.
After data has been collected and arranged or entered into a tool, such as a spreadsheet, compelling stories based on the data cannot be communicated effectively without using charts and other visualizations.
This may be frustrating to users that do not understand the difference between the choices available.
As a result, the chart or visualization may not convey the information as intended or in a most useful manner because the data may not be properly mapped to the chart's construct.
Today, there is not a chart recommendation tool that provides the user with optimal chart choices in a ranked order based on an analysis of the data or that guides users to make better choices in creating visualizations.

Method used


Image

  • Suggesting alternate data mappings for charts
  • Suggesting alternate data mappings for charts
  • Suggesting alternate data mappings for charts

Examples


Embodiment Construction

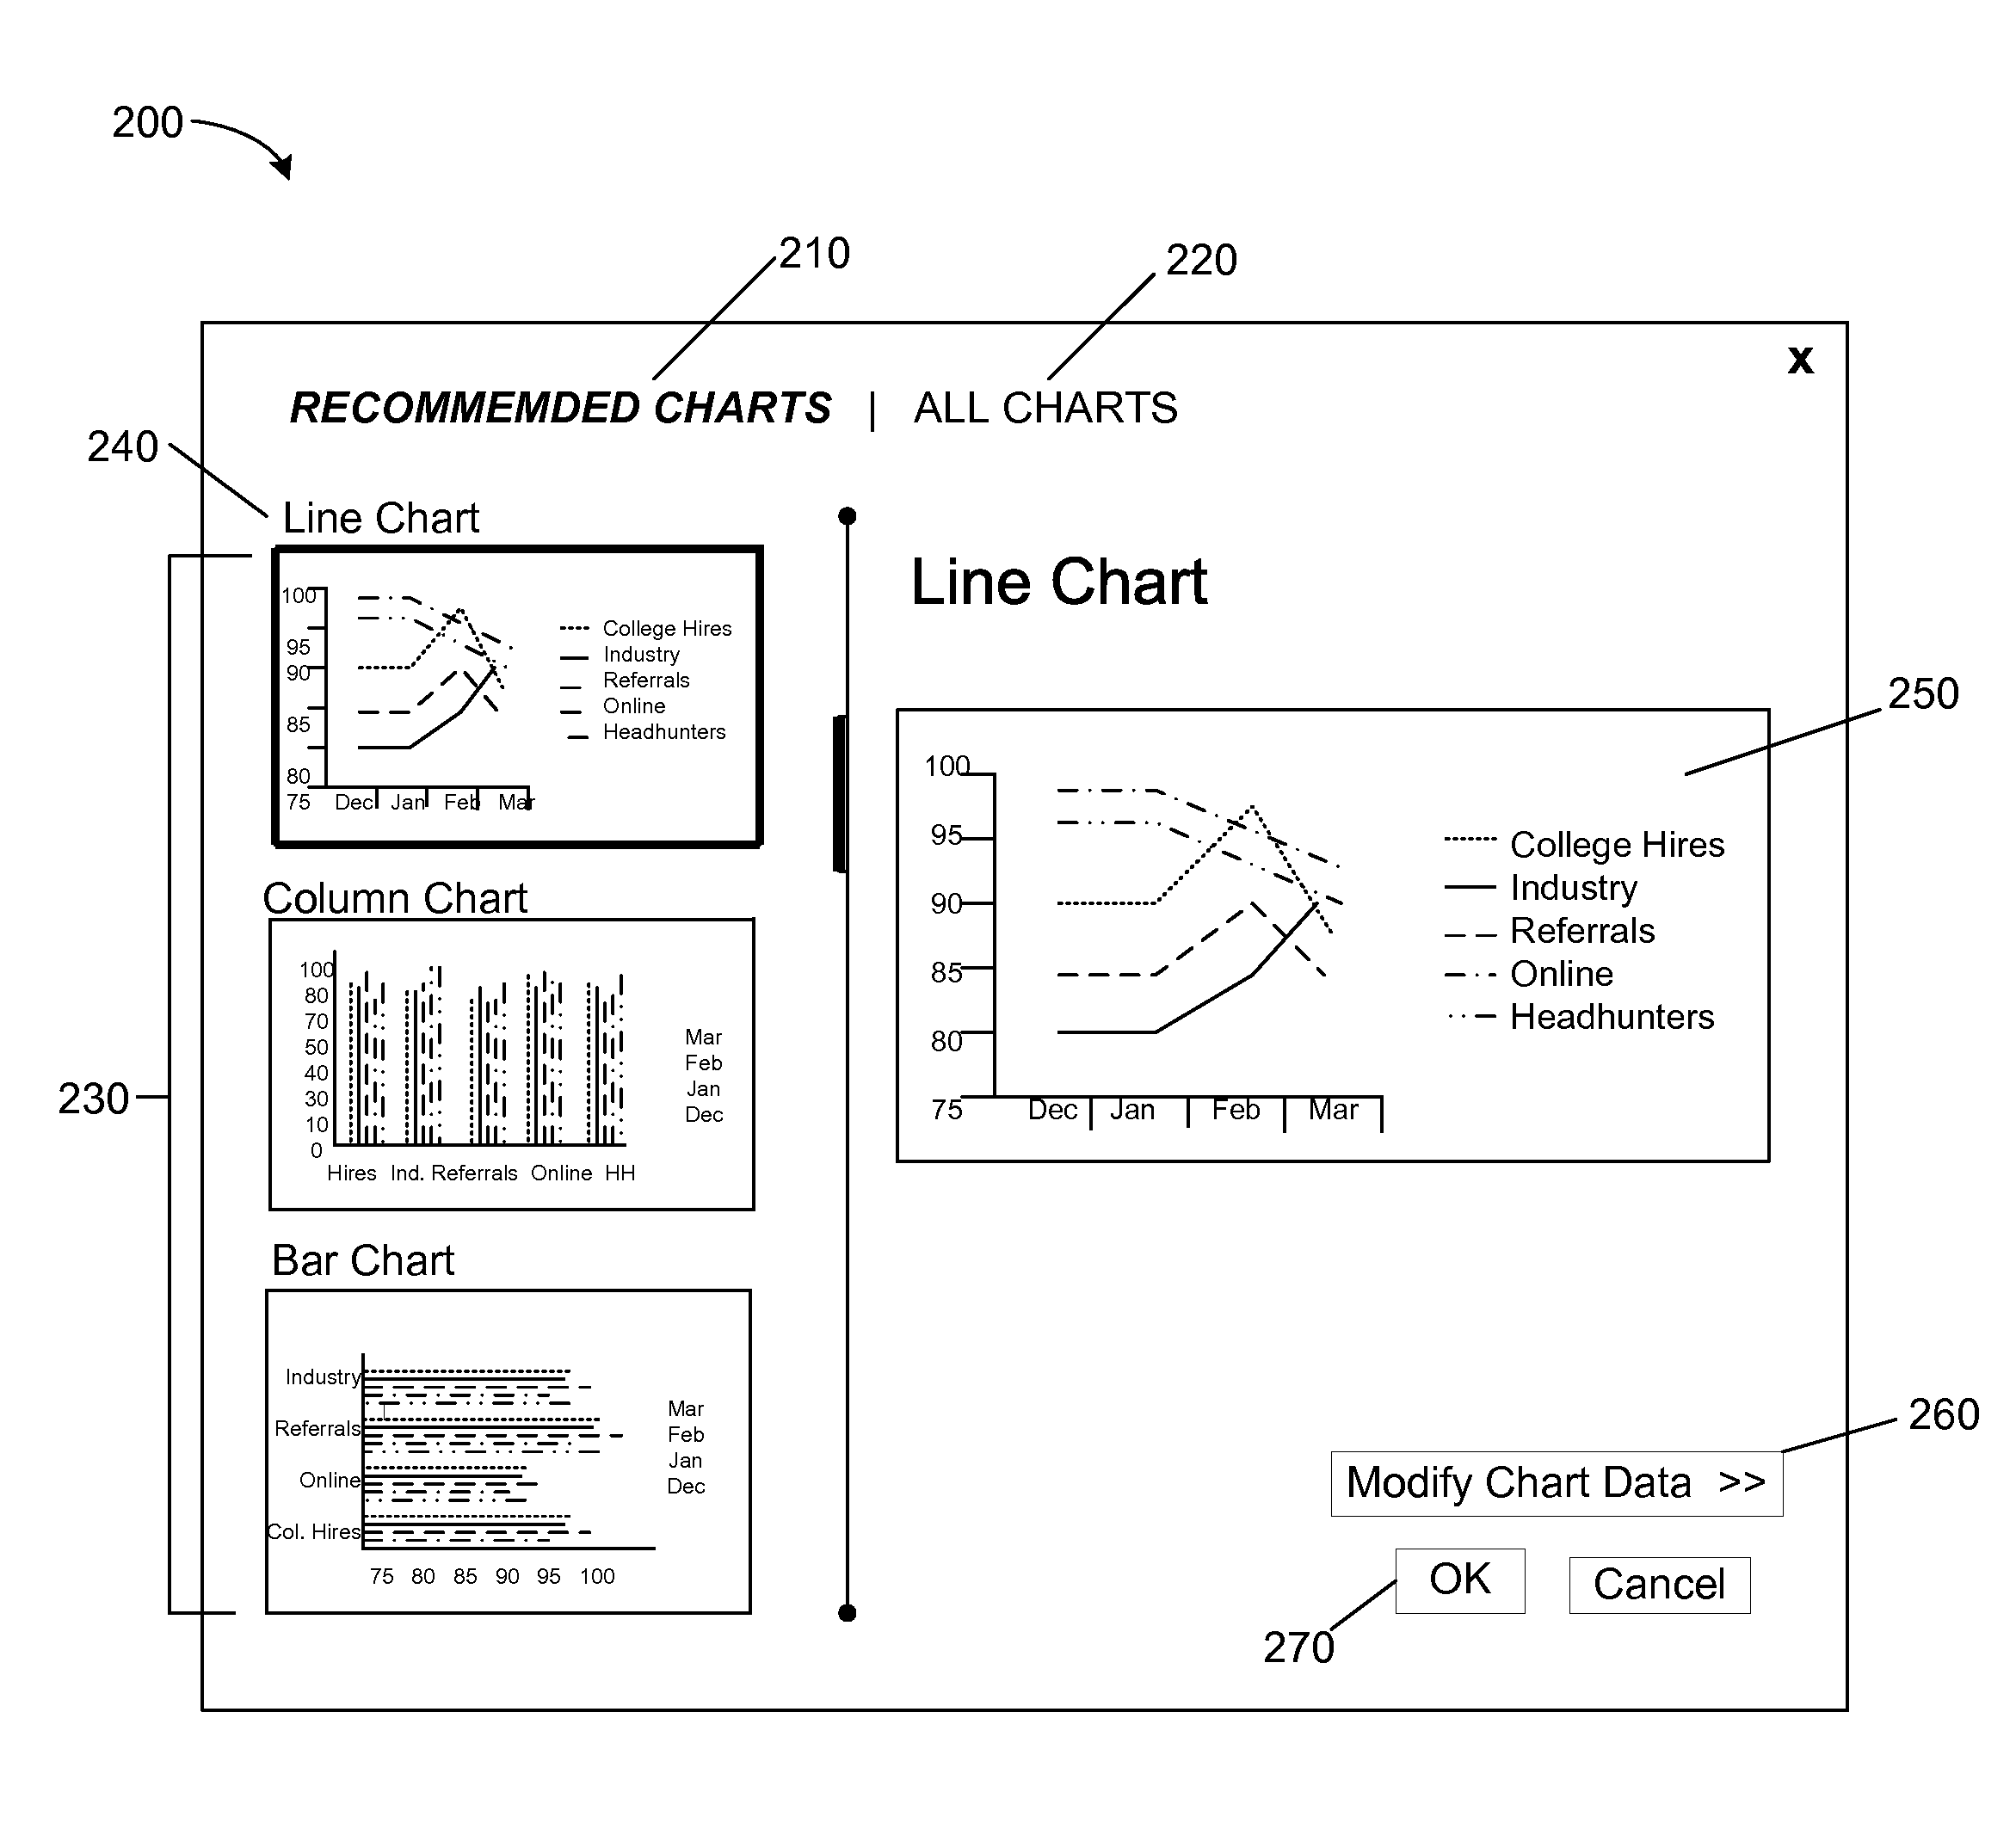
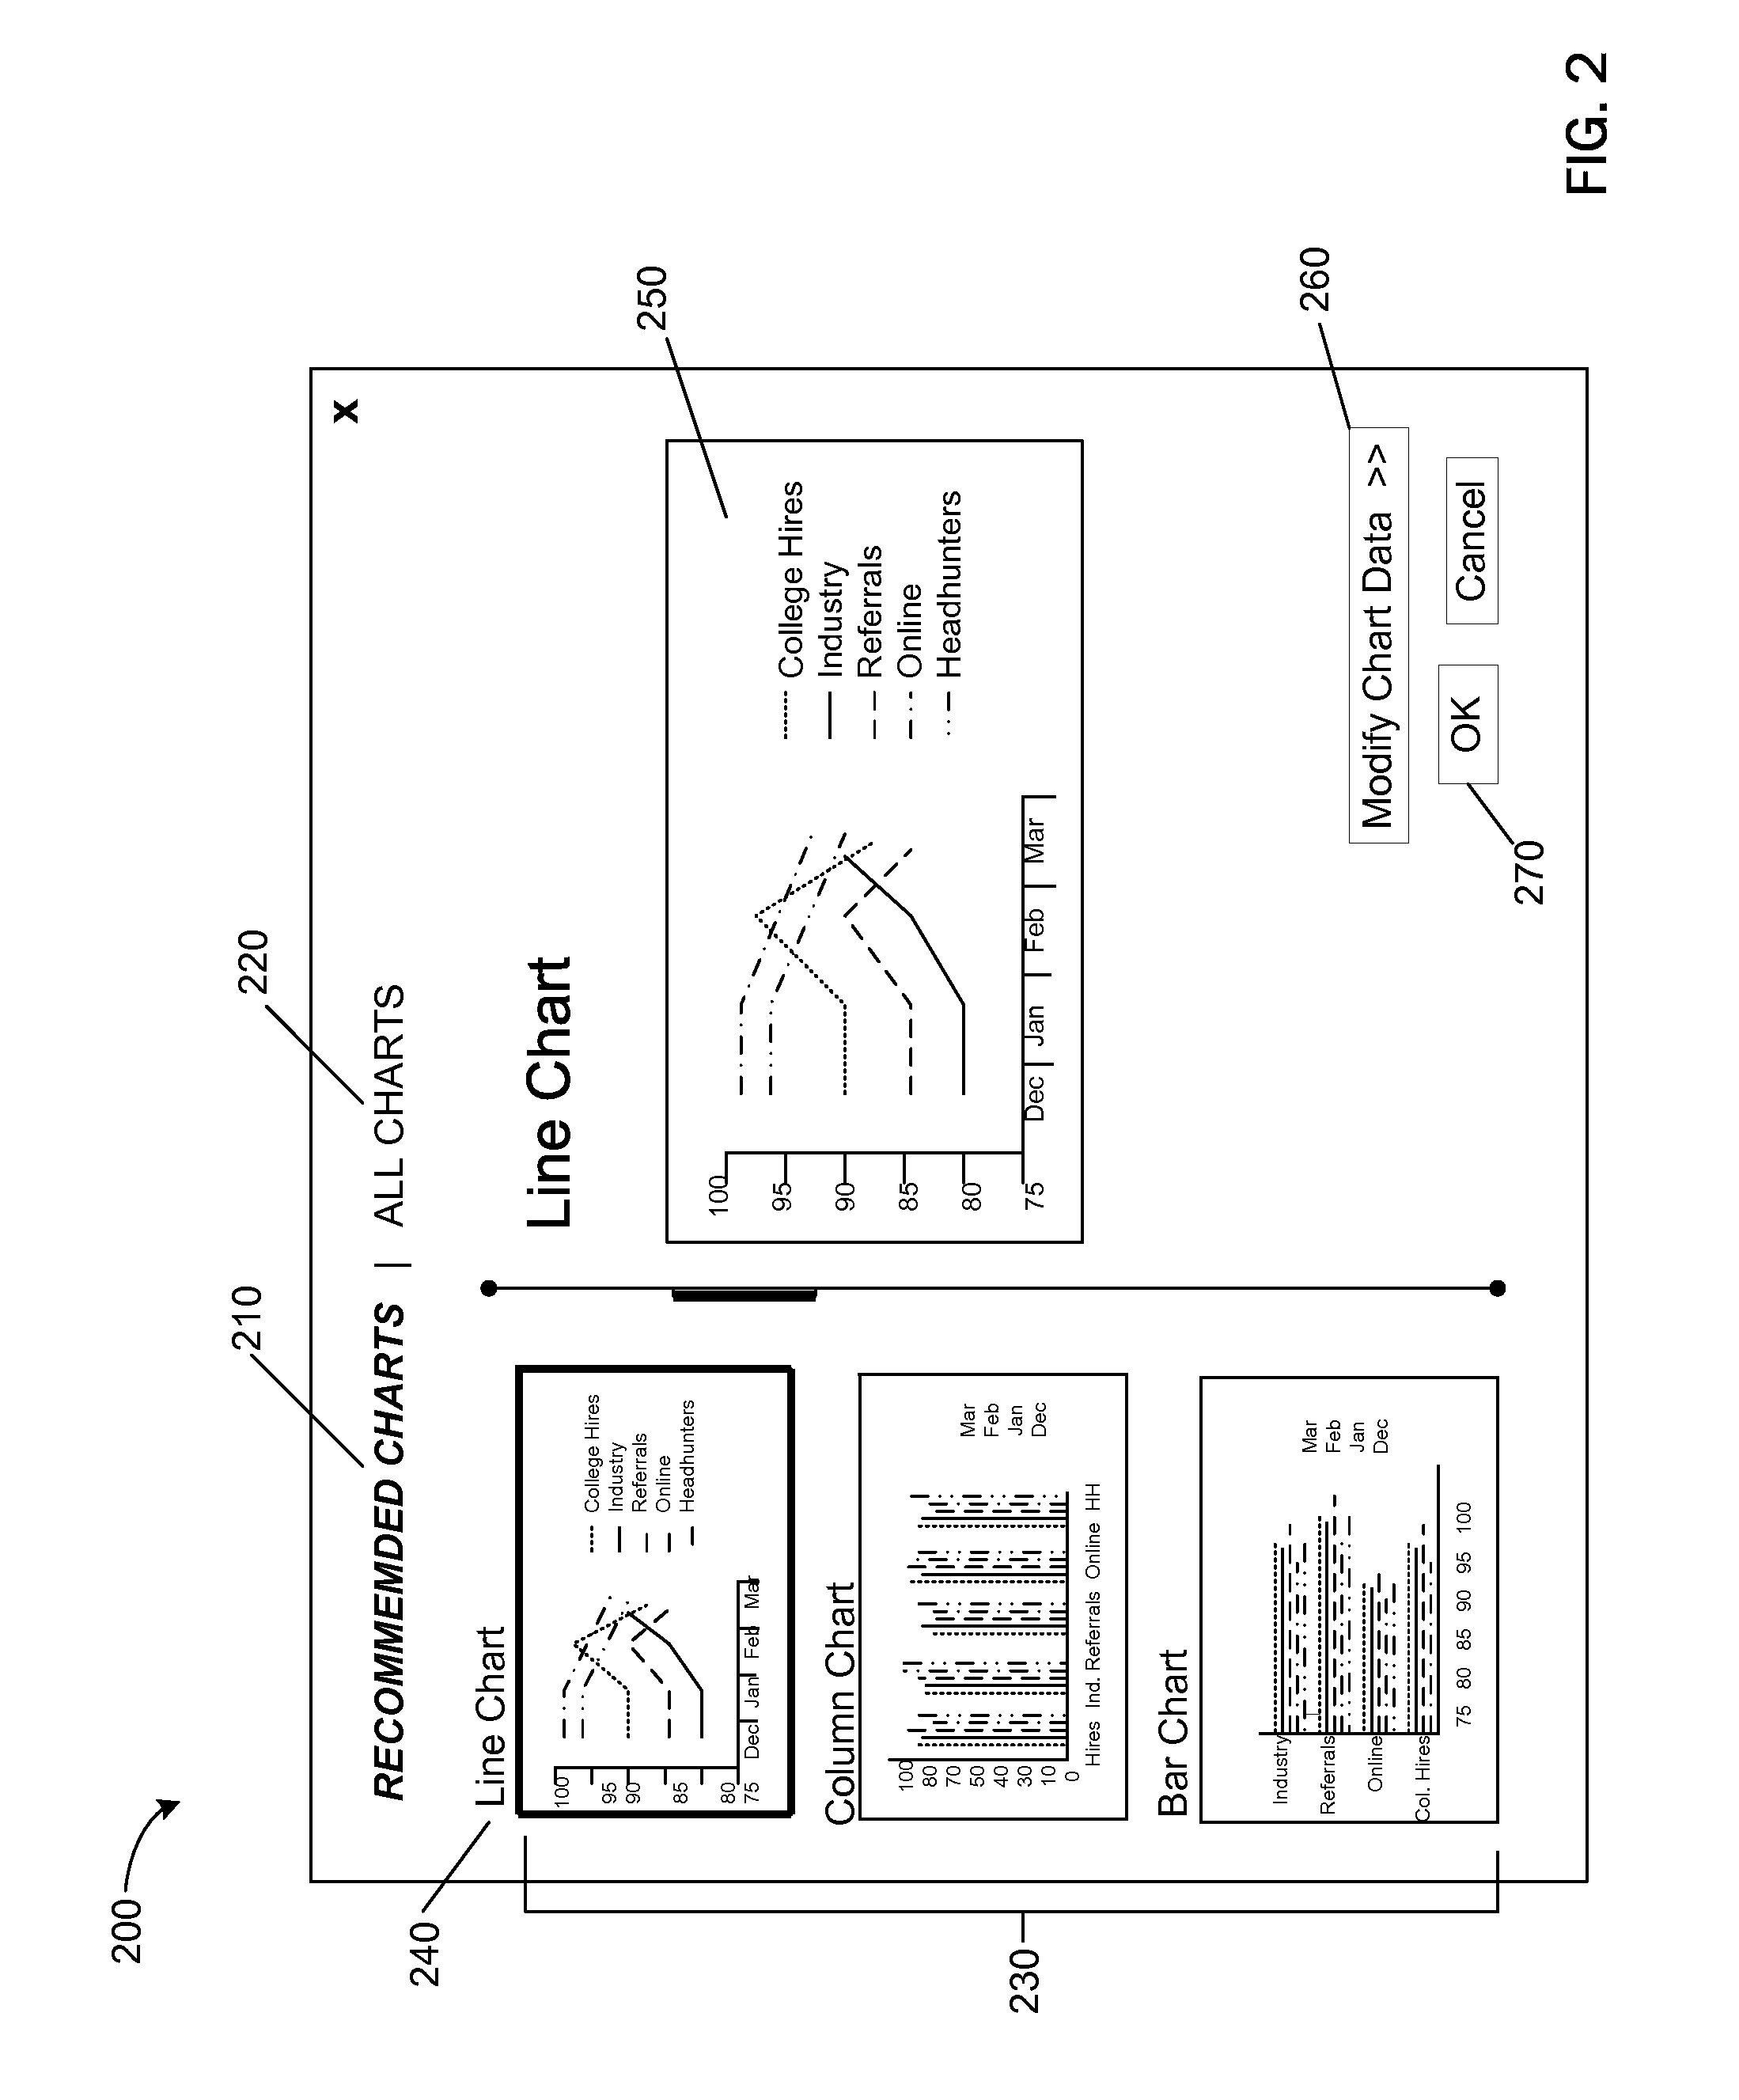
[0039]Embodiments of the present invention are directed to providing chart recommendations to users desiring a visualization of data.

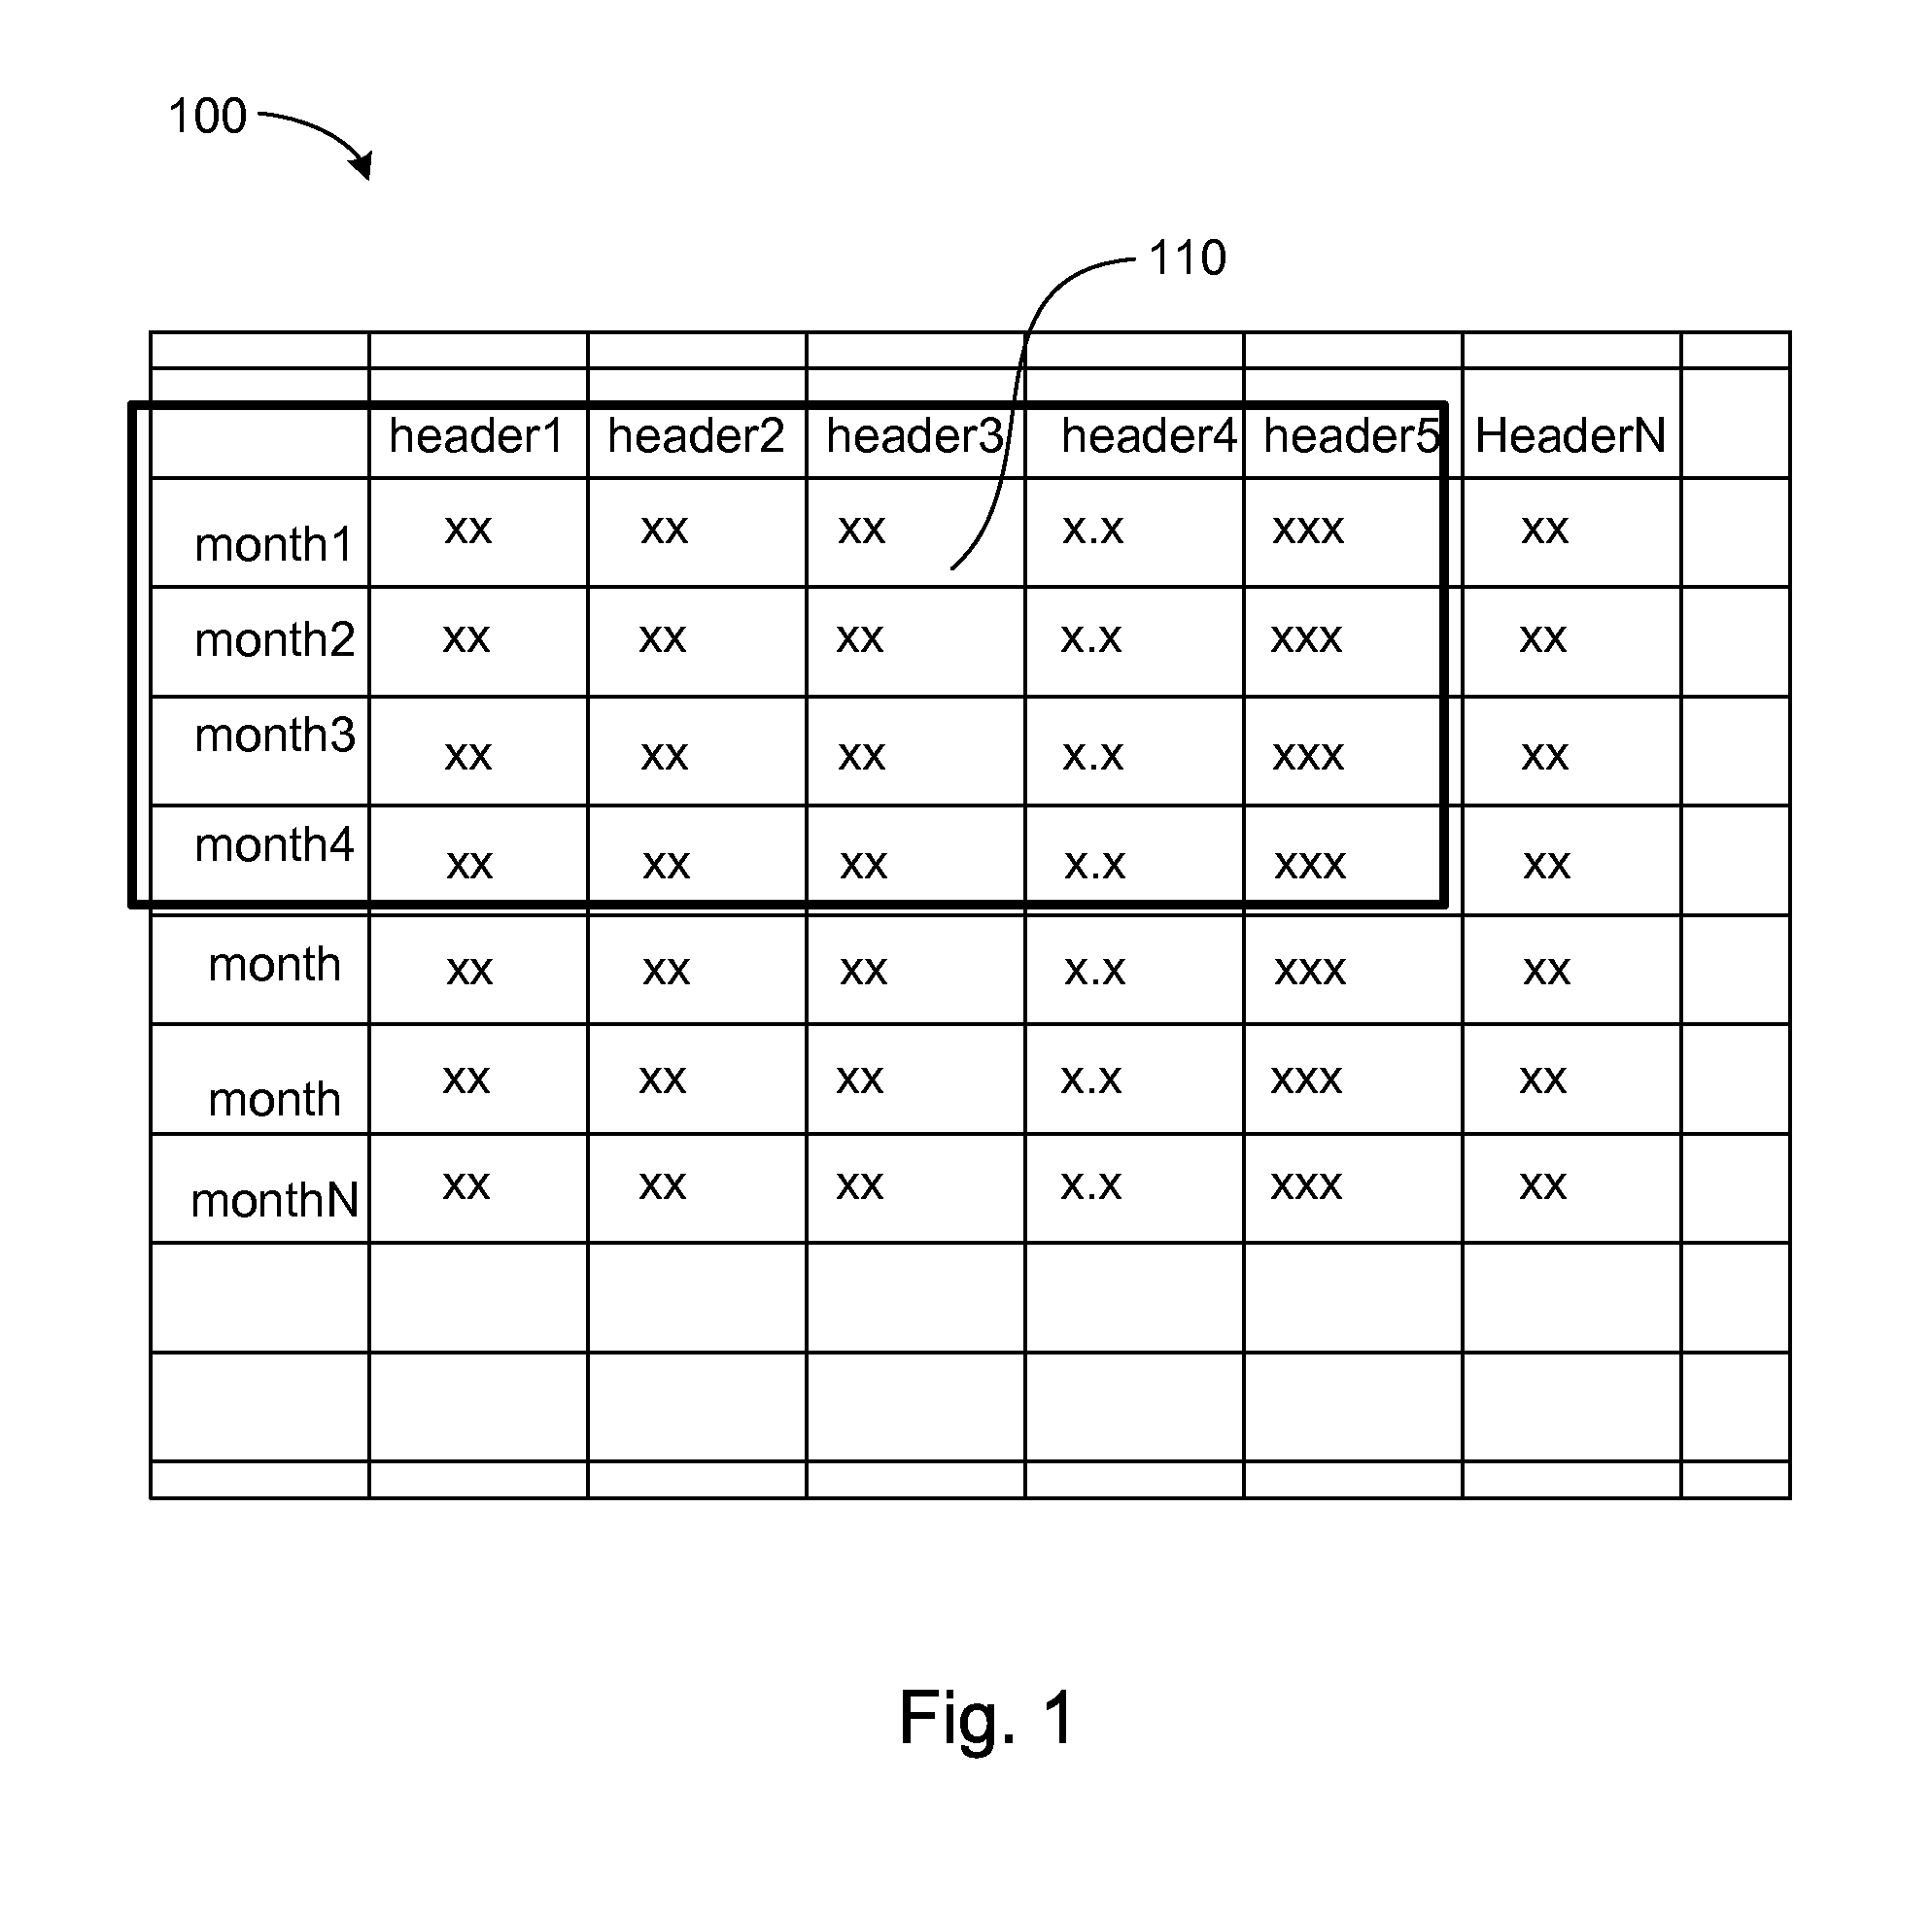
[0040]FIG. 1 represents a table 100 in a spreadsheet application that a user may select a dataset from for chart suggestions according to one embodiment. Those skilled in the art recognize that there are many examples of data processing and management tools, which may include database tools, visual tool for creating, analyzing, and communicating decision models, spreadsheet programs, etc. Further, there are other tools that may use tables or other grid data sources. A spreadsheet is one example of a grid data source that may be used to create a table. Thus, those skilled in the art will recognize that the embodiments discussed herein are not meant to be limited to spreadsheets or any other particular method of presenting data.

[0041]In FIG. 1, the chart recommendation process tries to heuristically determine a set of appropriate chart suggestions for a ...


PUM


Abstract

Data mapping alternatives for creating a visual representation of a set of data are presented. A set of data is identified for analysis. The identified set of data and properties associated with the identified set of data are analyzed. Based on the analysis, data mapping alternatives for the identified set of data are determined. The determined data mapping alternatives for the identified set of data are ranked. The determined data mapping alternatives are presented in an order according to the ranking of the determined data mapping alternatives.

Description

CROSS-REFERENCE TO RELATED APPLICATIONS[0001]This application is related to co-pending application Ser. No. 13 / 245,126 entitled “Chart Recommendations” filed Sep. 26, 2011, which is incorporated herein by reference.BACKGROUND[0002]Data analytics is used in many industries to allow companies and organization to make better business decisions and in the sciences to model and verify theories. There are many tools available for processing and managing data. Examples of data processing and management tools include database tools, visual tool for creating, analyzing, and communicating decision models, spreadsheet programs, etc. Thus, there are many tools that may use tables or other grid data sources. Moreover, visualization is often needed for different types of data sources, whether they be spreadsheet data, data in a CSV file, data in a SQL table, data in some other data base, data in a cube, or data in some other structured electronic storage container.[0003]A spreadsheet is one examp...

Claims


Application Information

Patent Timeline
Patent Type & Authority Applications(United States)
IPC IPC(8): G06F7/00G06F17/30
CPCG06F17/246G06F16/248G06F16/34G06F16/221G06F16/438G06F16/24578G06F40/18
Inventor FAN, KEVINRAMPSON, BENJAMIN EDWARDCHIANG, NICKWAKEFIELD, ROBIN
Owner MICROSOFT TECH LICENSING LLC
Why Eureka
Try Eureka