Method and Apparatus for Utilizing Representational Images in Analytical Activities

a technology of representational images and analytical activities, applied in the field of creating and using representational images, can solve the problems of limiting the analysis able to be performed, preventing a full and complete analysis of data, and each of these systems and techniques is severely limited, so as to facilitate the improvement of presentation and comprehension of information, enhance accurate analysis, and reduce errors and misinterpretation

Inactive Publication Date: 2014-05-01
ERICKSON RONALD R +2
View PDF2 Cites 5 Cited by
  • Summary
  • Abstract
  • Description
  • Claims
  • Application Information

AI Technical Summary

Benefits of technology

[0011]The present invention provides a method for creating and using representational images, including holographic representational images, and an apparatus for using representational images, to enhance accurate analysis, facilitate improved presentation and comprehension of information, and implementation and quality of tasks associated with such information, and reduce errors and misinterpretation.
[0012]The representational images described herein may be used as a Three Dimensional Visual Map (3DVM) type of representational image presented alone and / or together with a two-dimensional display, representational image and / or physical object. When presented alone, the 3DVM includes all of the information necessary for undertaking the desired analysis and facilitates the accurate analysis of the information. For example, when a 3DVM is used to analyze historic marketing information, such information is presented as a true three-dimensional image in the form of a holographic representational image (HRI). Using conventional holographic techniques, a true third-dimension can be added thereby at least almost doubling the amount of usable information available. Using the process described in U.S. Pat. No. 5,748,347 (V-3D™), incorporated herein by reference, an additional dimension may be added, for example, providing for the addition of the dimension of time into the analysis, and thereby significantly multiplying the amount of usable information available.

Problems solved by technology

Each of these systems and techniques are severely limited since the forms of visualization supported by such systems and techniques do not provide for the concise and effective presentation of sufficient amounts of the available data at any one time, thereby preventing a full and complete analysis of the data.
Using a standard 2-dimensional or virtual 3-dimensional graph or chart, only three (or perhaps four) of these factors may be included in the visualization, thereby limiting the analysis able to be performed.

Method used


Image

  • Method and Apparatus for Utilizing Representational Images in Analytical Activities
  • Method and Apparatus for Utilizing Representational Images in Analytical Activities
  • Method and Apparatus for Utilizing Representational Images in Analytical Activities

Examples


Embodiment Construction

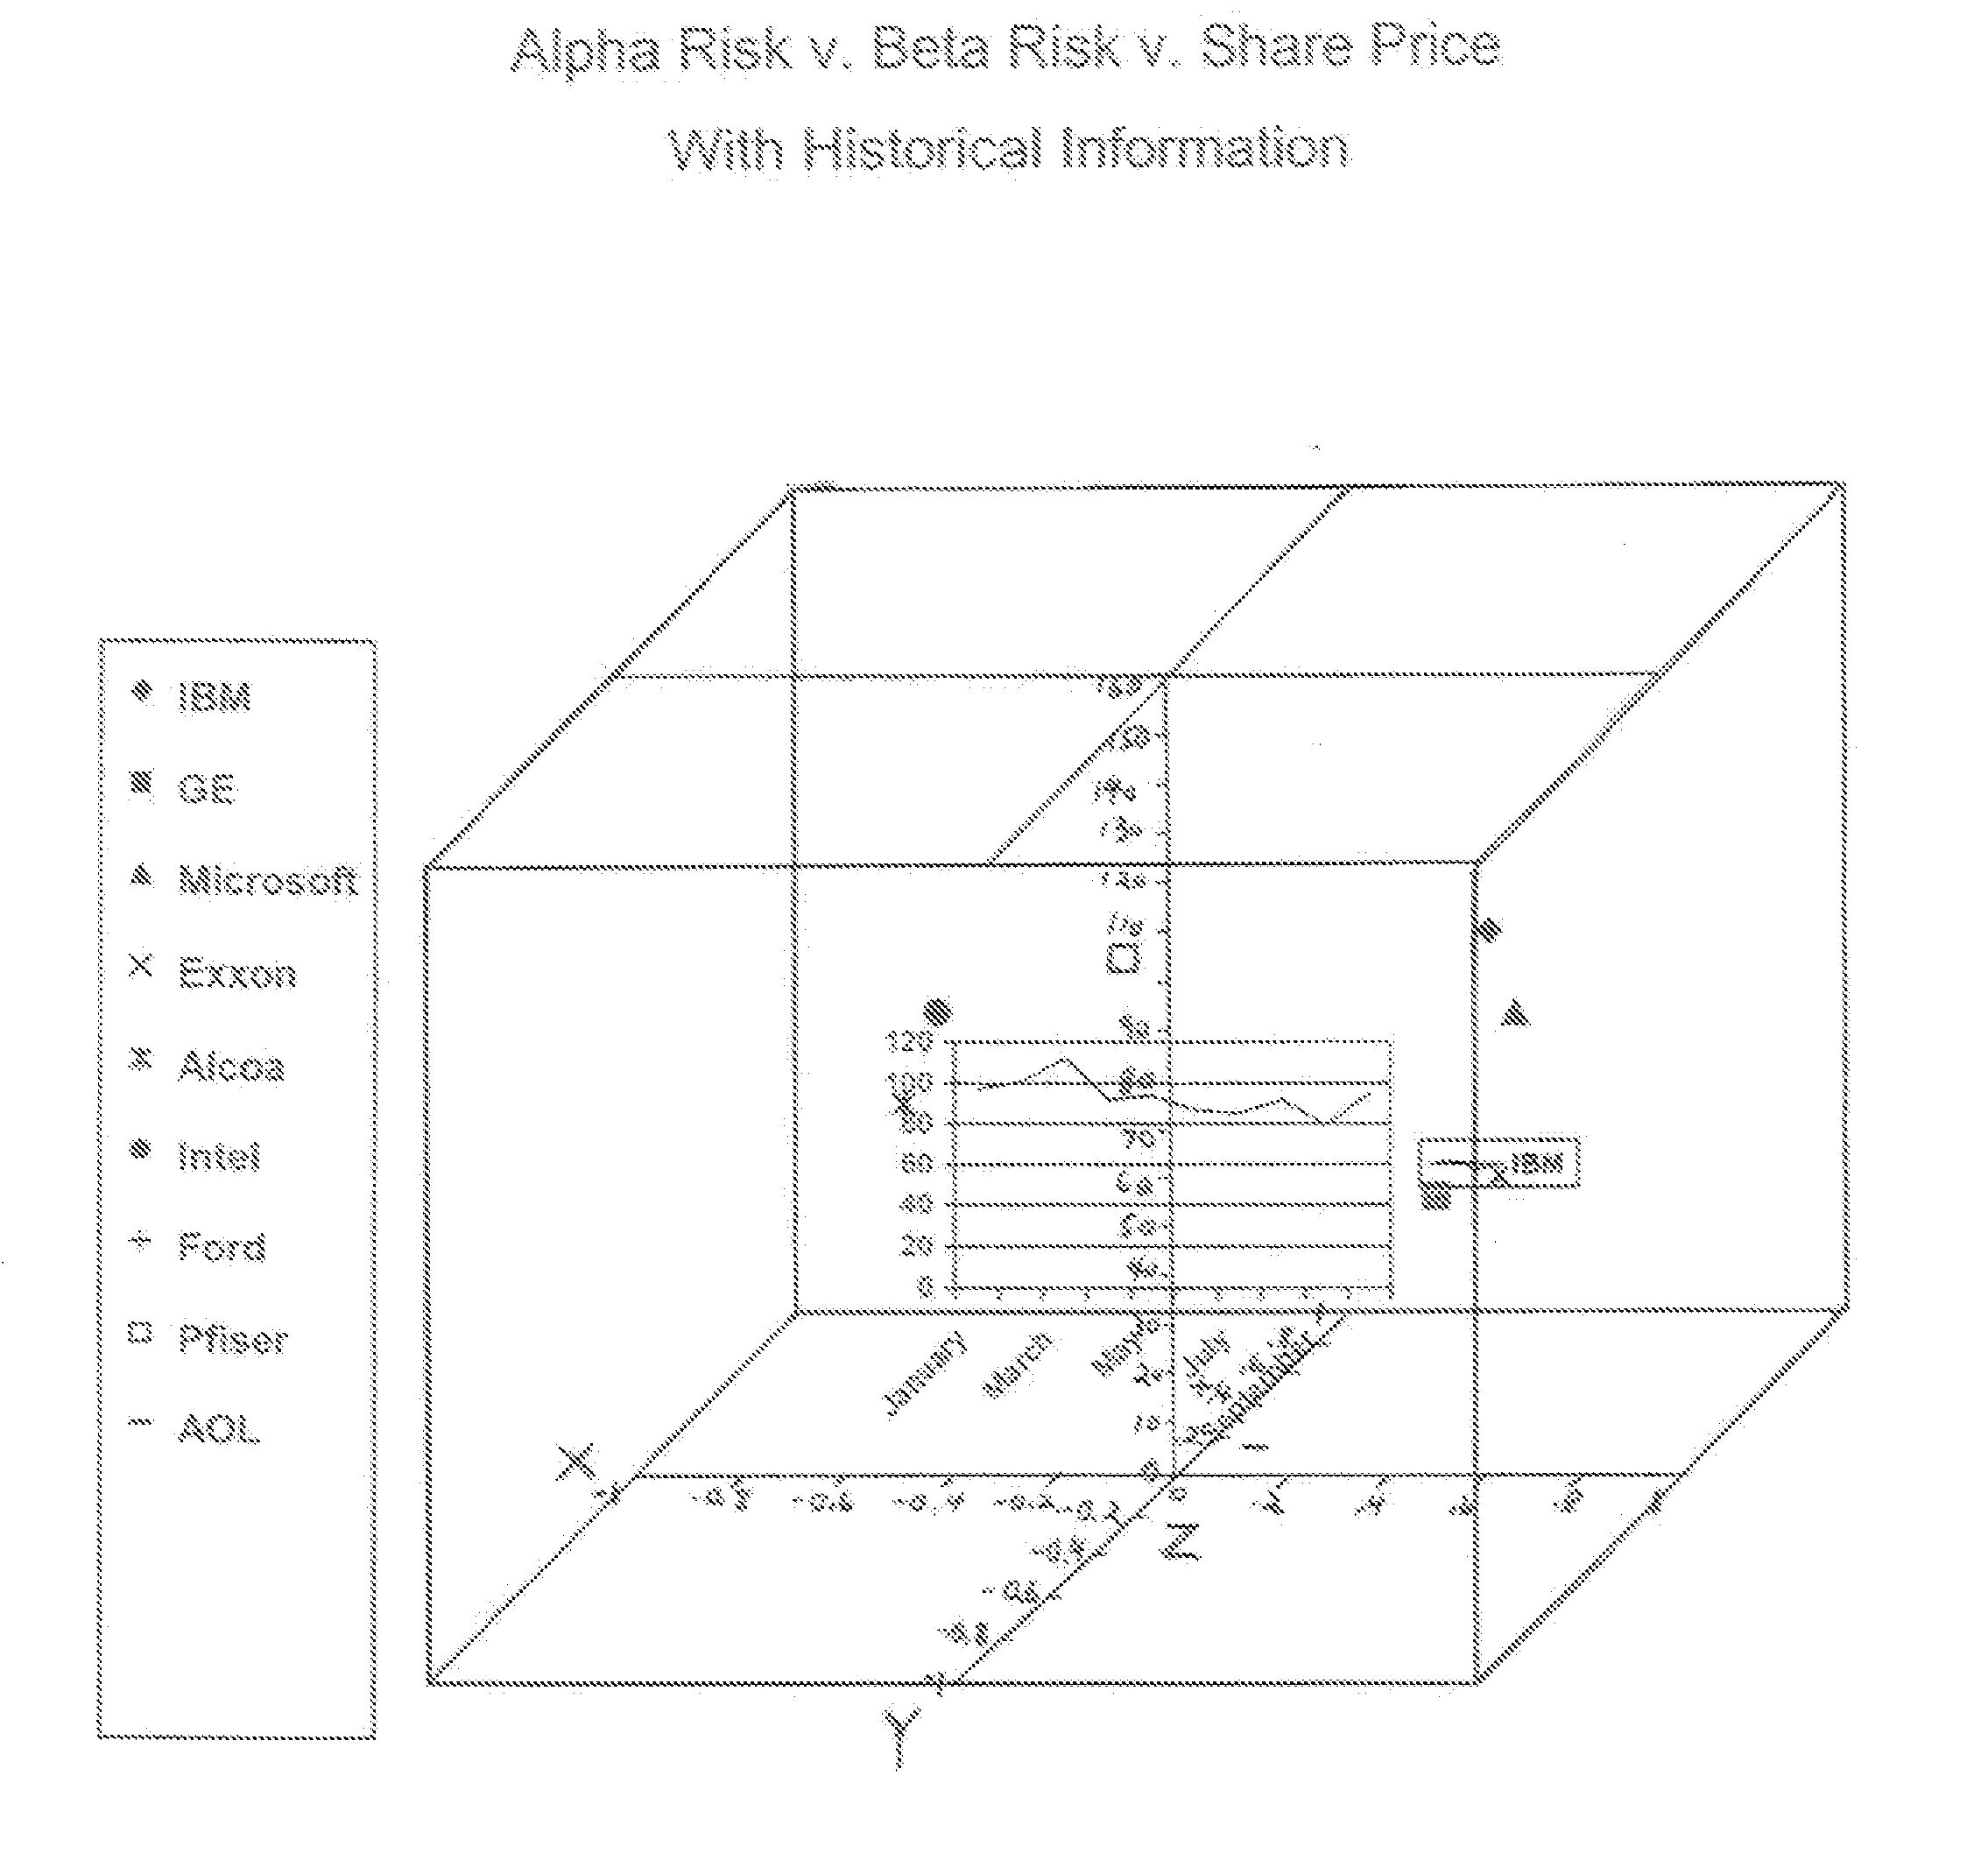
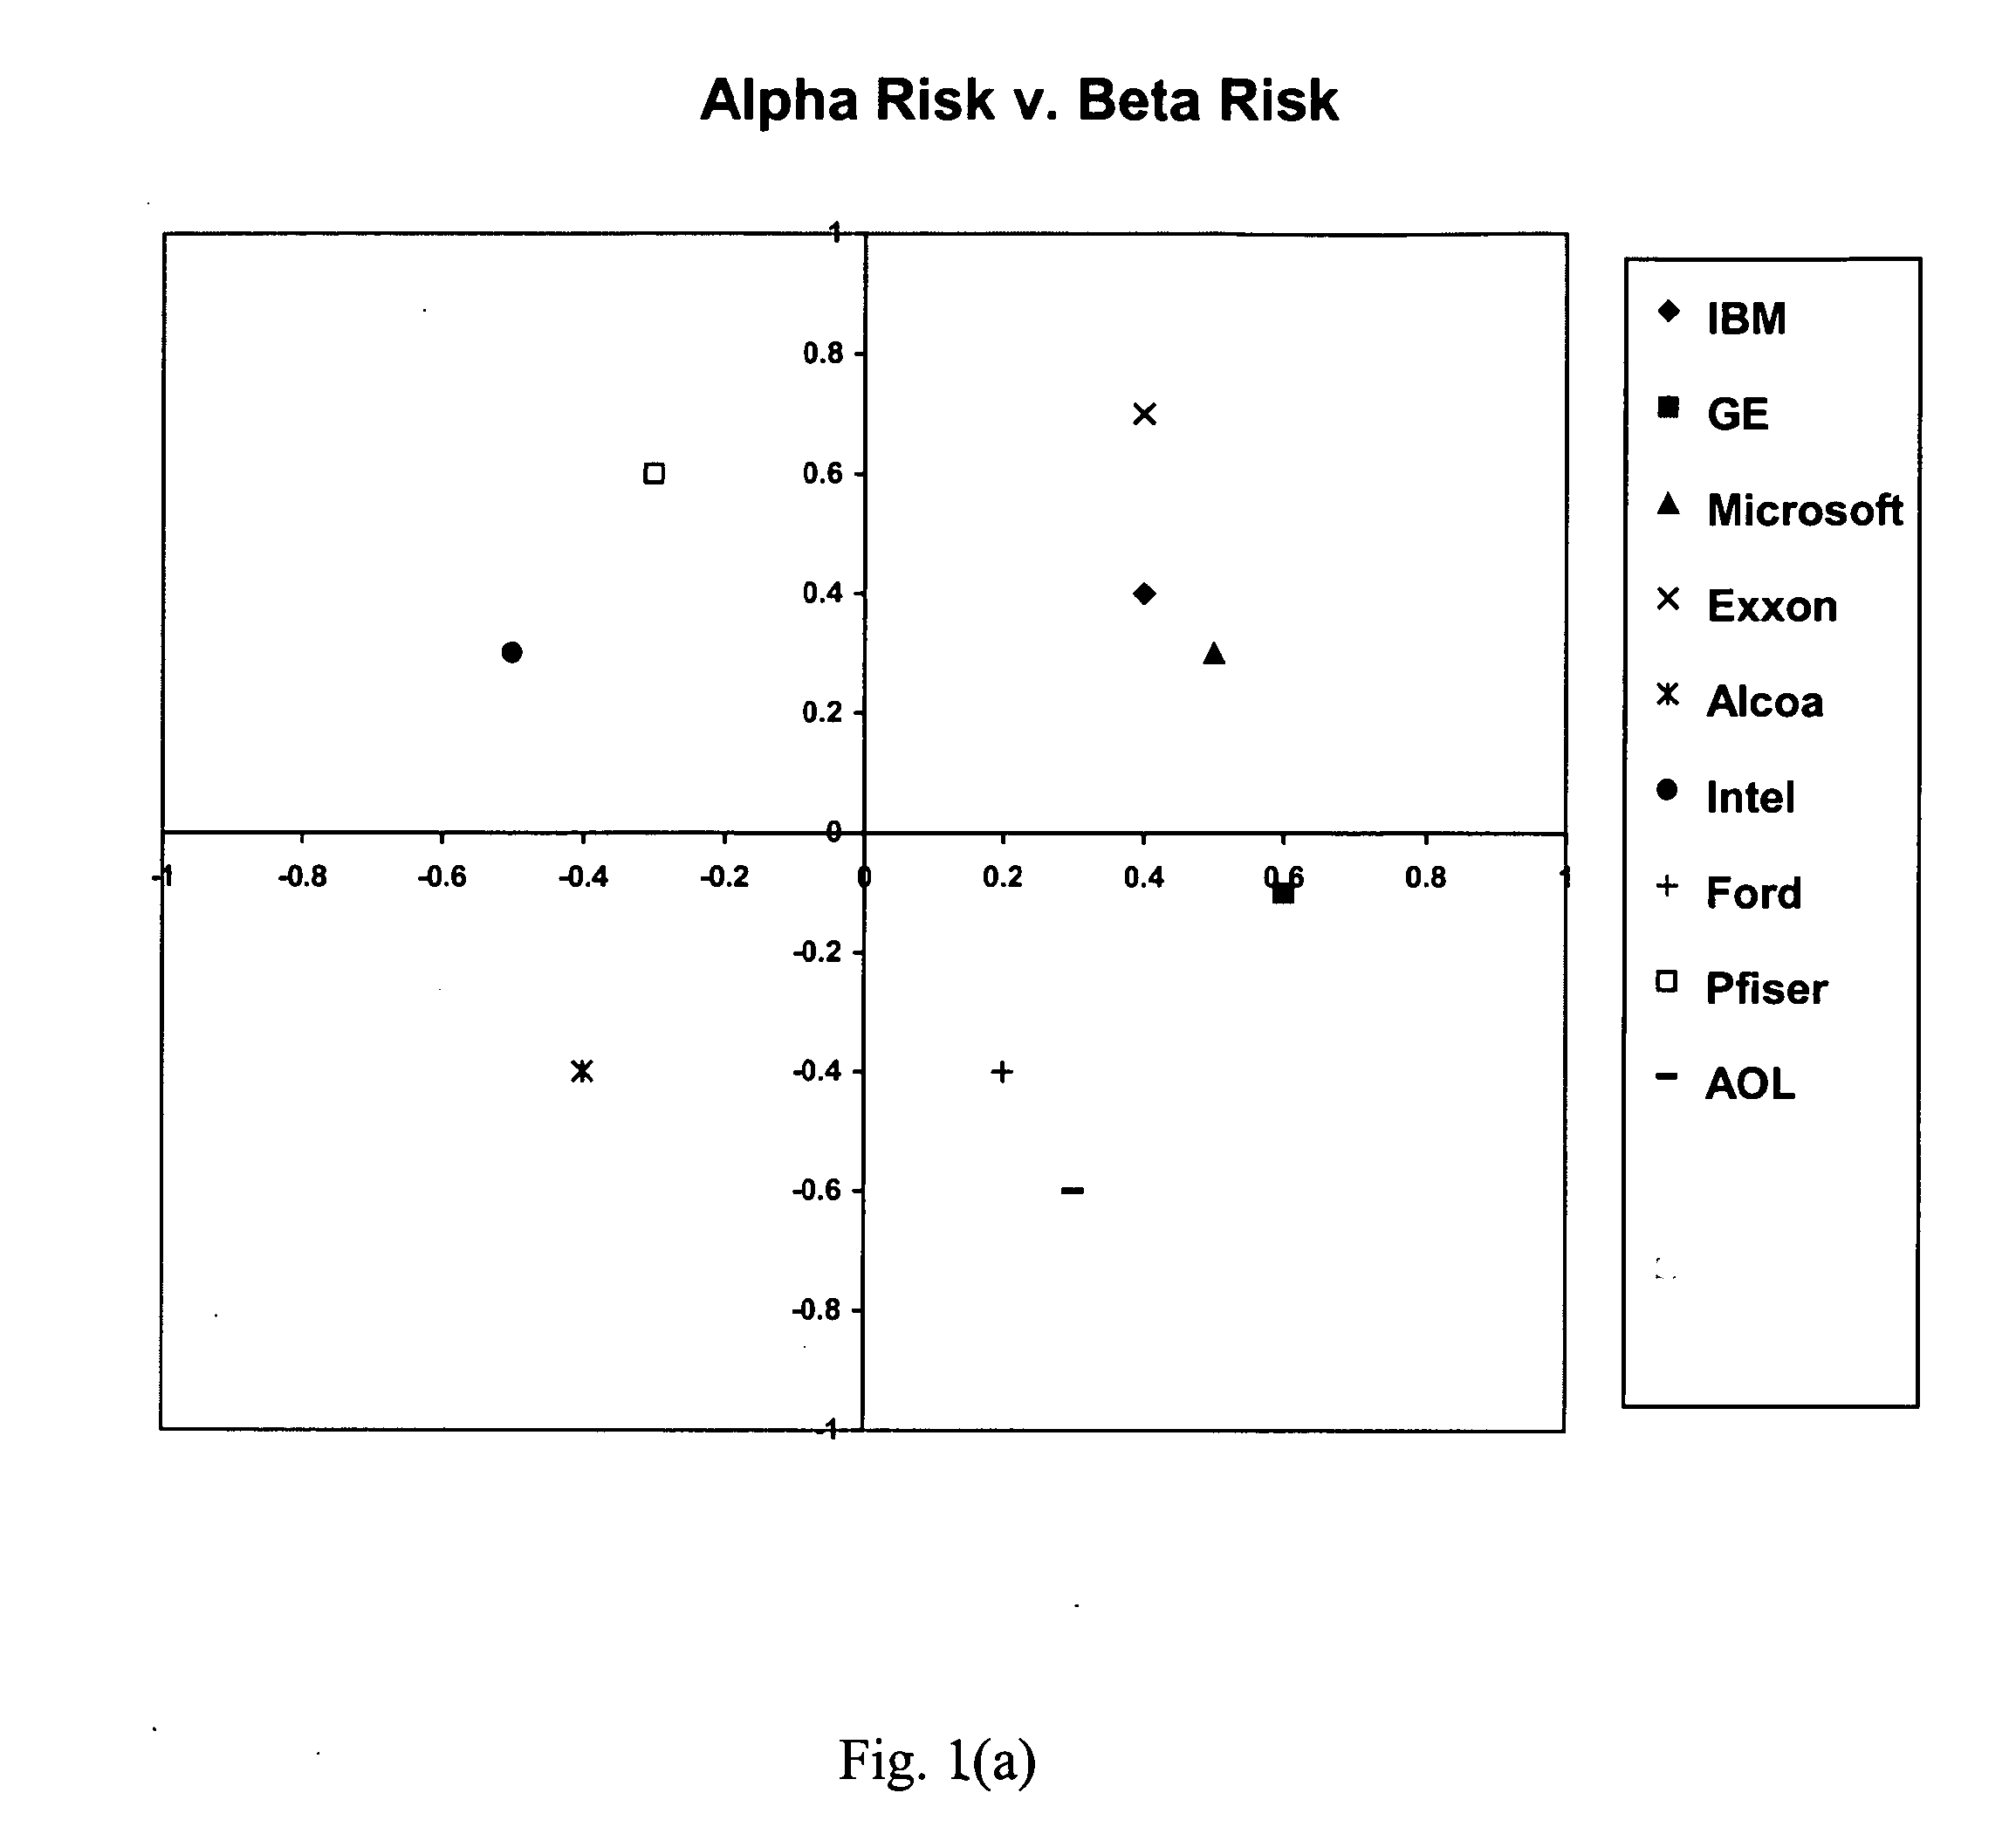
[0060]Referring first to FIG. 1(a), there is shown a chart according to the prior art for presenting information relating to certain financial information. In FIG. 1(a) the x-axis represents the level of α risk for equity based securities at a fixed point in time, and the y-axis represents the level of β risk of those same securities at the same point in time. Each of the symbols depicted in FIG. 1(a) represents an equity based security and is located at a position representative of its α and β risk. In the view presented, the risk is fairly easy to characterize. However, a very limited amount of information can be presented in such a chart because of the lack of depth of field. FIG. 1(a) by itself is a fair representation of the capabilities of the prior art for providing and displaying this information for analytical purposes.

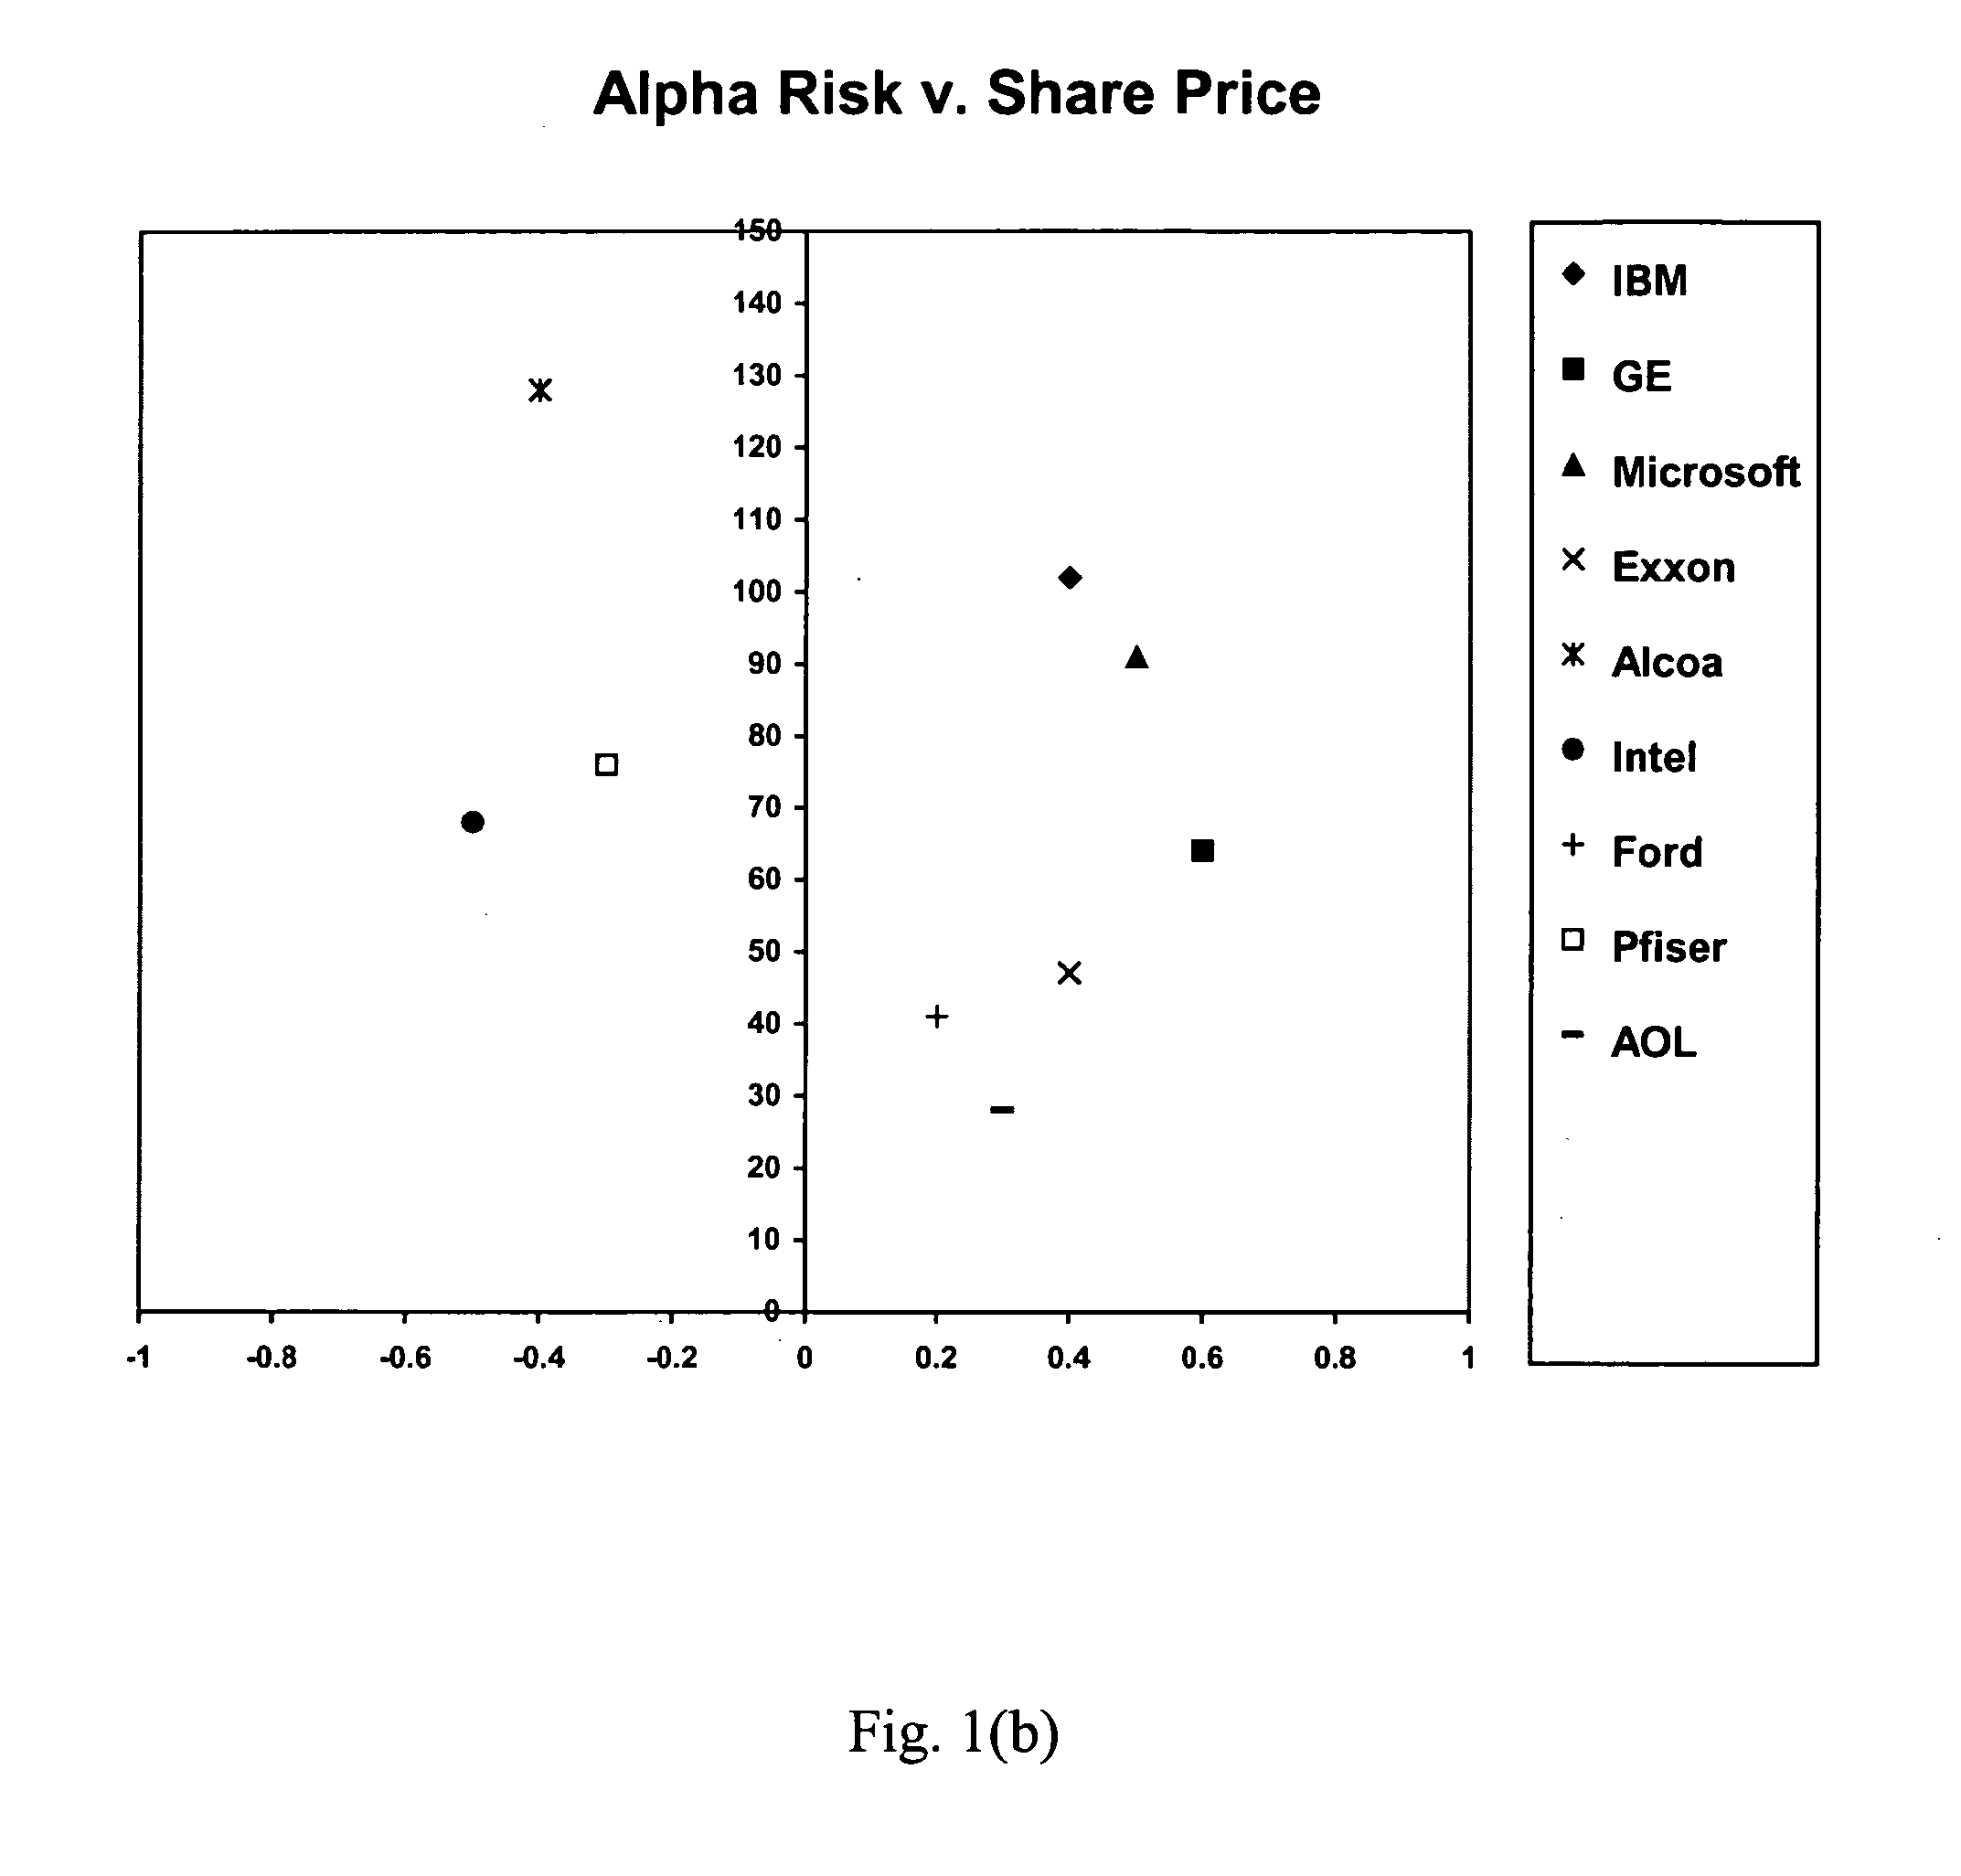
[0061]In FIG. 1(b) there is shown a chart where the x-axis represents the level of a risk for equity based securities at a fixed point in time and where the ...


PUM


Abstract

In a method and apparatus for performing an analysis and other activities using one or more two- or three-dimensional representational images, presenting a two- or three-dimensional representational image containing analytical information to assist in the analytical process. One or more two- or three-dimensional representational images are created, e.g., using standard photography, holography or computer imaging, and are placed in a positioner for use by the analyst. The representational images are illuminated using a light source and the analyst utilizes the information released from the representational image to perform an analysis.

Description

CROSS REFERENCE TO RELATED APPLICATION[0001]This application claims priority to U.S. Provisional Application Ser. No. 60 / 335,038, filed Oct. 30, 2001, U.S. Provisional Application Ser. No. 60 / 343,381, filed Dec. 21, 2001, and U.S. Provisional Application Ser. No. 60 / 343,374, filed Dec. 21, 2001.FIELD OF THE INVENTION[0002]The present invention relates to a method for creating and using representational images, including holographic representational images in various activities, including, but not limited to, data analysis, short and long range planning, statistical analysis, projections, forecasting, strategic analysis, decision making, scheduling and routing. According to the present invention representational images, including holographic representational images may be used to enhance accurate analysis, facilitate improved presentation and comprehension of information, and implementation and quality of tasks associated with such information, and reduce errors and misinterpretation...

Claims


Application Information

Patent Timeline
Patent Type & Authority Applications(United States)
IPC IPC(8): G06K9/76G06T11/20
CPCG06K9/76G06T11/206
Inventor ERICKSON, RONALD R.BOCK, JOEL N.SANDLER, ELIEZER D.
Owner ERICKSON RONALD R
Why Eureka
Try Eureka